HAL Id: hal-00423673
https://hal.archives-ouvertes.fr/hal-00423673
Submitted on 6 Nov 2009
HAL is a multi-disciplinary open access
archive for the deposit and dissemination of
sci-entific research documents, whether they are
pub-lished or not. The documents may come from
teaching and research institutions in France or
abroad, or from public or private research centers.
L’archive ouverte pluridisciplinaire HAL, est
destinée au dépôt et à la diffusion de documents
scientifiques de niveau recherche, publiés ou non,
émanant des établissements d’enseignement et de
recherche français ou étrangers, des laboratoires
publics ou privés.
Interpretation of intracerebral-EEG epileptic spikes
from detailed modeling of neural networks
Sophie Demont-Guignard, Pascal Benquet, G. Coiret, U. Gerber, Fabrice
Wendling
To cite this version:
Sophie Demont-Guignard, Pascal Benquet, G. Coiret, U. Gerber, Fabrice Wendling.
Interpreta-tion of intracerebral-EEG epileptic spikes from detailed modeling of neural networks. 4th
Inter-national IEEE EMBS Conference on Neural Engineering, Apr 2009, Antalya, Turkey. pp.530-533,
�10.1109/NER.2009.5109350�. �hal-00423673�
Interpretation of intracerebral-EEG epileptic spikes
from detailed modeling of neural networks
S. Demont-Guignard
1, P. Benquet
2, G. Coiret
3, U. Gerber
3, F. Wendling
11-INSERM U642; Université de Rennes 1; Rennes; F-35000; 2-CNRS UMR6026; Université de Rennes 1; Rennes; F-35000; 3-Brain Research Institute; Zurich; CH-8057
sophie.demont@univ-rennes1.fr
Abstract-This paper deals with the interpretation of the
macroscopic features of epileptic spikes recorded in human hippocampus based on a neural network model of the CA1 subfield. The network consists of principal cells (pyramidal neurons) and local interneurons and uses GABAergic and glutamatergic synapses. For pyramidal cells, this paper introduces a novel two-compartment model that was developed using published data and our own experimental data (intracellular recordings, in vitro). For interneurons, single-compartment models published elsewhere were implemented. The forward problem was solved to calculate the local field potential generated by the network. Our results show that: i) the ‘reduced’ model approach allows for simulations including a relatively large number of cells, ii) for appropriate changes in model-parameters (related to synaptic transmission), the model can generate “spike” events that closely resemble actual epileptic spikes and iii) some features of spike shape (amplitude, duration) can be explained by the degree of excitatory and inhibitory drive to pyramidal cells.
computational modeling; hippocampus; CA1; local field potentials; epilpetic spikes
I. INTRODUCTION
Epilepsy is a neurological disorder that affects about 1% of the population worldwide. In 30% of the cases, this pathology remains drug-resistant and surgery may be indicated. The recording of electrophysiological signals with depth electrodes (intracerebral EEG) during the pre-surgical evaluation can provide reliable information about brain structures involved during epileptic discharges. This information consists of specific “events” recorded either during interictal periods (epileptic spikes) or during ictal periods (seizures). However, for both types of events the underlying mechanisms of generation are not completely understood. Further advances are necessary to allow a better interpretation of intracerebral EEG signals in relation to cell-related or network-related parameters, possibly altered in epileptogenic conditions. In this study, we strictly focused on epileptic spikes observed in patients during intracerebral recording. We limited our study to the hippocampus, a sub-cortical structure commonly involved in temporal lobe epilepsy. The main objective was to develop a physiologically and biophysically plausible neural network model (CA1 subfield) at the cellular level that would provide a link between field activity (as recorded by depth electrodes) and activity generated in interconnected neurons and interneurons (pyramidal, basket and OLM cells) included in the
modeled hippocampal network. From this model we simulated events that closely resemble actual epileptic spikes. We also identified specific model parameters that affect the amplitude and duration of epileptic spikes. In particular, the shape of the early fast component and the late slow component of the epileptic spike could be linked to the relative contribution of glutamatergic and GABAergic synaptic currents in pyramidal cells, controlled, in the model, by modifying membrane conductance.
II. DETAILED MODEL OF CA1 SUBFIELD
A. Model of the CA1 pyramidal neuron
Multi-compartment models of pyramidal cells were first proposed during the 1980s in the pioneering work by Traub and colleagues [1]. For the CA1 and CA3 subfields, various models have been created ranging from very detailed representations (up to several thousands of compartments) to more simplified approaches (1 or a few compartments). We have followed the latter approach in developing a two-compartment ‘reduced’ model of the CA1 pyramidal cell in line with Pinsky and Rinzel’s work on CA3 cells [2]. Our model is minimal but still biologically-inspired. The objective was to find a good compromise between physiological relevance and computing time. Based on the Hodgkin and Huxley formalism [3, 4], the model entails distinct somatic and dendritic membrane properties. According to this formalism, the cell membrane acts as a capacitor C connecting the membrane potential Vm to currents passing through the
membrane. With I(t) the injected input current, the equation of conservation of electric charge is:
( )
= +∑
( )
ion ion m I t dt dV C t I (1) where∑
ion ionI
is the sum of ionic currents, where Iion is givenby Iion =gion.x.y.(V−Eion) (2)
In eq. 2, gion represents the ionic conductance; x.y (the product
of the gating variables) is the open-channel probability and Eion
the reversal potential. Special attention was paid to the selection of the main ionic channels (voltage-gated and leak) included in the model. In this respect, it differs from the literature in that it accounts for more currents than classical reduced models. Current equations were taken from more detailed models published elsewhere and summarized in [5]. Currents were selected based on a review of the literature. A
validation was performed using data recorded in an experimental model (organotypic rat hippocampal slices). A schematic diagram of the neuron model is shown in fig. 1-a. In brief, the shape of the action potential (AP) is mainly controlled by voltage-dependent sodium, potassium and calcium currents (INa, IKDR, low and high threshold ICa). In
addition, to replicate physiological firing rates potassium channels activated by intracellular calcium ions were added (after-hyperpolarisation current IAHP). Similarly, we also
included a rapidly inactivated potassium current (IKA, present
only in the dendritic compartment [6] to reproduce the change of density of ion channels along the membrane) in consideration of its potential role in epileptiform activity, as well as a hyperpolarization-activated cationic current (Ih,
dendritic compartment [7]) and a muscarinic potassium current (Im, [8, 9]).
Conductance values were identified by parameter sensitivity analysis of the reduced model. As shown in fig. 1-b, parameters were adjusted to reproduce intracellular experimental data both under control and in ‘epileptic’ conditions induced with 4-aminopyridine (4AP). As depicted in fig. 1-c, blocking IKA caused the model to switch from normal
to burst activity, as also observed experimentally.
Figure 1. a) Reduced pyramidal neuron model (two compartments). Transmembrane currents are defined and discussed in section 2.A. Coupling
strength between soma and dendrites is ensured by conductance gc. b)Left:
real AP recorded in a CA1 pyramidal cell (patch-clamp technique, current-clamp, whole cell mode, organotypic hippocampal slice culture) stimulated
during 10 ms at 0.3 nA on the cell body. Right: The model was stimulated with a current pulse of 60 pA/cm² during 10 ms injected at the soma. Both plots represent the time course of the somatic membrane potential. c) Voltage somatic responses to step current injections of 300 ms in control and
in presence of 4AP. The model was stimulated with a current pulse of 300 ms. The inactivating potassium conductance value (gKA) was 15 mS/cm²
(4AP) and 55 mS/cm² (control).
B. Models of CA1 OLM and basket interneurons
The neural network model reproduces some of the cellular organization of CA1, by integrating basket and oriens-lacunosum moleculare (OLM) interneurons. These cells are represented by single compartment models taken from the literature [10].
C. Network features
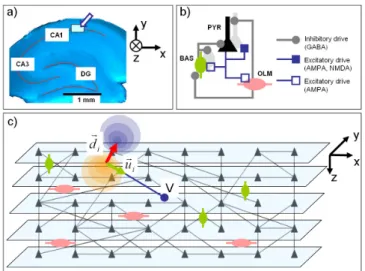
Network simulations used glutamatergic (AMPA and NMDA) and GABAergic synapses. Simulated cells were connected to reproduce the CA1 circuit (fig. 2-a and 2-b) in accordance with commonly accepted assumptions (location of synapses and receptors, synaptic strength, connectivity patterns). The number of cells was gradually increased to check for scalability effects. The number of pyramidal cells (resp. interneurons) was 80% (resp. 20%) of an arbitrary-chosen total number of cells. Regarding connectivity patterns, the number of connections per cell and the maximum distance between two connected cells were fixed according to the literature. The probability of connection was based on a Gaussian distribution: physiologically, the probability of connection between two neurons is larger when the two cells are close, and is null beyond the maximum distance. Pyramidal neurons and interneurons evenly distributed in a 3D space, as shown in fig. 2-c. Finally, the whole network was stimulated with an afferent volley of quasi-synchronous action potentials coming from an “external array of cells” (not represented in fig.2). The objective was to mimic the input from CA3 to CA1.
III. RECONSTRUCTION OF LOCAL FIELD POTENTIALS
The dipole theory was used for the calculation of the model local field potential (LFP) with the following assumptions. First, the main contribution to the LFP comes from pyramidal cells due to their spatial arrangement ‘in palisades’. Second, each pyramidal cell is considered as a point source (current dipole formed by a sink and a source) positioned within a volume conductor characterized by a homogeneous conductivity. Third, according to the superposition theorem, the contributions of all pyramidal cells sum up instantaneously at the level of the extracellular recording electrode, placed at the center of the modeled network (typically, at the middle of the dendritic tree along the somatodendritic axis, see fig. 2-c). According to these postulates, the potential Vi of the electric
dipole corresponding to cell i is: 2 4 . i i i i r u d V σ π G G = (3)
where σ is the conductivity, ri is the distance between cell i and
the measurement point (i.e. the recording electrode), ui
G is a unit vector on the line going from the origin of dipole vector i and the recording point,di
G
is the dipole moment. Moreover, the total potential V engendered at the level of the recording electrode is given by:
∑
= = N i i V V 1 (4)
where N is the total number of pyramidal cells. In order to compute V, the dipole moment di
G
our reduced two-compartment model of the pyramidal cell, we assuming that the sink and the source are located at the level of the somatic compartment and the dendritic compartment, respectively. Therefore, the magnitude of the dipole momentdi
G
, which corresponds to the value of the longitudinal current flowing along the somatodendritic axis, can be estimated as a function of the dendritic and somatic membrane potential obtained by numerical integration:
i i c i d i s i V V g l S
dG = − . . . where i is the cell index, Vsi and
i d
V , respectively, denote the somatic and dendritic membrane potential, gc is the coupling conductance between the somatic
and dendritic compartments, li is the distance between the sink and the source, and Si is the total membrane surface. Regarding
the numerical values, we chose gc = 1 mS.cm-2, li = 350 µm
(half of the size of the dendritic tree). For Si, we assumed that
the soma approximates a sphere of radius R = 8 µm (Ssoma =
4.π.R²) and that the ratio Ssoma / Si = 0.15 as in [2].
Figure 2. Network features and calculation of the field potential. a) The network model reproduces essantial features of the CA1 subfield (hippocampus) b) The network includes pyramidal cells (PYR) decribed by a
two-compartment model as well as basket (BAS) and oriens-lacunosum moleculare (OLM) cells each described by a single-compartment model. The
respective percentages of cells and the connectivity patterns (synaptic interaction only) were obtained from the literature. c) The field potential is
calculated by solving the forward problem from the network to the measurement electrode (V) using dipole theory.
IV. RESULTS: MODEL-BASED INTERPRETATION OF EPILEPTIC SPIKES
Simulations were run for networks of 640 pyramidal cells, 80 basket cells and 80 OLM cells. Software was written in C and objective-C language. Differential equation systems were solved using a 4th order Runge-Kutta algorithm (fixed step).
Computation time was about 7 minutes for 800 ms of activity at a sampling frequency of 25 kHz, on a PC-type computer (quad-core running under MS Win. XP).
A. Real versus simulated spikes
Figure 3 shows examples of real epileptic spikes recorded in human hippocampus. One can note that the amplitude of the early fast component (spike) and the duration of the late slow component (negative wave) strongly differ from one event to another. In a first step, we increased the conductance values associated with glutamatergic currents and verified that the model was able to produce a “spike” with an “average” shape similar to epileptic spikes observed in the depth-EEG signals (fig. 3-c). In a second step, we quantified the effects of these conductance values on two “macroscopic” features of the spike: the peak-to-peak amplitude (A) and the duration (D) as defined in fig. 3-b.
Figure 3. Epileptic spikes recorded from the hippocampus in a patient with TLE in comparison with simulated spikes a) Spikes were visually extracted from a 1-hour depth-EEG recording and were sorted according to increasing amplitude.Although spikes are commonly characterized by a fast early component followed by a slower late component, this figure shows the variability of interictal events in terms of amplitude (A) and duration (D), as
defined in b). c) Example of simulated spike (local field potential).
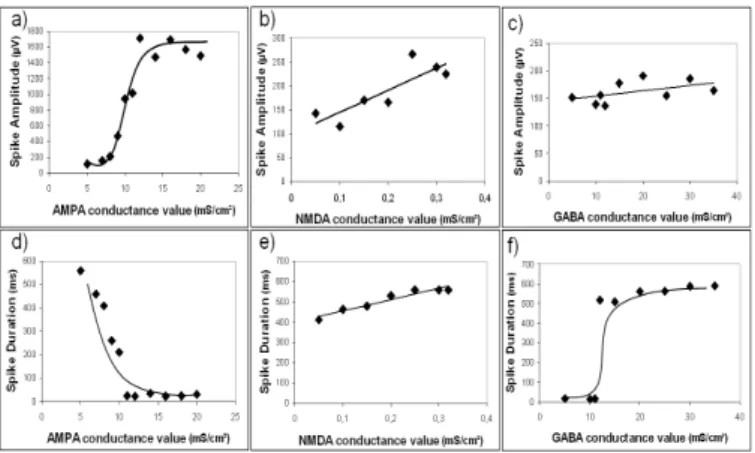
B. Effects on spike amplitude
Fig. 4-a shows the effect of the AMPAergic synaptic current. This current is required for spike generation. When the conductance value increased from 5 mS/cm² to 15 ms/cm², the amplitude increased by a factor of 30. This amplitude increase also appeared when the NMDA conductance value was increased but to a lesser extent (fig. 4-b). The effect of changing the GABA conductance value is very weak (fig. 4-c).
C. Effects on spike duration
Increasing the AMPA conductance was found to shorten spike duration (fig. 4-d). Conversely, GABAergic synaptic current had a major impact on spike duration with an increase of 600% when the conductance value was multiplied by 7 (fig. 4-e). The NMDA synaptic current also played a role: the spike duration varied linearly with an increase of 130% over the same conductance range as in a) (fig. 4-f).
Figure 4. Influence of synaptic current conductance values on the spike amplitude (a, b, c) and duration (d, e, f). Each parameter is varied independently from the others, starting from the control condition.
V. DISCUSSION AND CONCLUSION
Intracellular recordings are reasonably well described in terms of the properties of excitable membranes. However, the interpretation of extracellular signals, in particular those reflecting the activity of neuronal networks, has proven to be a challenging and still unsolved issue. Difficulties mainly stem from the complexity of the recorded networks of neurons. The predominance of nonlinear mechanisms give rise to complex interactions that complicate the relationship between network activity and recorded activity. Computational modeling provides insights into this complexity as biologically-inspired models can act as bridges between sub-cellular/cellular/network parameters and electrophysiological observations [11]. In the context of epilepsy, the present study is an attempt to identify relationships between “macroscopic” features (amplitude, duration) of interictal events and the basic parameters involved in excitatory and inhibitory synaptic transmission (conductances associated with glutamatergic and GABAergic currents) in neuronal networks. The main findings of this study are summarized below.
First, for a physiologically relevant stimulation (an afferent volley of quasi-synchronous action potentials mimicking the input from CA3 to CA1), the model was able to reproduce spikes relatively similar to epileptic spikes. Simulated events showed peak-to-peak amplitudes ranging from several hundreds of µV to 1 mV. These values are compatible with actual amplitude values and confirm that the assumptions we introduced for solving the forward problem (section III) are reasonable. In this respect, our study differs from studies published elsewhere in which authors used the total transmembrane current to calculate the field potential [12-14]. Here the contribution of each pyramidal cell was represented by an equivalent current dipole that reflects longitudinal current along the somato-dendritic axis.
Second, the model reflects the major role of the AMPA conductance in both the generation of the spike and its amplitude. Our model also shows a slight influence of the NMDA conductance on spike amplitude. Conversely, the GABA conductance value was found to have no effect. These
results corroborate experimental findings showing that the non-NMDA receptor antagonist CNQX (20 µM) as well as NMDA antagonists abolished interictal spikes [15].
Third, regarding spike duration, a distinction must be made between the early fast component and the late slower component. The duration of the former was mainly influenced by the AMPA conductance value (“sharpness” of the spike) whereas the latter was affected by both the GABA conductance value and, to a lesser extent, by AMPA/NMDA conductance values. These results are also in line with experimental data showing that the duration of the late part of the extracellular IS was reduced by the NMDA receptor antagonist APV [16].
In this study we restricted our analysis to the effects of specific network-related parameters on the shape of the spike. There are many other parameters to be studied in the model. For instance, connectivity patterns could also be considered as free parameters. Indeed, recent studies showed that network excitability is enhanced for particular configurations of connections between cells [17]. The influence of cell-related parameters should also be studied, as several reports showed that the properties of ion channels can be altered in epilepsy. Indeed, upregulation of excitatory glutamatergic receptors in the dendate gyrus has been observed in both human and animal models of hippocampal sclerosis and may contribute in the development of chronic seizures through increased excitatory transmission [18, 19]. Our approach allows these issues to be addressed in future studies as the model represents all of the main ion channels, and the ‘reduced’ pyramidal cells and interneurons maintain the computation time for solving the differential equations at a reasonable level.
ACKNOWLEDGMENT
S. Demont-Guignard is supported by the Region Bretagne. REFERENCES
[1] R. D. Traub and R. K. Wong, Science, vol. 216, pp. 745-7, 1982. [2] P. F. Pinsky and J. Rinzel, J Comput Neurosci, vol. 1, pp. 39-60, 1994. [3] A. L. Hodgkin and A. F. Huxley, J Physiol, vol. 116, pp. 473-96, 1952. [4] A. L. Hodgkin, A. F. Huxley, and B. Katz, J Physiol, vol. 116, pp. 424-48, 1952. [5] P. Poirazi, T. Brannon, and B. W. Mel, Neuron, vol. 37, pp. 977-87, 2003. [6] D. A. Hoffman, J. C. Magee, C. M. Colbert, and D. Johnston, Nature, vol. 387,
pp. 869-75, 1997.
[7] M. L. Mayer and G. L. Westbrook, J Physiol, vol. 340, pp. 19-45, 1983. [8] B. Lancaster and P. R. Adams, J Neurophysiol, vol. 55, pp. 1268-82, 1986. [9] B. Lancaster and R. A. Nicoll, J Physiol, vol. 389, pp. 187-203, 1987.
[10] M. Hajos, W. E. Hoffmann, G. Orban, T. Kiss, and P. Erdi, Neuroscience, vol. 126, pp. 599-610, 2004.
[11] F. Wendling, Expert Rev Neurother, vol. 8, pp. 889-96, 2008.
[12] A. C. Almeida, V. M. Fernandes de Lima, and A. F. Infantosi, Phys Med Biol, vol. 43, pp. 2631-46, 1998.
[13] P. Varona, J. M. Ibarz, L. Lopez-Aguado, and O. Herreras, J Neurophysiol, vol. 83, pp. 2192-208, 2000.
[14] P. Erdi, Z. Huhn, and T. Kiss, Neural Netw, vol. 18, pp. 1202-11, 2005. [15] M. de Curtis, C. Radici, and M. Forti, Neuroscience, vol. 88, pp. 107-17, 1999. [16] M. de Curtis and G. Avanzini, Prog Neurobiol, vol. 63, pp. 541-67, 2001. [17] R. J. Morgan and I. Soltesz, Proc Natl Acad Sci U S A, vol. 105, pp. 6179-84,
2008.
[18] G. W. Mathern, J. K. Pretorius, H. I. Kornblum, D. Mendoza, A. Lozada, J. P. Leite, L. M. Chimelli, I. Fried, A. C. Sakamoto, J. A. Assirati, M. F. Levesque, P. D. Adelson, and W. J. Peacock, Brain, vol. 120 ( Pt 11), pp. 1937-59, 1997. [19] I. Blumcke, A. J. Becker, C. Klein, C. Scheiwe, A. A. Lie, H. Beck, A. Waha,
M. G. Friedl, R. Kuhn, P. Emson, C. Elger, and O. D. Wiestler, J Neuropathol