Contents lists available atScienceDirect
Journal of School Psychology
journal homepage:www.elsevier.com/locate/jschpsycAgreement among student, parent and teacher ratings of school
inclusion: A multitrait-multimethod analysis
Susanne Schwab
a,b, Carmen L.A. Zurbriggen
c,⁎, Martin Venetz
daUniversity of Vienna, Austria
bNorth-West University, South Africa
cUniversity of Bielefeld, Germany
dUniversity of Applied Sciences of Special Needs Education Zurich, Switzerland
A R T I C L E I N F O Action Editor: Tai Collins Keywords: Emotional inclusion Social inclusion Academic self-concept MTMM Multi-informant research A B S T R A C T
One of the central objectives of inclusive education, and education in general, is not only to support every students' academic learning, but also their social and emotional development. It therefore is important to identify difficulties in a child's socio-emotional development at school. The current study investigates students' emotional inclusion and social inclusion, as well as students' academic self-concept from four different perspectives using the Perceptions of Inclusion Questionnaire (PIQ). In particular, we analyzed the degree of agreement between teacher, mother, and father ratings with students' self-reports. Moreover, we tested if students' gender and special educational needs (SEN) are predictors for possible bias in parent and teacher reports. Survey participants included 721 Austrian, Grade 4 students from 48 classes. In addition, data from 46 teachers, 466 mother reports, and 375 father reports were included. We assessed the consistency (i.e., agreement) between the different raters by means of multitrait-multimethod analyses, or more precisely, a correlated trait–correlated method minus one (CT-C[M-1]) model. Results of the CT-C(M-1) analyses indicated a rather strong rater bias (i.e., method effects) for all three dimensions of inclusion. However, the consistency for academic self-concept was higher than for emotional and social inclusion. Furthermore, gender and SEN status affected rater bias, particularly for teacher reports. Results suggested that it matters who reports students' emotional inclusion, social inclusion, and academic self-concept, which has methodological and practical implications.
1. Introduction
Educational reforms and school development processes towards inclusive education have been endorsed by worldwide changes in educational policies (e.g., the UN-Convention on the Rights of Persons with Disabilities,United Nations, 2007; the Individuals with Disabilities Education Act,IDEA, 1997). As the number of students with special educational needs (SEN) in regular schools has increased, so has research focusing on the outcomes of inclusive education. Inclusion does not simply require placing children with SEN in regular classes (Armstrong, Armstrong, & Spandagou, 2011); rather, inclusion focuses on the academic and socio-emotional development of all students (Schwab, 2020). This focus has led to a paradigm shift in research as well, which is increasingly focusing on the non-academic development of students, and, in addition, often includes diverse perspectives (e.g., students' voices, teachers' ratings, and parents' opinions).
https://doi.org/10.1016/j.jsp.2020.07.003
Received 10 July 2019; Received in revised form 24 February 2020; Accepted 6 July 2020
⁎Corresponding author at: Faculty of Educational Science, University of Bielefeld, Postfach 10 01 31, 33501 Bielefeld, Germany. E-mail address:carmen.zurbriggen@uni-bielefeld.de(C.L.A. Zurbriggen).
0022-4405/ © 2020 The Authors. Published by Elsevier Ltd on behalf of Society for the Study of School Psychology. This is an open access article under the CC BY license (http://creativecommons.org/licenses/BY/4.0/).
1.1. Emotional inclusion, social inclusion, and academic self-concept at school
Scanning existing studies about inclusive education, one can see that past studies have strongly focused on students' academic achievement (Oh-Young & Filler, 2015;Ruijs & Peetsma, 2009). However, researchers not only have analyzed achievement variables but also socio-emotional aspects in previous decades. In this context, three major outcome variables have already been extensively discussed in the literature: (a) emotional inclusion (McCoy & Banks, 2012;Skrzypiec, Askell-Williams, Slee, & Rudzinski, 2016), (b) social inclusion (reviews byBossaert, Colpin, Pijl, & Petry, 2013;Koster, Pijl, & van Houten, 2009;Ruijs & Peetsma, 2009;Schwab, 2018), and (c) academic self-concept (meta-analysis byBear, Minke, & Manning, 2002; review byChapman, 1988), or all three (i.e., emotional inclusion, social inclusion, academic self-concept;DeVries, Voß, & Gebhardt, 2018;Venetz, Zurbriggen, & Eckhart, 2014; Venetz, Zurbriggen, & Schwab, 2019). These three variables have been investigated during the past years because of their re-lationship with academic outcomes on the one hand but also with students' general life satisfaction on the other hand. In recent years, there has been a trend towards embracing positive psychology in schools (e.g.,Gilman, Huebner, & Furlong, 2014). For instance, the review ofSuldo, Riley, and Shaffer (2006)highlighted the importance of students' self-perceptions of their own abilities, school satisfaction (as a domain-specific indicator for well-being), and relationships (e.g., with peers) for learning and life satisfaction.
1.2. Students with SEN at risk of lower academic self-concept, lower social inclusion, and emotional inclusion
Researchers have examined these three concepts to explore whether or not students with SEN are at-risk student groups in terms of inclusive education. Evidence for lower academic self-concept of students with SEN compared to their peers has already been collected in previous studies (Bear et al., 2002;Cambra & Silvestre, 2003;Zeleke, 2004). With regard to social inclusion, previous studies show that students with SEN have fewer friends in their classes and less interaction with their peers. They are less socially accepted and are more likely to feel lonely (Bossaert et al., 2013;Koster et al., 2009;Ruijs & Peetsma, 2009;Schwab, 2018). Focusing on emotional well-being in school, some studies have indicated less emotional well-being for students with SEN compared to students without SEN (McCoy & Banks, 2012;Skrzypiec et al., 2016), whereas others find no differences between groups (Zurbriggen, Venetz, & Hinni, 2018).
1.3. Assessing students' emotional inclusion, social inclusion and academic self-concept using the Perception of Inclusion Questionnaire (PIQ)
The increased attention to these aspects requires instruments that can be utilized not only in research, but also in school practice. Therefore, there was a need for a short screening instrument that teachers can easily administer in schools. One instrument that assesses these three variables from different perspectives (students, teachers, and parents) is the Perception of Inclusion Questionnaire (PIQ;Venetz, Zurbriggen, Eckhart, Schwab, & Hessels, 2015), which is intended for use with students from Grades 4 to 9. The PIQ can be utilized both in research and in practice. For instance, teachers can use this screening instrument to get indications whether further individual diagnoses with regard to a student's emotional inclusion, social inclusion, or academic self-concept are necessary. In this context, comparing the teacher's perspective with the student's own view might provide particularly pertinent information.
According toVenetz et al. (2014), emotional inclusion refers to the student's emotional well-being in schools, which especially indicates how much a student likes school as one facet of school well-being. Social inclusion refers to the student's peer relationships in class and it includes friendships as a positive indicator and feelings of loneliness as a negative indicator, among others. Academic self-concept within the PIQ refers to the student's perception of his or her general academic abilities (e.g., related to working speed and solving tasks). Previous studies have shown that the student version of the PIQ (PIQ-S) has high internal consistency (0.80 ≤ Cronbach's α ≤ 0.91;Venetz et al., 2014). Furthermore, no differential item functioning for students with and without learning difficulties was found. A minor bias was detected for only one item (“I am a fast learner”) out of the 12 items (Zurbriggen, Venetz, Schwab, & Hessels, 2019). The development of the short questionnaire byVenetz et al. (2014)included an initial examination of the construct validity of the three scales (see electronic supplementary material available inZurbriggen et al., 2019). Support for the three-dimensional factor structure of the PIQ-S has also been found using confirmatory factor analyses (DeVries et al., 2018). Knickenberg, Zurbriggen, Venetz, Gebhardt, and Schwab (2019)demonstrated that the PIQ-S has measurement equivalence for students with and without learning disabilities (LD) in inclusive classes, as well as for students with LD attending special schools. These studies demonstrated that the scales possess strong measurement invariance across gender, academic achievement, German (the language of instruction) as a first or second language, and for students with SEN versus without SEN. A recent study reported high internal consistency for the teacher version (PIQ-T; 0.86 ≤ Cronbach's α ≤ 0.95;Venetz et al., 2019). The findings also support the three-factor structure of the PIQ-T. However, the parent version has not yet been tested for its factorial structure and internal consistency. Moreover, up until now the agreement between the three different versions has not been studied.
1.4. Assessing students' academic self-concept, social inclusion and emotional inclusion via multi-informants
When considering socio-affective development, self-reports of students are the type of assessments most frequently utilized as students are considered their own experts and no direct observation of these three variables is possible. Another reasonable alter-native assessment strategy is to assess a student's socio-affective variables through the reports of relevant others (e.g., proxies, such as teachers or parents). Within schools, teachers are primarily responsible for the evaluation of their student's current levels of func-tioning as doing so allows teachers to adapt their daily decisions to the student's individual needs—for instance, offering additional
support services. Several authors have stated why the multi-informant assessment can be useful (Achenbach, 2018;Koch, Kelava, & Eid, 2018;Miller et al., 2018); one reason is that the behavior of students might vary in different contexts, and different observers might perceive the behavior differently (Achenbach, 2018). Moreover, it is doubtful that single-method approaches provide complete information. Following the Realistic Accuracy Model ofFunder (1995, 2012), “accuracy in such judgments is achieved when relevant behavioral information is available to and detected by a judge, who then utilizes that information correctly” (Funder, 2012, p. 177). Benefits of multi-informant assessment when evaluating emotional and behavioral problems was also shown byvan der Ende, Verhulst, and Tiemeier (2012). For instance, their results indicated that children's self-ratings are typically higher compared to parents or teachers' ratings of internalizing and externalizing problems. Differences in ratings are of high relevance as they predict the success of treatment.De Los Reyes et al. (2015)argued that mental health concerns might be context-specific (e.g., home vs. school), and that this needs to be recognized and comprehended for future treatment.
As the three mentioned constructs (academic self-concept, social inclusion, and emotional inclusion) are variables, which are highly important for student's development, the agreement and differences in PIQ ratings between students, parents, and teachers are of interest. It also is doubtful whether the constructs are equivalent when assessed via self- and teacher-reports (Olino & Klein, 2015). In studies comparing student self-reports with teacher ratings, low to moderate agreement was found for academic self-concept (Praetorius, Berner, Zeinz, Scheunpflug, & Dresel, 2013;Zhu & Urhahne, 2014), well-being (Givvin, Stipek, Salmon, & MacGyvers, 2001;Zhu & Urhahne, 2014) and social inclusion (Kwon, Kim, & Sheridan, 2012). However, results have been relatively inconsistent, indicating accurate teacher estimations (e.g., well-being;Zhu & Urhahne, 2014), underestimated levels (e.g., academic self-concept; Zhu & Urhahne, 2014), or overestimated levels (e.g., social inclusion;Koster, Pijl, van Houten, & Nakken, 2007).
Venetz et al. (2019)compared student and teacher ratings of students' (a) well-being at school, (b) social inclusion, and (c) academic self-concept and showed that the correlations between the traits of the same raters were higher compared to the agreement of different raters on the same trait. Moreover, it is unclear how student characteristics, such as gender, influence the teachers' perceptions of the students. For instance,Roos et al. (2016)demonstrated that the interrater agreement between girls and teachers was higher than the agreement between boys and teachers. These results are in the line with those ofUrhahne and Zhu (2015), indicating a higher teacher accuracy in the rating of girls' social problems as compared to boys. In the context of SEN,Koster et al. (2007)showed that teachers estimated the social inclusion of students with SEN more positively than the student's peers. In line with these results,de Monchy, Pijl, and Zandberg (2004)demonstrated that teacher assessments of social inclusion show more positive results than sociometric assessment techniques.
Parents' perceptions of their children's academic self-concept, social inclusion, and emotional inclusion have largely been ignored in past research. One reason for this might be that parents cannot observe their children during school. Also, they might not be as easily recruited to participate in research as compared to students or teachers. However, asAchenbach (2018)proposed, including parents often adds an important perspective to research. With a focus on students' social inclusion, the descriptive results ofAdams, Harris, and Jones (2017)indicated a more positive view of students' social situation in parents' ratings as opposed to teachers. Schwab, Gebhardt, Hessels, and Nusser (2016)reported a generally low agreement between the children and parents' ratings when asked about peer problems. Furthermore, Schwab et al. also pointed out that the overlap in the sample of students with SEN, as compared to the sample of students without SEN, was smaller. In this context, the results fromKoster et al. (2007)indicated that parents rate the social position of students with SEN lower than their peer student.
Low agreement between different informants (i.e., students, parents, teachers) has also been observed with the scales of the Strength and Difficulties Questionnaire (SDQ;Goodman, 2001). For instance, in the study byEmerson and Hatton (2007)about 7% of the students with LD and 2% of those without LD fell into the ‘abnormal’ range according to the self-rating of peer problems. Within the teachers' ratings, the difference was 36% vs. 26% (in the same sample), and the parents assessed about 39% of the students with LD and 10% of those without LD in the ‘abnormal’ range. Furthermore,Gomez (2014)summarized for the SDQ subscale of peer problems that the convergence between the ratings of mothers and their children was higher than the student-teacher agreements.
1.5. Multitrait-multimethod analyses
Whereas most of the previous studies used Pearson correlation, Spearman correlation, or Cohens Kappa to estimate the agreement levels in multi-informant research, only a few studies have used multitrait-multimethod (MTMM) analysis. The classical MTMM matrix can be “viewed as a two-dimensional cross-classification of traits and methods” (Maas, Lensvelt-Mulders, & Hox, 2009, p. 72). One advantage of the approach is that it can be expanded into structural equation modeling through confirmatory factor analysis (CFA), which allows to control for measurement errors and to separate from other sources of variance such as the informant (Miller et al., 2018). In a CFA-MTMM model, there are separate latent factors of all traits for each type of method. Such a model, with multiple indicators per trait-method unit (TMU), corresponds to the so-called baseline TMU model for multimethod data, proposed by Marsh and Hocevar (1988).
A simple CFA-MTMM model is useful for estimating the degree of agreement between raters (e.g., student self-reports, parent and teacher reports) or between methods (e.g. student self-reports, parent interviews, and performance assessments). However, it does not provide information about the true convergent validity (i.e., error-free degree of convergence) between the different raters or methods (Geiser, Mandelmann, Tan, & Grigorenko, 2016). As traits are defined as factors that are common to all TMUs measuring the same trait, they cannot be separated from methods and thus, are not method-free (Eid, Lischetzke, Nussbeck, & Trierweiler, 2003). To identify method-specific influences, one must compare one method with the other method(s).
Therefore, a correlated trait–correlated method minus one (CT-C[M-1]) model (Eid, 2000;Eid et al., 2003) should be used to check the convergence between different raters. This model is a direct reformulation of a baseline TMU model (Koch et al., 2018). The
two models differ, however, in that the CT-C(M–1) allows examining the true convergent validity of a reference method (i.e., comparison standard) with other (non-reference) methods. In the CT-C(M–1) model, the part of a trait measured by a method that cannot be predicted by the reference method corresponds to the specificity of the non-reference method (i.e., method effect). Another advantage of the CT-C(M–1) model is the possibility to decompose the variance of an observed variable into variance components due to trait, method, and error influences, and thus to estimate variance coefficients (i.e., percentages of the variance components) of consistency, method specificity, and (un)reliability (Eid et al., 2003).
1.6. The present study
Until now, no study has investigated students', parents', and teachers' perspectives of students' academic self-concept, social inclusion, and emotional inclusion using the same multiple-item instrument. Moreover, no studies are available which compare the ratings of mothers and fathers of their child's academic self-concept, social inclusion, or emotional inclusion. One instrument that assesses these three variables from different perspectives is the Perception of Inclusion Questionnaire (PIQ;Venetz et al., 2015). However, the parent version has not yet been analyzed for its psychometric quality, and the agreement between the three different versions has not been studied. Therefore, the present study aimed to bridge this gap. Three specific aims of the study include:
1. Examination of the factor structure of the PIQ parent version and the reliability of the subscales (i.e. internal consistency). 2. Investigation of the consistency between student self-reports, parent reports, and teacher reports, as well as a possible bias
(so-called method effects or method specificity) of the parent and teacher ratings as compared to the student self-reports. Based on the results of the meta-analysis conducted byAchenbach, McConaughy, and Howell (1987)that focused on the assessment of students' behavioral, emotional, and social difficulties, rating-agreements of pairs (e.g., mother and father; pairs of teachers) are higher compared to less similar pairs (e.g., parent and teacher). Therefore, we hypothesized a higher agreement between both parents' reports than between student and teacher reports, or between parents' and student reports. Moreover, the correlation of similar informants (parents-parents) is expected to be higher than the correlation of different informants (student-teacher, student-parent, parent-teacher;Gresham et al., 2018).
3. To analyze whether two student characteristics (i.e., gender and SEN) can predict a method effect of parent and teacher reports. Based on previous literature outcomes, it can be assumed that teachers rate the social inclusion of students with SEN more positively as compared to students' self-report ratings (e.g.Koster et al., 2007). Furthermore, for parents, it can be expected that parents of students with SEN see their social inclusion less positively than the students' own ratings (e.g.Koster et al., 2007; Schwab et al., 2016). In addition, it is expected that the agreement between girls' self-ratings and other raters (e.g., parents and teachers) is higher than as compared to boys' self-ratings.
2. Method
2.1. Participants
The sample was drawn from 48 primary school classes in Styria (a Federal State in Austria), who took part in the Attitudes Towards Inclusive Schooling—Students, Teachers and Parents (ATIS-STEP) study. The participants were primary school students from classes that were attended by at least one student with an official diagnosis of SEN. In total, 48 primary schools took part in the survey. The proportion of participating students, out of all students in class, was approximately 84%. Reasons for dropouts consisted of parents or students not returning the consent form or students not being in school on the day of data collection. Finally, 721 students (357 girls, 364 boys) from 48 Grade 4 classrooms participated in the survey. Their age ranged from 8 to 10 years. Ninety-two of the students (12.8%) were diagnosed with SEN, with approximately 79% of these students with SEN having been diagnosed with a learning disability and less than 10% of these students with SEN having been diagnosed with a social-emotional disorder. Other included SEN categories were physical disabilities or a combination of several diagnoses. Students with severe mental disabilities could not take part in the study (as the instruments were not appropriate). Local school authorities in Austria are responsible for diagnosing SEN. A specialist teacher (trained to teach students with special educational needs) writes a report based on a broad assessment battery and the respective diagnosis is then based on this report (for further information seeSchwab, Kopp-Sixt, & Bernat, 2015). The teacher sample was comprised of 46 teachers. Two teachers did not take part. Data from 466 mother-reports (64.6%) and 375 father-reports (52.0%) were included in the analyses.
2.2. Measures
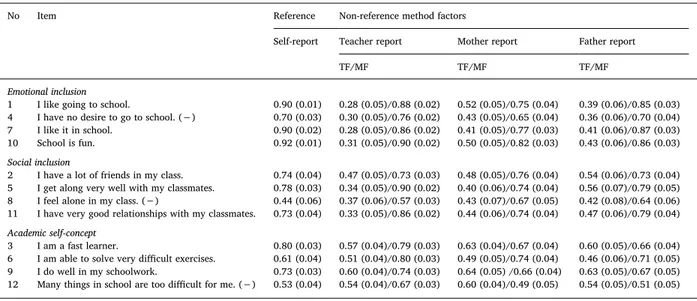
Students' inclusion at school was assessed using the German version of the PIQ (Venetz et al., 2015). The PIQ is composed of the three scales: emotional inclusion, social inclusion, and academic self-concept. Each subscale consists of four Likert-type items (see Table 3for the wording of all 12 items). Answers are provided on a 4-point scale: 0 = not at all true, 1 = rather not true, 2 = somewhat
true, and 3 = certainly true. The PIQ has three versions, including a version for students, a version for the student's teachers, and a
version for parents/primary caregivers. The participants were asked to fill out the respective version of the questionnaire.
2.2.1. PIQ student version (PIQ-S)
With the PIQ-S, students were asked “How do you feel about school?” An item example for emotional inclusion is “I like going to 4
school”, for social inclusion “I have very good relationships with my classmates”, and for academic self-concept “I do well in my schoolwork” (for the wording of all 12 items, seeTable 3). As previously indicated, the PIQ-S is reported to have good internal consistency and valid regarding factor structure and content (Venetz et al., 2014). In addition, measurement equivalence on scale and item level for relevant subgroups has been demonstrated (Knickenberg et al., 2019;Zurbriggen et al., 2019).
2.2.2. PIQ teacher version (PIQ-T)
With the PIQ-T, teachers were asked to rate how a student feels about school (e.g. “How does he/she feel about school?”). The items of the PIQ-T were slightly modified in terms of wording as compared to the student version (e.g., item #1, PIQ-S: “I like going to school,” PIQ-T: “He/she likes going to school”). As mentioned previously, high internal consistency of the three subscales of the PIQ-T has been reported (Venetz et al., 2019).
2.2.3. PIQ parent version (PIQ-P)
Similar to the teacher's version, the PIQ-P requires mothers and fathers (or primary caregivers) to separately rate how their son or daughter feels about school. The factorial structure and the internal consistency of the PIQ-P have not yet been tested. Moreover, no studies have investigated the convergent validity of the three PIQ versions.
2.3. Procedure
The study was approved by the Styrian Regional School Authority. Data were collected at the beginning of fourth grade (last year of primary school). Students in Austria enter primary school at the age of six years and after four years of primary school they transfer to different school tracks in secondary schools. The data collection took place from October–November 2016 (Austrian school years start at the beginning of September). Fourth grade was selected as this was the grade in primary school with the oldest children; consequently, teachers and students already knew each other well. Moreover, as the study was longitudinal and we wanted to investigate changes over six months, we decided to collect data early in the school year (but still several weeks after school started so that teachers and students had already spent several weeks together in class). Only students whose parents signed the informed consent form participated in the paper-and-pencil survey. In addition, class teachers were asked to complete a questionnaire about every student taking part in the study. Student data were collected by a trained team consisting of four researchers. The research team ensured that all students were able to understand the questions and provided further help (e.g., reading the questions aloud, ex-plaining specific terms if needed). Furthermore, the questionnaire was sent home to both parents to complete. For privacy reasons the questionnaire was put in an envelope. A few days later the teacher collected the completed questionnaires, which were brought back to school by students, and the research team collected them. No participant received compensation for participation.
2.4. Analysis
Analyses were performed in Mplus Version 8.0 (Muthén & Muthén, 1998–2017). Parameters were estimated with the robust weighted least squares mean- and variance-adjusted WLSMV estimator (see recommendations ofNussbeck, Eid, & Lischetzke, 2006; Rhemtulla, Brosseau-Liard, & Savalei, 2012). The WLSMV is a limited information maximum likelihood estimator, and the default estimator in Mplus when analyzing categorical data.
First, a confirmatory factor analysis (CFA) with categorical data was applied for all three PIQ versions to assess the dimensional structure. To account for the clustered data structure of student and teacher ratings, we used the complex sample option (i.e., the standard errors were adjusted according to the clustered data structure). The intraclass correlation coefficients for the 12 PIQ items from the student reports ranged from 0.01 to 0.08 and from the teacher ratings from 0.06 to 0.34. Mother and father reports were each treated using a separate model. Reverse coding was used for the negatively formulated items (i.e., items 4, 8, and 12).
To evaluate the reliability of the scales, McDonald's omega (ω) was calculated in the CFA framework. In relation to other indices of internal consistency, ω has shown to provide a more accurate approximation of internal consistency (e.g.Dunn, Baguley, & Brunsden, 2014). In general, reliability coefficients of 0.80 or greater indicate good internal consistency, whereas values around 0.70 are considered as adequate (Kline, 2015).
Second, a MTMM model in a CFA framework was fit to assess the degree of agreement between the four informants. In this simple CFA-MTMM model, there were separate latent factors of all three traits (emotional inclusion, social inclusion, and academic self-concept) for each type of rater or method (i.e., student, teacher, mother, and father reports;Fig. 1A). As already indicated, in a CFA-MTMM, traits cannot be separated from methods.
Third, we contrasted the students' self-reports against the teacher, mother, and father reports by means of a multiple-indicator CT-C(M–1) model (Eid, 2000;Eid et al., 2003) to assess the true convergent validity between the different raters or methods. In this study, we selected self-reports as the reference method because it represents the internal and thus crucial perspective of students' inclusion at school, which structurally differs from external perspectives (Crayen, Geiser, Scheithauer, & Eid, 2011). The other three perspectives represent non-reference methods, which are contrasted against the self-reports (Fig. 1B). Based on the results of the multiple-indicator CT-C(M–1) model, we estimated variance coefficients (i.e. percentages of the variance components) of the con-sistency, the method specificity, and the reliability of the scales. The reliability coefficient represents the part of variance that is not due to measurement error. The variance coefficients for the aggregated multiple-indicator CT-C(M-1) model were calculated using formulas provided byEid et al. (2003; Appendix B, Table B).
(caption on next page) 6
the CT-C(M-1) model across gender and students with SEN versus students without SEN. Basically, the MIMIC approach corresponds to a CFA with covariates. The MIMIC approach was favored over a multiple group CFA approach because it is much more parsi-monious (Marsh, Morin, Parker, & Kaur, 2014). In our MIMIC analyses, the categorical covariates of gender (male vs. female) and SEN (without SEN vs. with SEN) were added separately to the CT-C(M-1) model. More specifically, the trait factors and trait-specific method factors (Fig. 1B) were regressed on gender (MIMIC model A) or SEN (MIMIC model B), with all paths between the covariates (gender, SEN) and the indicators constrained to zero.
To assess the fit of the models, we used the chi-square test and sample size independent goodness-of-fit indices, including the comparative fit index (CFI), the Tucker–Lewis index (TLI), the root mean square error of approximation (RMSEA), and the weighted root mean square residual (WRMR). When using the complex design option for the MIMIC analyses, the Standardized Root Mean Square Residual (SRMR) is reported in Mplus (instead of the WRMR). The SRMR and WRMR are both residual-based fit indices and behave most similarly (DiStefano, Liu, Jiang, & Shi, 2018). TLI and CFI values greater than 0.95 indicate a good fit to the data. RMSEA values less than 0.06 reflect a close fit to the data (Hu & Bentler, 1999;Marsh, Hau, & Wen, 2004). WRMR values below 0.90 represent good fit, and values up to 1.0 are still acceptable (DiStefano et al., 2018). For the SRMR, values below 0.08 generally are recommended (Hu & Bentler, 1999).
3. Results
3.1. Factor structure and reliability of the PIQ
As preliminary analyses, a three-factor CFA model was estimated separately for all four sources of information: student, teacher, mother, and father reports. The fit statistics indicated that all four models generally fitt the data well (Table 1), supporting the expected three-factor structure for all four versions. An exception was the significant chi-square test, which is known to be very sensitive to sample size. As the PIQ-P had not been evaluated yet, the model for the mother (PIQ-M) and father reports (PIQ-F) were of particular interest. Both models fitted the data well, PIQ-M (Model 3): χ2
WLSMV(51, N = 721) = 139.37, p < .001; CFI = 0.989, TLI = 0.986, RMSEA = 0.061 90% CI [0.049, 0.073], WRMR = 0.869; PIQ-F (Model 4): χ2
WLSMV(51, N = 721) = 104.32, p < .001; CFI = 995, TLI = 0.993, RMSEA = 0.053 90% CI [0.038, 0.067], WRMR = 0.757. Furthermore, the standardized factor loadings were all substantial and significant.
The reliabilities of the scales were acceptable to high (Table 2). The McDonalds ω for the three scales of the PIQ-T was higher than for the PIQ-S (e.g., social inclusion: 0.92 vs. 0.78). For both the PIQ-M and the PIQ-F, the ω coefficients were above 0.90 (0.91 ≤ ω ≤ 0.95), indicating very good internal consistency of the three scales.
3.2. Correlations in the CFA MTMM model
The simple CFA MTMM model showed a good fit to the data, χ2
WLSMV(1014, N = 721) = 1411.91, p < .001; CFI = 0.990, TLI = 0.989, RMSEA = 0.023 90% CI [0.020, 0.026], WRMR = 0.844 (Table 1, Model 5).Table 2also reports the correlations in the CFA MTMM model. The heterotrait-monomethod correlations (i.e., intercorrelation between the three PIQ subscales for each method) were lower for self-reports than for external raters. All monotrait-heteromethod correlations (i.e., factor correlations be-tween different raters) were significant. In general, the correlations for academic self-concept were higher than for emotional or social inclusion. However, the monotrait-heteromethod correlation coefficients varied considerably. There was a tendency that the
Fig. 1. (A) Multitrait-multimethod (MTMM) model, (B) correlated trait-correlated method minus one (CT-C[M–1]) model. EMO = emotional
inclusion, SOC = social inclusion, ASC = academic self-concept.S= student self-report,T= teacher report,M= mother report,F= father report. MTemo-Femo, MTsoc-Fsoc, MTasc-Fasc= trait-specific method factors.
Table 1
Summary of model fit indices.
Model χ2
wlsmv df p CFI TLI RMSEA [90% CI] WRMR SRMR
CFA models (1) PIQ-Sa 104.40 51 < .001 0.990 0.987 0.038 [0.028, 0.049] N/A 0.039 (2) PIQ-Ta 115.93 51 < .001 0.996 0.995 0.046 [0.035, 0.058] N/A 0.032 (3) PIQ-M 139.37 51 < .001 0.989 0.986 0.061 [0.049, 0.073] 0.869 N/A (4) PIQ-F 104.32 51 < .001 0.995 0.993 0.053 [0.038, 0.067] 0.757 N/A (5) CFA MTMM 1411.91 1014 < .001 0.990 0.989 0.023 [0.020, 0.026] 0.844 N/A (6) CT-C(M-1) 1372.93 987 < .001 0.991 0.989 0.023 [0.020, 0.026] 0.871 N/A
(7) MIMIC Model A 1399.52 987 < .001 0.991 0.989 0.023 [0.020, 0.025] N/A 0.046
(8) MIMIC Model B 1404.74 987 < .001 0.989 0.988 0.023 [0.020, 0.026] N/A 0.046
Note. S = self-report; T = teacher report; M = mother report; F = father report. CFI = comparative fit index; TLI = Tucker–Lewis index; RMSEA = root mean square error of approximation; 90% CI = 90% confidence interval; SRMR = Standardized Root Mean Square Residual; WRMR = weighted root mean square residual; N/A = not available.
Table 2 Reliabilities (McDonald ω) of the latent PIQ factors and correlations in the CFA MTMM model. R ep ort St ud en ts ' s elf-r ep ort T ea ch er re po rt M oth er re po rt F at he r re po rt EM O SOC A SC E M O SOC A SC EM O SOC A SC E M O SOC A SC St ud en t EM O (0 .9 2) S O C 0. 43* ** (0 .7 8) A S C 0. 39* ** 0. 37* ** (0 .7 7) T eac he r EM O 0. 32* ** 0. 30* ** 0. 33* ** (0.9 5) S O C 0. 17* * 0. 44* ** 0. 26* ** 0. 66* ** (0.9 2) A S C 0.0 8 0.1 2* 0. 59* ** 0. 44* ** 0. 42* ** (0.9 7) Moth er EM O 0. 53* ** 0. 37* ** 0. 32* ** 0. 41* ** 0. 34* ** 0. 26* ** (0.9 3) S O C 0. 16* 0. 51* ** 0. 14* 0. 33* ** 0. 56* ** 0. 28* ** 0. 66* ** (0.9 1) A S C 0. 19* ** 0. 12 0. 69* ** 0. 32* ** 0. 31* ** 0. 75* ** 0. 47* ** 0. 42* ** (0.9 3) Fa th er EM O 0. 43* ** 0. 24* * 0. 24* * 0. 37* ** 0. 27* ** 0. 20* * 0. 78* ** 0. 53* ** 0. 36* ** (0.9 5) S O C 0. 26* ** 0. 55* ** 0. 16* 0. 36* ** 0. 45* ** 0. 21* * 0. 55* ** 0. 82* ** 0. 28 ** * 0. 68* ** (0.9 4) A S C 0. 17* * 0. 20* * 0. 66* ** 0. 31* ** 0. 28* ** 0. 69* ** 0. 41* ** 0. 37* ** 0. 96* ** 0. 47* ** 0. 42* * (0.9 1) Note .EMO = emotional inclusion, SOC = social inclusion, ASC = academic self-concept. Main diagonal (values in parentheses): reliabilities (McDonald ω). Monotrait-heterotrait correlations are marked in grey. ⁎p < .05, ⁎⁎p < .01 ⁎⁎⁎ p < .001. 8
agreement between self-report and other reports was somewhat lower than the agreement between external perspectives. For in-stance, there was a small to moderate agreement between self-reports and teacher ratings, whereas teacher and parent ratings showed consistently moderate agreement. By far, the highest agreement was observed between the mother and father reports.
3.3. Convergent validity in the CT-C(M-1) model
The fit statistics indicated that the CT-C(M-1) model fit the data well, χ2
WLSMV(987, N = 721) = 1372.93, p < .001; CFI = 0.991, TLI = 0.989, RMSEA = 0.023 90% CI [0.020, 0.026], WRMR = 0.871 (Table 1, Model 6). The standardized factor loadings of trait factors and trait-specific method factors are presented inTable 3. The items of the reference method (self-report) showed high loadings on the corresponding factor, except for the three negatively worded items (4, 8, 12) with moderate loadings.
The loadings of non-reference method factors on the reference factor indicators represent the degree of convergent validity of other reports, relative to the self-report. Those standardized trait factor loadings were all significant and substantial, ranging from 0.28 (item 1 and 7, TF teacher report) to 0.64 (item 9, TF father report). In general, the convergent validities between self-reports and teacher ratings were somewhat lower (0.28 ≤ λ ≤ 0.60) than between self-report and parent ratings (0.40 ≤ λ ≤ 0.64). Moreover, the convergent validities for the academic self-concept tended to be higher than for emotional inclusion and for social inclusion. The standardized method factor loadings were moderate to high (0.49 ≤ λ ≤ 0.90). Those method factor loadings were all higher than the reference factor loadings. This indicated a rather high level of method specificity for the external raters.
As previously indicated, the correlations in the simple CFA MTMM model may reflect a shared perspective or bias instead of true convergent validity (Geiser et al., 2016). To examine this, we compared the correlations between the external rater factors (teacher, mother, father reports) presented inTable 2with the correlations of the corresponding trait-specific method factors of the CT-C(M-1) model reported inTable 4. Relative to the simple CFA MTMM model, the correlations between teacher and parent reports were substantially reduced in the CT-C(M-1) model for all three constructs. For instance, the correlations between teacher and father reports for social inclusion decreased from 0.45 to 0.27, and the correlations between teacher and mother reports decreased from 0.75 to 0.58. This indicates that the correlations partly reflect the true convergent validity. The parent correlations were also somewhat reduced but remained high. For emotional inclusion, for instance, the correlation between mother and father reports did not significantly change (0.78 vs. 0.75), indicating that parent correlations reflected a shared perspective or bias, rather than shared convergent validity.
3.4. Variance components in the aggregated CT-C(M-1) model
Table 5shows the estimated variance components for the observed and true-score variables of the aggregated CT-C(M-1) model, as well as the reliabilities and the latent correlations computed as a part of this analysis. As for the simple CFA MTMM model, the reliabilities calculated in the CT-C(M-1) model were high, except for the self-report of social inclusion and academic self-concept (both 0.77). The latent correlations were calculated by taking the square root of the consistency coefficient (Eid et al., 2003). The latent correlations correspond to true partial correlations. For instance, the latent correlation of 0.32 for emotional inclusion can be interpreted as the correlation between self-report and teacher ratings, corrected for measurement errors.
Table 3
Standardized factor loadingsaand standard errors (in parentheses) in the CT-C(M-1) model.
No Item Reference Non-reference method factors
Self-report Teacher report Mother report Father report
TF/MF TF/MF TF/MF
Emotional inclusion
1 I like going to school. 0.90 (0.01) 0.28 (0.05)/0.88 (0.02) 0.52 (0.05)/0.75 (0.04) 0.39 (0.06)/0.85 (0.03)
4 I have no desire to go to school. (−) 0.70 (0.03) 0.30 (0.05)/0.76 (0.02) 0.43 (0.05)/0.65 (0.04) 0.36 (0.06)/0.70 (0.04)
7 I like it in school. 0.90 (0.02) 0.28 (0.05)/0.86 (0.02) 0.41 (0.05)/0.77 (0.03) 0.41 (0.06)/0.87 (0.03)
10 School is fun. 0.92 (0.01) 0.31 (0.05)/0.90 (0.02) 0.50 (0.05)/0.82 (0.03) 0.43 (0.06)/0.86 (0.03)
Social inclusion
2 I have a lot of friends in my class. 0.74 (0.04) 0.47 (0.05)/0.73 (0.03) 0.48 (0.05)/0.76 (0.04) 0.54 (0.06)/0.73 (0.04)
5 I get along very well with my classmates. 0.78 (0.03) 0.34 (0.05)/0.90 (0.02) 0.40 (0.06)/0.74 (0.04) 0.56 (0.07)/0.79 (0.05)
8 I feel alone in my class. (−) 0.44 (0.06) 0.37 (0.06)/0.57 (0.03) 0.43 (0.07)/0.67 (0.05) 0.42 (0.08)/0.64 (0.06)
11 I have very good relationships with my classmates. 0.73 (0.04) 0.33 (0.05)/0.86 (0.02) 0.44 (0.06)/0.74 (0.04) 0.47 (0.06)/0.79 (0.04)
Academic self-concept
3 I am a fast learner. 0.80 (0.03) 0.57 (0.04)/0.79 (0.03) 0.63 (0.04)/0.67 (0.04) 0.60 (0.05)/0.66 (0.04)
6 I am able to solve very difficult exercises. 0.61 (0.04) 0.51 (0.04)/0.80 (0.03) 0.49 (0.05)/0.74 (0.04) 0.46 (0.06)/0.71 (0.05)
9 I do well in my schoolwork. 0.73 (0.03) 0.60 (0.04)/0.74 (0.03) 0.64 (0.05) /0.66 (0.04) 0.63 (0.05)/0.67 (0.05)
12 Many things in school are too difficult for me. (−) 0.53 (0.04) 0.54 (0.04)/0.67 (0.03) 0.60 (0.04)/0.49 (0.05) 0.54 (0.05)/0.51 (0.05)
Note. (−) = negatively worded items; TF = trait factors; MF = trait-specific method factors. a Reported are pattern coefficients. Self-report as the reference method.
As expected from the factor loadings (Table 3), the estimated variance components of the aggregated CT-C(M-1) model revealed relatively low consistency and rather high method-specificity for all raters. Furthermore, the consistency coefficients (of the true-score variables) were lower for teacher ratings than for parent ratings. In particular, the consistency coefficient between the self-report and teacher ratings of emotional inclusion was very low, whereas the consistency coefficient for parent self-reports were somewhat higher. That is, only 11% of the variance in teacher ratings was shared by the students, whereas mothers shared 28% and fathers shared 19% with a child's self-report. A similar picture emerged for social inclusion: The consistency between self-reports and teacher reports (20%) was lower than the consistency of parent reports, in turn, with a somewhat higher percentage of shared variance between father ratings and self-reports (32%) than between mother ratings and self-reports (27%). The highest percentage of shared variance was for academic self-concept. For all three types of raters, the consistency with self-reports was relatively high (teacher: 35%, mother: 46%, father: 43%).
However, the method specificity was larger than the consistency across all raters and constructs. That is, the proportion of variance of teacher or parent reports not shared by the students' self-reports was always higher than their consistency.
Table 4
Correlations of the trait and trait-specific method factors in the CT-C(M-1) model.
Trait factors Trait-specific method factors
Self-report Teacher report Mother report Father report
EMO SOC ASC EMO SOC ASC EMO SOC ASC EMO SOC ASC
EMO-S SOC-S 0.43⁎⁎⁎ ASC-S 0.40⁎⁎⁎ 0.38⁎⁎⁎ EMO-T – 0.18⁎⁎⁎ 0.22⁎⁎⁎ SOC-T −0.02 – 0.11⁎ 0.62⁎⁎⁎ ASC-T −0.19⁎⁎⁎ −0.11⁎ – 0.38⁎⁎⁎ 0.41⁎⁎⁎ EMO-M – 0.18⁎ 0.14⁎ 0.30⁎⁎⁎ 0.23⁎⁎ 0.22⁎⁎ SOC-M −0.08 – −0.05 0.24⁎⁎ 0.45⁎⁎⁎ 0.34⁎⁎⁎ 0.69⁎⁎⁎ ASC-M −0.10 −0.18⁎ – 0.16⁎ 0.28⁎⁎⁎ 0.58⁎⁎⁎ 0.46⁎⁎⁎ 0.60⁎⁎⁎ EMO-F – 0.08 0.14⁎ 0.28⁎⁎⁎ 0.20⁎ 0.13 0.73⁎⁎⁎ 0.55⁎⁎⁎ 0.29⁎⁎⁎ SOC-F 0.02 – −0.06 0.23⁎⁎ 0.27⁎⁎ 0.24⁎⁎ 0.47⁎⁎⁎ 0.75⁎⁎⁎ 0.41⁎⁎⁎ 0.71⁎⁎⁎ ASC-F −0.12 −0.06 – 0.17 0.17 0.49⁎⁎⁎ 0.39⁎⁎⁎ 0.44⁎⁎⁎ 0.92⁎⁎⁎ 0.46⁎⁎⁎ 0.54⁎⁎⁎
Note. S = self-report; T = teacher report; M = mother report; F = father report. EMO = emotional inclusion, SOC = social inclusion, ASC = academic self-concept. All parameters set to 0 by definition are represented by a dash.
⁎ p < .05. ⁎⁎ p < .01. ⁎⁎⁎ p < .001.
Table 5
Estimated variance components in the aggregated CT-C(M–1) model.
Rating Observed variables True-score variables
Reliability Consistency Method specificity Consistency Method specificity Latent correlationa
Emotional inclusion Self 0.92 0.92 1.00 Teacher 0.95 0.10 0.85 0.11 0.89 0.32 Mother 0.93 0.26 0.67 0.28 0.72 0.53 Father 0.95 0.18 0.77 0.19 0.81 0.43 Social inclusion Self 0.77 0.77 1.00 Teacher 0.92 0.18 0.74 0.20 0.80 0.44 Mother 0.91 0.24 0.67 0.27 0.73 0.53 Father 0.94 0.30 0.64 0.32 0.68 0.56 Academic self-concept Self 0.77 0.77 1.00 Teacher 0.97 0.34 0.63 0.35 0.65 0.59 Mother 0.93 0.43 0.50 0.46 0.54 0.68 Father 0.91 0.39 0.52 0.43 0.57 0.66 Note.
a Latent correlation with the reference method ( consistency ).
Table 6 Standardized regression coefficients and standard errors (in parentheses) on trait and method factors in the MIMIC models. Trait factors Trait-specific method factors Self-report (S) Teacher report (T) EMO-S SOC-S ASC-S EMO-T SOC-T ASC-T Gender 0.262 ⁎⁎⁎ (0.039) 0.078 (0.045) 0.029 (0.044) 0.235 ⁎⁎⁎ (0.047) 0.209 ⁎⁎⁎ (0.047) −0.011 (0.051) SEN −0.023 (0.040) −0.100 ⁎⁎ (0.041) −0.169 ⁎⁎⁎ (0.035) −0.217 ⁎⁎⁎ (0.043) −0.295 ⁎⁎⁎ (0.045) −0.425 ⁎⁎⁎ (0.041) Trait-specific method factors Mother report (M) Father report (F) EMO-M SOC-M ASC-M EMO-F SOC-F ASC-F Gender 0.137 ⁎(0.060) 0.137 ⁎(0.062) 0.070 (0.063) 0.044 (0.068) 0.134 (0.070) 0.034 (0.072) SEN −0.063 (0.068) −0.150 ⁎(0.066) −0.370 ⁎⁎⁎ (0.058) −0.085 (0.075) −0.189 ⁎(0.076) −0.425 ⁎⁎⁎ (0.068) Note .EMO = emotional inclusion, SOC = social inclusion, ASC = academic self-concept. SEN = special educational needs. Coding: gender 0 = male, 1 = female; SEN 0 = without SEN, 1 = with SEN. ⁎p < .05. ⁎⁎ p < .01. ⁎⁎⁎ p < .001.
3.5. MIMIC analyses
Both MIMIC models provided a good fit to the data (Table 1, Models 7 & 8). For the CT-C(M-1) model with gender as a covariate (MIMIC model A), the fit values were χ2
WLSMV(987, N = 721) = 1399.52, p < .001; CFI = 0.991, TLI = 0.989, RMSEA = 0.023 90% CI [0.020, 0.025], SRMR = 0.046; for the model with SEN as a covariate (MIMIC model B), the fit values were χ2
WLSMV(987,
N = 721) = 1404.74, p < .001; CFI = 0.989, TLI = 0.988, RMSEA = 0.023 90% CI [0.020, 0.026], SRMR = 0.046.
The standardized regression coefficients of the two covariates on trait and method factors are presented inTable 6. The stan-dardized estimates can be interpreted as effects sizes akin to Cohen's d (Brown, 2015). Gender had a significant, but small, positive effect on self-reports of emotional inclusion (0.262, p < .001) as well as on method effects of teacher reports (0.235, p < .001) and of mother reports (0.137, p = .022). Thus, girls scored higher for emotional inclusion than boys. Teachers and mothers reported the emotional inclusion of girls as being even higher. A similar picture emerged for social inclusion, except for self-reports. Both the method effect of teacher and mother reports could be predicted by gender, indicating that social inclusion for girls was rated higher than for boys by teachers (0.209, p < .001) and mothers (0.137, p = .027).
SEN showed a small negative effect on emotional inclusion for only the method effects of teacher reports (−0.217, p < .001). For social inclusion and academic self-concept, negative effects of SEN were shown across all raters. Regarding self-reports, students with SEN scored lower on social inclusion (−0.100, p = .014) and on academic self-concept (−0.169, p < .001) than students without SEN. For all three external raters, it was possible to predict method effects on social inclusion and academic self-concept by SEN. Small negative effects showed for social inclusion, whereas for academic self-concept, medium negative effects were reported. Teachers rated social inclusion (−0.295, p < .001) and academic self-concept (−0.425, p < .001) of students with SEN system-atically lower than for students without SEN. The same applied to parent reports. However, the method effects were somewhat less pronounced.
4. Discussion
This multi-informant study investigated the consistency of teacher, mother, and father ratings with primary students' self-reports of their emotional inclusion, social inclusion, and academic self-concept, using the student, teacher, and parent version of the PIQ. First, we evaluated the factorial structure as well as the internal consistency of the parent version of the PIQ as there previously was no evidence that the instrument was suited for parent reports. Second, we provided evidence about the convergent validity of the PIQ by performing two different CFA MTMM analyses: a simple CFA MTMM model and a CT-C(M-1) model. Third, we examined if the student's gender and the SEN status could predict rater bias of parents and teacher reports (i.e., method effects), by means of a MIMIC approach.
4.1. Evidence of the psychometric quality of the PIQ-P
The results of this study indicated evidence of the internal consistency and the three-dimensional factor structure of the PIQ-P. The three-factor structure of the PIQ-P fit the parent data well, as has been previously reported for the student (Venetz et al., 2014; Zurbriggen et al., 2019) and teacher versions (Venetz et al., 2019). This was true for the data both from mothers and fathers. In addition, the items loaded on the expected factors. The reliability coefficients were high and comparable with the results for the PIQ-S (Zurbriggen et al., 2019) and the PIQ-T (Venetz et al., 2019).
4.2. Consistency of teacher and parent reports with students' self-reports
Few studies have used CFA MTMM models to identify multi-informant correspondences. In the simple CFA MTMM model, the correlations between the three PIQ subscales were lower for student self-reports as compared to the correlations for other reports. This leads to the conclusion that students differentiate more between emotional inclusion, social inclusion, and academic self-concept, whereas mothers, fathers, and teachers differ less between these dimensions of students' inclusion at school. Moreover, the correlations between both parent ratings were highest as compared to the correlations between other raters. Students' self-reports correlated lower with teacher, mother, and father ratings as compared to the correlations between mother and father ratings. This is in line withGresham et al. (2018), confirming that the correspondence of similar informants (parents-parents) is higher as compared to the agreement of less similar informants (parent-teacher).
The results of the simple CFA MTMM model indicated that the agreement between self-report and other reports was somewhat lower than the agreement between external perspectives. A simple CFA MTMM model is not appropriate for assessing the true convergent validity (i.e., error-free degree of agreement) between different raters and to detect true method effects (i.e., rater bias); therefore, we contrasted the students' self-reports against teacher, mother, and father reports by means of a CT-C(M–1) model. Based on these results, we estimated variance components to show the proportions of method-specificity (i.e. rater bias) and consistency of other reports with self-reports. The findings revealed relatively low consistency and rather high method-specificity or bias for all raters. Moreover, the results confirmed that the convergent validity was higher between students' self-reports and parent ratings than it was between self-reports and teacher ratings. Relative to the simple CFA MTMM model, the correlations between teacher and parent reports were substantially reduced in the CT-C(M-1) model for all three constructs. The parent correlations were also somewhat reduced but remained high, indicating that parent correlations reflected a shared perspective, rather than shared con-vergent validity. This means that the parents shared the same bias when rating their child's inclusion at school, but both did not
converge with the child's self-report. The high method-specificity can be explained through a bias related to informant discrepancies. Students might not always share their perception of emotional well-being at school, their social inclusion in class, or their perception of their academic competencies with their parents and teachers. As children might show different behaviors in varying contexts (e.g., different situation, interactions with different persons;de Los Reyes, 2011), the discrepancies between different informants could underpin this assumption. Differences in children's home and school environment and relations might cause this mismatch.
However, the consistency between self-reports and other reports was generally higher for academic self-concept than for emo-tional or social inclusion. This might be explained by the fact that the students' academic self-concept is strongly related to the students' academic achievement (e.g.,Huang, 2011). Achievement is relatively easy to observe by teachers and even by parents. For emotional and social inclusion, a less strong association can be assumed, because they are harder to observe. Furthermore, the results of the CT-C(M–1) model signaled that the negatively worded items in the PIQ-S showed lower factor loadings as compared to the positively formulated items. The effects of the revised formulated items on the factorial structure of scales have already been de-monstrated in several other studies (e.g.,Zhang, Noor, & Savalei, 2016).
4.3. Explaining students' self-reports and bias of teacher and parent reports
The results of the MIMIC analysis provide more insights into possible predictors for discrepancies in interrater agreement or rater bias. For gender as well as for SEN status, some empirical evidence was found indicating that they affect teacher and parent ratings as well as students' self-reports of their inclusion at school.
Gender had small positive effects on teacher and mother ratings of emotional and social inclusion but not for the father reports and on academic self-concept. This indicates that teachers and mothers somehow overestimate girls' emotional well-being at school and their social inclusion in class as compared to boys. For fathers, no gender-based biases in the ratings. As most of the teachers in this sample were females, this method effect might be explained by a same-sex bias. However, more research with a bigger sample size of teachers is necessary to investigate possible same-sex bias. As for self-reports, girls rated only their emotional inclusion higher than boys.
Consistent with previous studies that compared students with and without SEN, no differences were found in students' self-perceived emotional inclusion (Zurbriggen et al., 2019), but students with SEN reported a lower level of social inclusion (Schwab, 2018) and academic self-concept (Bear et al., 2002). For all three external raters, it was possible to predict method effects on social inclusion and academic self-concept by SEN status. This means that teachers and parents systematically rated social inclusion and academic self-concept even lower than students with SEN themselves. For emotional inclusion, such an effect was found only for teachers. Thus, our results underpin that teacher ratings of students' emotional well-being, social inclusion, and academic self-concept were negatively biased for students with SEN. With regard to social inclusion, it can be asked whether students with SEN have different comprehension of ‘being included’ and whether they somewhat rate their social inclusion differently. Within the PIQ, measurement invariance between students with and without SEN has already been demonstrated in several studies (deVries et al., 2018;Venetz et al., 2014;Zurbriggen et al., 2019). Therefore, ratings of others could be biased due to stigmatization of students with SEN. Previous studies have shown that students with SEN reported fewer peer problems as compared to their parents' ratings (Schwab et al., 2016). For academic self-concept, it might be the case that parents, as well as teachers, rate the students' self-concept more in line with their achievement.
4.4. Limitations
Certain limitations must be considered as they might affect the results of the current study. First, the operationalization of emotional wellbeing, social inclusion, and academic self-concept as it was done in the PIQ is limited as only a few nuances of these concepts can be included in such a short questionnaire. To gain a more detailed picture of students' school inclusion additional instruments and methods (e.g., observations, interviews) should be applied. However, in everyday school life there are often limited possibilities for in-depth investigations of all students. Therefore, the PIQ should rather be seen as a screening instrument for further examinations.
In addition, the fact that one teacher rated all students of his or her class on the PIQ and the parents rated with a 1:1 corre-spondence (one parent rated only one student) might have influenced the quality of the data. Whereas parents might have taken much more time to rate their child, the classroom teachers needed to do this for several students. However, to account for the dependency of the teacher ratings, we applied a designed-based statistical approach. Moreover, the results of the present study only apply to elementary school students and not middle or high school students.
Furthermore, the findings of the study are not comparable to schools with a subject-teacher system. In Austrian primary schools, there is only one teacher per class who teaches nearly all subjects. Therefore, the teachers have plenty of time to observe the students and to get to know the students in-depth, whereas subject teachers often spend only 2 or 3 h weekly with the same students, and, overall, have more students to teach. This might imply a higher student-teacher overlap for class teachers as compared to subject teachers. Therefore, future studies might involve older students and control for the time a teacher spent with the students. Regarding the relatively high overlap of child-mother agreement and child-father agreement, it has to be mentioned that we could not control for the parents' exchange of opinions about their children's school well-being, social inclusion, and academic self-concept during the time of the study. The study did not collect information about the degree to which parents followed the guidelines to not discuss their answers with each other.
voluntary for schools, parents, and their children. Therefore, students with highly negative school experiences might be under-represented in the sample; the same applies to specific schools (e.g., schools that struggle with their school climate). Moreover, as parents' voluntarily filled out the questionnaires about their children, another limitation might be that those parents, who are more interested in their child's life, were more likely to participate in the study, which might again lead to a higher congruence between parents' and children as in a representative sample.
Finally, we focused on only one aspect of validity, namely convergent validity of students' self-report, teacher ratings, and parent ratings. The low convergent validities underscore the assessment from different perspectives. However, an extensive evaluation of the interpretations and uses of the test scores within a validity argument framework could add meaningful further implications (Kane, 2013, 2020).
4.5. Conclusion and practical implementations
Besides academic achievement, students' emotional well-being at school, their social inclusion in class, and their academic self-concept are considered to be major outcomes of (inclusive) schooling. As these variables also influence students' academic and socio-emotional development, these aspects need to be addressed within the school context in the future. The present study provided evidence for utilizing a screening instrument that can be used to assess these three dimensions from the students', parents', or teachers' viewpoints. As mentioned earlier, the success of an intervention might be connected with differences in ratings, and stu-dents' self-reports might give us a more positive view of the situation. Therefore, a mismatch or inconsistency across informants should be investigated and explanations should be identified. An example might be that a student is socially included in his or her spare time but not necessarily in class. Therefore, parents are not aware that they might help their child to be more connected with peers in class. For a prevention-focused approach, early identification is meaningful. Consequently, if the instrument is used by multiple informants, students, parents, and teachers could discuss the outcomes and explore why a student feels unhappy at school and what each of the informants can do to improve the situation. If a teacher is not aware of the fact that a student is feeling a low level of emotional inclusion, he or she may be limited in providing support to the student.
The PIQ is easy to administer and the present study indicated strong psychometric properties in its three versions (PIQ-S, PIQ-T, and PIQ-P). Since the different raters in this study (students, teachers, mothers, and fathers) indicated somewhat different results, we suggest that future research include multiple informants for assessing these variables in order to get an in-depth picture of student's inclusion at school. More research is required to understand the reasons behind interrater discrepancies or rater bias. This would extend our knowledge about student's behaviors and information sharing in different environments (e.g., at home or at school). Further, we suggest developing normative information in terms of the PIQ scores, which will assist in identifying situations where teachers and parents should pay closer attention to fostering feelings of inclusion and positive self-concepts.
Acknowledgements
There is no financial, organizational or personal interest or belief that could affect the objectivity or have an inappropriate influence on the work. This work was supported by the Styrian government (grant number: ABT08-247083/2015-34).
References
Achenbach, T. M. (2018). Multi-informant and multicultural advances in evidence-based assessment of students' behavioral/emotional/social difficulties. European
Journal of Psychological Assessment, 34, 127–140.https://doi.org/10.1027/1015-5759/a000448.
Achenbach, T. M., McConaughy, S. H., & Howell, C. T. (1987). Child/adolescent behavioral and emotional problems: Implications of cross-informant correlations for situational specificity. Psychological Bulletin, 101, 213–232.
Adams, D., Harris, A., & Jones, M. S. (2017). Exploring teachers' and parents' perceptions on social inclusion practices in Malaysia. Pertanika Journal of Social Science and Humanities, 25(4), 1721–1738.
Armstrong, D., Armstrong, A. C., & Spandagou, I. (2011). Inclusion: By choice or by chance? International Journal of Inclusive Education, 15(1), 29–39.https://doi.org/
10.1080/13603116.2010.496192.
Bear, G. G., Minke, K. M., & Manning, M. A. (2002). Self-concept of students with learning disabilities: A meta-analysis. School Psychology Review, 31(3), 405–427. Bossaert, G., Colpin, H., Pijl, S. J., & Petry, K. (2013). Truly included? A literature study focusing on the social dimension of inclusion in education. International Journal
of Inclusive Education, 17(1), 60–79.https://doi.org/10.1080/13603116.2011.580464.
Brown, T. A. (2015). Confirmatory factor analysis for applied research (2nd ed.). New York, NY: The Guilford Press.
Cambra, C., & Silvestre, N. (2003). Students with special educational needs in the inclusive classroom: Social integration and self-concept. European Journal of Special
Needs Education, 18(2), 197–208.https://doi.org/10.1080/0885625032000078989.
Chapman, J. W. (1988). Learning disabled children's self-concepts. Review of Educational Research, 58(3), 347–371.
Crayen, C., Geiser, C., Scheithauer, H., & Eid, M. (2011). Evaluating interventions with multimethod data: A structural equation modeling approach. Structural Equation
Modeling: A Multidisciplinary Journal, 18(4), 497–524.https://doi.org/10.1080/10705511.2011.607068.
De Los Reyes, A. (2011). Introduction to the special section: More than measurement error: Discovering meaning behind informant discrepancies in clinical
assess-ments of children and adolescents. Journal of Clinical Child & Adolescent Psychology, 40(1), 1–9.https://doi.org/10.1080/15374416.2011.533405.
De Los Reyes, A., Augenstein, T. M., Wang, M., Thomas, S. A., Drabick, D., Burgers, D. E., & Rabinowitz, J. (2015). The validity of the multi-informant approach to assessing child and adolescent mental health. Psychological Bulletin, 141, 858–900.
De Monchy, M., Pijl, S. J., & Zandberg, T. J. (2004). Discrepancies in judging social inclusion and bullying of pupils with behavior problems. European Journal of Special
Needs Education, 19(3), 317–330.https://doi.org/10.1080/0885625042000262488.
DeVries, J. M., Voß, S., & Gebhardt, M. (2018). Do learners with special education needs really feel included? Evidence from the perception inclusion questionnaire
and strengths and difficulties questionnaire. Research in Developmental Disabilities, 83, 28–36.https://doi.org/10.1016/j.ridd.2018.07.007.
DiStefano, C., Liu, J., Jiang, N., & Shi, D. (2018). Examination of the weighted root mean square residual: Evidence for trustworthiness? Structural Equation Modeling: A
Multidisciplinary Journal, 25(3), 453–466.https://doi.org/10.1080/10705511.2017.1390394.
Dunn, T. J., Baguley, T., & Brunsden, V. (2014). From alpha to omega: A practical solution to the pervasive problem of internal consistency estimation. British Journal 14