HAL Id: hal-00938480
https://hal-enac.archives-ouvertes.fr/hal-00938480
Submitted on 13 May 2014
HAL is a multi-disciplinary open access
archive for the deposit and dissemination of
sci-entific research documents, whether they are
pub-lished or not. The documents may come from
teaching and research institutions in France or
abroad, or from public or private research centers.
L’archive ouverte pluridisciplinaire HAL, est
destinée au dépôt et à la diffusion de documents
scientifiques de niveau recherche, publiés ou non,
émanant des établissements d’enseignement et de
recherche français ou étrangers, des laboratoires
publics ou privés.
A participatory design for the visualization of airspace
configuration forecasts
Nicolas Saporito, Christophe Hurter, David Gianazza, Geraldine Beboux
To cite this version:
Nicolas Saporito, Christophe Hurter, David Gianazza, Geraldine Beboux. A participatory design for
the visualization of airspace configuration forecasts. ICRAT 2010, 4th International Conference on
Research in Air Transportation, Jun 2010, Budapest, Hungary. pp xxxx. �hal-00938480�
A Participatory Design for the Visualization of
Airspace Configuration Forecasts
Nicolas SAPORITO
DSNA/DTI R&D 7, avenue Edouard. Belin
31055 Toulouse France [email protected] Christophe HURTER DSNA/DTI R&D IRIT
7, avenue Edouard. Belin 31055 Toulouse France [email protected] David GIANAZZA DSNA/DTI R&D IRIT
7, avenue Edouard. Belin 31055 Toulouse France
Geraldine BEBOUX
DSNA/DTI R&D 7, avenue Edouard Belin
31055 Toulouse France
Abstract— Currently, airspace-related activities in Air Traffic
Control Centers (ATCC) are dispatched between the Flow Management Position (FMP) operators and the control room manager, and take place in two different time frames. The first activity (FMP) is the planning, 2 days ahead, of airspace usage and anticipated overloads, using coarse-grain and relatively inaccurate workload prediction metrics. The second activity (control room manager) is the day-to-day operation, where workload is re-assessed in real-time and where airspace may be re-configured according to the actual traffic of the day. In previous works, a workload model relying on relevant air traffic complexity metrics was proposed, using a neural network trained on past sector operations. This workload prediction model was combined with tree search algorithms, in order to compute optimal partitions of the airspace in Air Traffic Control (ATC) sectors. This method provides more accurate airspace configuration forecasts than today, thus improving the overall predictability of the Air Traffic Management (ATM)/ATC system. When relying on accurate 4D-trajectory predictions, as expected in the SESAR program, it could contribute towards bridging the current gap between the pre-tactical airspace/flow management and real-time operations. In this paper, we detail the participatory design approach that we used to develop a research prototype displaying the algorithm's results. As there is no such forecasting tool today, the main issue was to create a user interface in the absence of an existing user.
Keywords: User-Centered Design, Human Computer Interaction, Airspace Configuration Forecasts
I. INTRODUCTION
With the global trend towards increasing traffic over the last few decades, research issues in Air Traffic Management (ATM) have become more and more critical in the development of future concepts and systems. However, although research is very active in the ATM field, the implementation of its outputs in the form of real-life software, that can actually be used in an operational context, is a fairly slow process. It has not always met all the great expectations that have, in the past, been placed on its ability to enable the ATM system to handle safely and efficiently an increasing amount of traffic.
As a consequence, it could be assumed that research in ATM is disappointing in terms of results. The stakeholders and institutions funding the ATM R&D activity are certainly tempted to re-organize the research activities into a standard
industrial V-cycle, so as to lead research towards a common goal: the efficient development of the next generation of ATM systems. This ambitious objective is legitimate, and in this context the V-model might be useful to develop high quality industrial software when the technology is mature and the users' needs are well known.
In terms of research however, this approach is clearly counter-productive and costly when addressing ill-posed
problems like: “how could we improve the current ATM
system with a new operational concept?” This is a rather ambiguous question that may have many context-dependent answers. Research is usually much more efficient when addressing open questions which seek non-ambiguous answers. It is even more efficient when several teams can work in parallel on a common well-posed problem, exploring different paths with various methods, in collaboration, and/or in competition, with each other. But this discussion is not within the scope of our paper.
In the standard V-cycle model of development, the users are mainly involved at the beginning (definition of their needs) and at the end of the cycle (validation of the final product). If the initial operational concept proves impractical in real-life, or if the derived software and systems do not ultimately meet their objectives, the whole cycle has to be repeated: a new concept, new research, new software developments, and so on. Furthermore, this development model may not be suitable when validating new ideas and algorithms in a context that may change, depending on research results and on the users' feedback. Rapid iterative development involving the users and the researchers at several intermediate steps is to be preferred in this case, when developing such research prototypes.
In this paper, we used a participatory user-centered method to develop an interface for a new algorithm providing airspace configuration forecasts. This new algorithm combines tree-search methods with a neural network, assessing the air traffic controllers' workload, in order to compute optimal partitions of the airspace in Air Traffic Control (ATC) sectors. The neural network was trained on past sector operations, considering existing ATC sectors that were split, merged, or recombined according to the actual workload. The Graphic Interface presented in this paper is a research prototype that displays the
algorithm’s results. It aims at demonstrating and improving
these algorithms, taking into account the feedback of potential users so as to provide realistic forecasts.
The problem being addressed is well-posed in the sense that an optimal airspace configuration can be computed from a given traffic prediction, and the realism of the resulting configuration can be improved by considering well-defined rules when partitioning the airspace. However, the operational context in which such a forecasting tool could be used is not clearly defined. In the current European system, airspace and workload management activities are dispatched between the Flow Management Position (FMP) operator, who makes coarse-grain and approximate pre-tactical forecasts one or two days ahead, and the control room manager who decides to split, merge, or recombine ATC sectors in real-time, according to the effective workload of the Air Traffic Controllers (ATCOs). Forecasting algorithms able to provide more accurate predictions a few hours ahead could certainly be used somewhere between the current FMP pre-tactical prediction and real time traffic control, but such a tool does not exist today for airspace management purposes.
In other words, there is not yet an operational concept, and
no “final user” to interview when designing the Graphic
interface of our research prototype. The study of user tasks and the realization of an appropriate interface is already a difficult task when the user, his or her role and activities, are clearly identified. In our case, the lack of a final user was an additional difficulty in the design process and we had to ask “potential
users” (operational experts, ATCOs, including a control room
manager) to imagine the operational use of the proposed algorithms. The existence of these issues was the reason for the use of a participatory user-centered design process in which potential users, researchers, and Human Computer Interaction (HCI) experts are involved throughout the design of the Graphic Interface, instead of standard design and development methods, in which the users are mainly involved at the beginning and at the end of the process.
The main content of this paper is organized as follows. Firstly, we describe how the airspace management activities take place in the current operational context, and how they could be envisaged in the future SESAR operational concept. Secondly, we describe briefly the new algorithms forecasting the ATCOs workload and the airspace configuration, focusing on the outputs that may be significant to the final user. Thirdly, we lay out the principles of the participatory user-centered design. Fourthly, we describe the results of the application of this iterative process in terms of helping to solve our problem, and the current version of the resulting Graphic Interface. Finally, the main issues and results are summarized in the concluding section, together with the perspectives of future developments in the context of three SESAR projects.
II. CONTEXT
Currently, the Flow Management Position (FMP) located in the Air Traffic Control Center (ATCC), in collaboration with the Central Flow Management Unit in Brussels (CFMU), organizes traffic management. The traffic management on a given day is sequenced with several steps (Figure 1).
Several months beforehand, at the strategic level, the forecast traffic and sector capacities are analyzed to detect
potential anomalies, and the strategic airspace design and flow orientation schemes are amended.
2 days – 1 day before D-day Stra tegi c Ai rsp ace Desi gn, Tra ffic orien tatio n sch eme s. several months before Pre -tact ical Ai rsp ace and Flo w ma nage me nt. Act ors : FMP , C FMU Tact ical o pera tions . Act ors : FMP , C ontro l ro om ma nage r time Se s a r p ro je c t C u rr e n t a c ti o n s Planning phases Regional Network Management Unit
Tactical phase Complexity management
Figure 1: Current and SESAR program [13] timeline of actions for airspace and flow management.
Two days beforehand (pre-tactical level), the FMP checks the controllers' duty roster and produces a sector opening schedule based on the predicted traffic and sector capacities. To do so, the traffic demand is evaluated from two data sources:
• FMP can access the previous traffic record up to seven
days before the requested period,
• FMP can access a traffic prediction provided by the
CFMU.
The current method used by the operator to forecast the airspace configuration (the sector opening schedule) is fairly simple. Considering a set of static airspace partitions , that have been previously filed in the system by the FMP staff, the operator selects, for each time step (usually 30 or 60 minutes) the best configuration among those he or she thinks may be the most adequate for this time of the day. The prospective airspace partitions are evaluated by comparing the traffic flow entering each ATC sector to a given sector-specific threshold (the sector capacity). This choice of the best configuration is subjective and based on the past experience of the operator. Once this sector opening schedule is built, there may remain some ATC sectors for which the predicted incoming flow is higher than the capacity. Such potential overload problems are signaled to the CFMU which may enforce some regulations on traffic flows contributing to such overloads.
One day beforehand, the CFMU publishes restrictions on the Flight Plan to the Air Traffic Services and Operators (Airline companies). The FMP defines the ATC capacity according to the exact number of available ATCOs and defines the number of sectors that can be opened.
On D-day, the FMP tries to optimize relations between demand and capacity, to reduce delays in collaboration with the ATC Supervisor and CFMU. Comparing, hour by hour, the traffic demand to the sector capacities, FMP adjusts necessary traffic restrictions. To do so, the FMP operator can perform different actions:
• He anticipates sector overloads, negotiates traffic
regulations with the CFMU,
• He helps the supervisor in the splitting/merging
management of sectors,
• He answers controllers’ requests concerning regulations
required, or available re-routings,
• He reduces, in collaboration with CFMU, the delays
generated by regulations required within the ATCC or adjacent ATCCs.
In the SESAR program, practitioners’ actions are being redefined in order to deal with traffic complexity and density (Figure 1) [13]. The following corresponds to our understanding of the different roles of practitioners in airspace management and may change with the future evolutions of the project.
During the Planning Phase, the Regional Network Management Unit, a kind of FMP, will match overall capacity to demand. In real time, the Complexity Management will optimize the airspace configuration and traffic flows in order to keep the traffic complexity at an acceptable level for ATCOs (p 30 in [13]). The Regional Network Management Unit and the Complexity Manager may both use multi-sector tools.
III. PARTICIPATORY DESIGN APPROACH
In our case, the user tasks are not clearly defined. Therefore, the standard User-Centered Design (UCD) is not fully satisfying. Observations and interviews at the beginning of the design process are not sufficient to define accurately
what the user’s tasks will be, or could be, in a future context
different from today's operations. Participatory design involves the users all along the design process. It is an ongoing research objective [14] and has already been used in the Air Traffic Control field to experiment the augmented paper strip [11] (a mix of paper and informatics strip).
Basically, participatory design assumes that users know what they need and can have innovative ideas [8]. Nevertheless, users are confronted with the difficulty of expressing their needs and finding out how to address them. The approach here is two-ways (as opposed to the unidirectional approach of User-Centered Design): the user is not only observed and interviewed (as in standard UCD), but also integrated into an iterative design process [11], where he is helped by the designers to express his needs clearly and is also repeatedly involved in validation exercises. This ensures that
the design produced at each step of the process meets the users’
needs and is actually usable.
In our project, the final user of the interface is not clearly identified. However, existing operators in charge of airspace-related tasks are well identified: FMP operators and control room managers. Therefore we involved them in our design process with the help of computer scientists (the designer of the algorithm and specialists in Human/Computer Interaction). We organized the reflection around brainstorming and workshops using participatory design methods. We first thought about what kind of improvement our tool could bring to the tasks of the current FMP. We then tried to imagine how to help a future
operator who would dynamically reconfigure airspace at the tactical level in the context of the future ATM systems envisaged by the SESAR program.
IV. AIRSPACE CONFIGURATION FORECASTING
The algorithms forecasting the airspace configuration have already been presented in detail in past publications ([2], [3], [4]), as well as the selection of relevant complexity metrics used as input to these algorithms ([5], [6], [7]). The results presented in these publications show that the computed output is fairly close to the number of ATC sectors that were actually operated. Further work on the algorithms will mainly deal with the introduction of constraints on the transitions between successive configurations, so as to get closer to the way sectors are actually split, merged, or recombined in the field.
In this section, we will very briefly present the hybrid method that was used to forecast airspace configurations, mainly focusing on the features useful to the design of the user-interface. Considering that the airspace is divided into several airspace modules1, we are looking for the optimal partition of the airspace into ATC sectors (each sector is made up of one or several modules) that may be operated by controllers under normal workload conditions.
To that purpose, a branch & bound algorithm is used to explore all possible partitions. This tree search algorithm is
combined with a neural network assessing the controllers’
workload for each ATC sector. The neural network is trained on past sector operations, using the fact that ATC sectors are usually split into several smaller sectors when the workload is excessive, or merged with other sectors when the workload is low.
The dynamic behavior of the algorithm is the following: we start from an initial airspace configuration at time t0 and
consider a time interval [t0; t1] in which we want to forecast the
next optimal airspace partitions. The workload in each ATC sector of the current configuration is checked at each time step
t + δt in the chosen time interval, using the neural network. If
the probabilities computed by the neural network show that the workload is either too high or too low in one or several sectors, an airspace re-partitioning is triggered. In that case, the branch & bound computes a new optimal configuration. It minimizes cost in terms of the number of ATC sectors and the workload in each sector. The neural network is once again used to assess the workload in the sectors of the prospective configurations.
The airspace partitioning may also take into account other constraints, such as the maximum number of controller working positions available throughout the day.
The neural network may be seen as a statistical model tuned so as to minimize the error between the computed output and some observed data. We used a simple feed-forward network (see [1] and [12] for more details on the theory and algorithms of the neural networks) with 6 input units, 15 units in the
1
These modules are usually called airspace sectors, but we shall denote them as airspace modules in the rest of this paper, so as to avoid confusion with the air traffic control (ATC) sectors operated by air traffic controllers, which are made up of one or several modules.
hidden layer, and 3 output units, with the following equation where the weights ɷ were tuned on recorded data:
The input variables x = (x1, … , xi,… , x6) are the
complexity metrics that were found to be the most relevant for our purpose ([5], [6]), normalized by subtracting the mean value and dividing by the standard deviation, and smoothed using a moving average method ([7]). These metrics are the sector volume V , the number of aircraft within the sector Nb, the average vertical speed avg_vs, the incoming flows with time horizons of 15 minutes and 60 minutes (F15, F60), and the number of potential trajectory crossings with an angle greater than 20 degrees (inter_hori).
The output vector y = (y0, y1, y2) can be interpreted as a
vector of posterior probabilities of class-membership ([10]): y0
can be seen as the probability p(Clow=x) that the ATC sector
falls in the "low workload" class when the measured air traffic complexity vector is x, and similarly for y1 and y2, when the
classes are Cnormal and Chigh respectively. Using an abbreviated
notation, we shall denote as y = (plow, pnormal, phigh)T the output
vector in the rest of this paper, so as to clarify the nature of the neural network output.
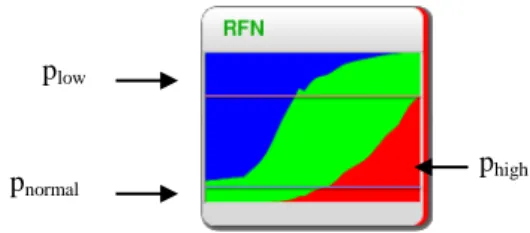
As we are necessarily in one of the above three cases (low, normal, or excessive workload), the sum of the three probabilities plow, pnormal, and phigh is invariably 1 (This is
ensured by the use of the softmax function in the output layer). This allows the three probabilities issued by the neural networks to be displayed, stacked one above the other, in a box of height 1, as shown in Figure 2, where the following color code was chosen: blue for plow, green for pnormal, and red for
phigh. The red line shows the chosen threshold for the phigh
probability, above which a reconfiguration is triggered. Similarly, the blue line is the threshold value for probability
plow.
Figure 2: Three probabilities: plow, pnormal, and phigh
To conclude this section, let us summarize the output data that may be available to the final user. The final output of the forecasting algorithm is a sequence of airspace configurations with their time intervals. Each configuration is a list of ATC sectors for which a workload indication (the neural network output probabilities) is available. There are two threshold values for the low and high workload probabilities. These are parameters of the decision criteria used to trigger the airspace configuration changes. The transitions between successive
configurations are also computed, and may help users to track how the airspace modules are recombined.
V. ITERATIONS: SEVERAL WORK SESSIONS WITH POTENTIAL USERS
This section illustrates our participatory design process with the details of the different steps.
A. 1st session: context and presentation of the algorithm
In this first session, we presented the airspace partitioning algorithm. Most of the discussion was devoted to how this algorithm could be used in the current airspace and flow management context (FMP, CFMU, tactical airspace configuration) or in the future SESAR operational concept (complexity management, multi-sector planning). A group of 6 participants was set up: the designer of the algorithms, HCI specialists, former control room managers and FMP operators.
The session lasted 1h30 and was divided into three parts. After two short lectures (around 15 min each) introducing the algorithm, the FMP tasks today, and the SESAR concept, the group was invited to participate in a brainstorming session (30min) on the following theme: what kind of data will the operator(s) need? The ideas generated during the brainstorming were then discussed during the last 30 minutes. As a result, the participants identified the most relevant outputs provided by the algorithm:
the computed airspace configurations,
the transitions between consecutive configurations, the workload prediction for each ATC sector, in the form of
probability indicators (low/high/normal).
The workload probabilities were considered sufficient for the moment. A further investigation will be conducted to select other potential complexity metrics from among the data used by the algorithm.
The users also expressed the need to identify clearly the events that triggered a configuration change, and the durable overloads that may lead to dangerous situations.
B. 2nd session: brainstorming
The same group participated in a second session. The goal was to be more specific and to find practical ideas for the Graphic User Interface, both for the current task of the FMP and the future task of the Multi Sector Planner (MSP).
There were four steps during the two hours of this session. The first 20 minutes were devoted to a recap of the previous session. Then, secondly, the aims and the practical details of the participatory design process were detailed. Thirdly, the participants were involved in a brainstorming session of around 50min on the following themes: How to display the workload evolution of the ATC sectors (information of low, normal and high workload)? and How to navigate in this display (zoom, translations...)? The proposed ideas where then sorted for 10 minutes. Finally, the last step was a design walk-through phase of 40 minutes, which consisted of “quick and dirty” phigh
plow
prototyping of the selected ideas with paper, pencils and scissors.
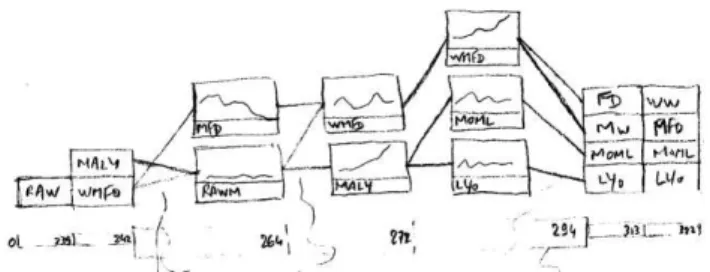
Figures 3 and 4 show some prototype results of the design walk-through. They give an overview of the visualization imagined by the users. Figure 3 shows a compact view with only the names of the ATC sectors with a color code for their status and their potential durable overload. Figure 4 shows the result of a click on a configuration (that at t=264s). The configuration and its surrounding configurations are unfolded to show the relationship between each of the sectors composing them (referred to as inheritance later in this paper) and the detailed workloads. The folding/unfolding paradigm, which only displays a part of the available information, will be further developed in the description of the interface established.
Figure 3: Draft of the overview visualization
Figure 4: Draft of the sector details
C. Development of the prototype
The next phase of the project was the first iteration of the software prototype development. At this level, the prototype basically presents the results of the algorithm: the forecast sector workload, the best configuration propositions, and the merge/split/recombine events over the day, according to the suggestions from the first sessions. Currently, these data are
computed “off-line” for a whole day of traffic. Typically no
interaction to accept/refuse the proposed configurations is available. However, the user can interact with this visualization to explore and understand the sequence of events thus assessing the algorithm's behavior.
This is the first development iteration of this research prototype. Future iterations should allow the user to compute
the airspace configuration “on-line” through the interface. An
additional feature would be to forecast dynamically the configuration on a receding time horizon.
D. 3rd session: evaluation of the prototype
The third session consisted of the evaluation of the prototype with the same persons (plus one HCI specialist). This session lasted two hours with a short recap of the situation (10 min), followed by a plenary presentation of the prototype (10 min).
The group was then split into two skills-oriented subgroups (HCI specialists on one side, ATC specialists on the other) in two different rooms to participate in a handling session. For 40 min, the participants became familiar with the prototype by manipulating it under the supervision of the designers. Questions were answered by the supervisors and remarks/suggestions were noted.
The two subgroups were then reunited for a plenary discussion of one hour of which the goals were to evaluate the first brainstorming choices and assess the prototype as a pre-tactical tool for helping the existing FMP; it also aimed to widen the scope of our vision, in order to consider the possibility of a tactical tool for a yet-to-be-invented user. All the brainstorming remarks were compiled and discussed by the whole group. The points of view of the different participants were confronted and, depending on the HCI/operational origin, some of the suggestions made by a subgroup were developed or modified by the other subgroup, particularly concerning the information displayed in the global view, as we will see in the next section.
There were two kinds of suggestions. Some of the remarks aimed at improving the interface and the interactions; others were proposals for additional interactions for the evolution of the prototype towards a tactical tool: acceptance/refusal of the proposed configurations, manual reorganization of configurations, a what-if function (what will the sector workloads be if I reorganize the airspace like this?)...
VI. CURRENT PROTOTYPE
In this section, we will describe the interface that was produced taking into account the results of the third session (evaluation of the first prototype).
A. Description of the interface
The quantity of information to be displayed is sizeable: successive airspace configurations over the day, transitions between configurations, workload prediction for each control sector at every minute of the day, or other complexity metrics on demand. Consequently, to avoid confusing the user with a view of excessive complexity, we need to present both a global general view and a detailed zoomed one. The user must be able to switch quickly from one to the other, and, moreover, must not lose the focus on the general trend when in a detailed "mode". Therefore it was initially decided to produce a flexible representation of the day, rather than two distinct modes (general/zoomed). A fish-eye [9] type display would have presented all the configurations of the day with a low level of detail and, on demand, would have been able to “unfold” configurations in order to present more detailed information on smaller zones while keeping the schematic and global representation of the rest of the display.
But the standard display size didn't allow displaying all the information even if all the configurations were folded. Users requested an abstract view with the summary of relevant events during a day:
Number of sectors for each configuration (represented as
stacks of sectors),
Global workload for each sector. A color that fills the box
indicates the sector state (low, normal or high workload),
Events that triggered configuration changes (when a “low
workload”, or a “high workload” probability reaches a threshold).
Figure 5: Overview of the sector configurations over one day.
Figure 5 represents a part of the global view. The sector
background color represents the “global” workload so that
durable overloads (red for danger) or underloads (blue) appear very clearly. The colored semi-circles represent the events that trigger a reconfiguration: red for high workload, blue for low workload. Red lines, constituting a limit for some configurations, express the constraints on these configurations in terms of working positions (staff limitations). The sector name appears only for the configuration flown over by the mouse pointer. When the user wants to know more about a specific sector, he can click on it or use a contextual menu to switch to the detailed view via a smooth transition using morphing and fish-eye unfolding, in order to keep the focus on
the “selected” configuration and sector among many others.
Figure 6: Details of configurations over a given time span.
Figure 6 shows a part of the detailed view, where the configurations proposed by the model are displayed as stacks of sectors alongside a time scale, just as in the global view. A sector's global workload is represented by the color of its name.
If it’s overloaded, the whole sector is also emphasized in red.
The colored bars at the right of some sectors symbolize the events. In the detailed view, configurations are folded by default (low level of information because there are a great many configurations), and may be unfolded when selected by the user (high level of information on a few chosen items) as shown in Figure 7. The awareness of connections between, and the evolution of, the sectors is reinforced by animated transitions between folded/unfolded states.
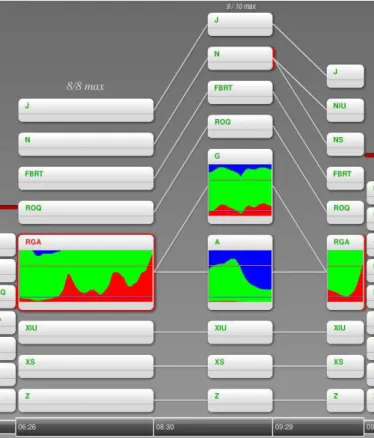
Figure 7: Details of reconfigurations over a given time span.
In Figure 7, the configuration at time t = 08:30 and the surrounding configurations are unfolded. The links between the sectors of these successive configurations are displayed in order to have a better idea of the inheritance.
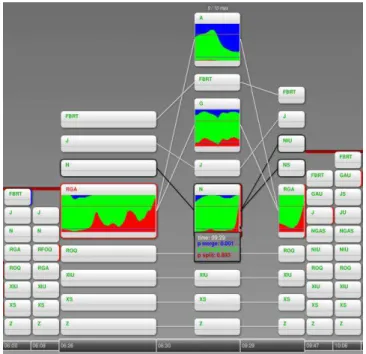
It is also possible to focus on specific control sectors: probability graphics are then displayed for the selected sectors (Figure 8), with a red area for the high workload probability, a green area for the normal workload probability, and a blue area for the low workload probability. The sum of the three probabilities being invariably 1, we stacked them on a single graph (the “high workload” probability is in the lowest area, and the “low workload” probability is in the upper area).
Figure 9: Untangled view with the overloaded RGA sector with no immediate solution.
The threshold values for the workload probabilities are also displayed (thin lines with the same color code as areas) so that
it’s easy to identify the sector that triggers the configuration
changes. For example, considering the workload graph of the pointed sector N in Figure 8, one may see that the high workload probability reaches the decision threshold (probability 0.7) at time t = 09:29, triggering a reconfiguration where this overloaded sector is split into two smaller sectors NIU and NS. One may also see the sector RGA (in the configuration beginning at time t = 06:26) becoming overloaded a few minutes before the end of the configuration (08:30). Normally this situation should lead to an immediate reconfiguration. But at this moment, due to staff limitations, the number of working positions is limited to 8, so the algorithm cannot split this sector. It cannot find a better solution during the following few minutes, thus this sector is strongly emphasized in red to render this abnormal and durable situation clearly visible, whether folded (Figure 7) or unfolded (Figure 9). At 08:30, the staff limitation is raised to 10 working positions. Hence the algorithm can split the overloaded sector into two smaller sectors A and G.
The interactions with the interface are difficult to show here but their principle can be succinctly presented. They are divided into three categories: those which aim at improving the global presentation, those that help to keep the focus on the examined configurations while manipulating or selecting them among the many others and, finally, those that permit the acceleration of manipulations.
In the first category we can cite the ability to sort the sectors manually by dragging and dropping them inside their configuration. This interaction, requested by users at the beginning of the project, is practical when many sectors are opened and some of the links between sectors of two successive configurations may cross, which makes the view difficult to interpret (tangled lines in Figure 8 compared to untangled lines in Figure 9). The user can also choose to unfold three or five configurations (one or two before and after the selected configuration), which, again, was requested by the users (the ATCOs) during the evaluation of the prototype in order to improve, at a given moment, the visibility of the inheritance and return easily to a more compact view. The same goal led us to highlight the immediate inheritance of the sector flown over by the mouse pointer (see Figure 7, where the sectors N, NIU and NS have a dark drop shadow and their links to the pointed sector N are blackened.
In the second category, we can cite a zooming centered on the flown-over configuration and a centered unfolding mechanism divided into three steps: when a folded configuration is clicked, this configuration is first unfolded, and then the surrounding configurations are unfolded. During these two steps, the selected configuration is maintained at its original place. Finally, if necessary, there is an animated translation in order to ensure the visibility of the whole unfolded area.
In the third category, there are several choices of automated manipulations in a contextual menu, depending of the flown over component. Amongst them, there is the possibility to fold or unfold all the sectors of the flown over configuration or all the sectors directly linked to the flown over sector. These features were requested by ATCOs during the evaluation in order to have a rapid and accurate view of the workload in several sectors of a configuration or along an inheritance without having to click on each of them. It was also practical to be able to come back to an intermediary compact view (selected configurations are unfolded but their sectors are all folded as in Figure 7) without having to click on all the unfolded sectors or to fold all the configurations by clicking outside, and then unfold them again.
VII. CONCLUSION AND FUTURE WORK
In this paper, we have depicted the participatory design process that was used to create a Graphic Interface for new algorithms providing airspace configuration forecasts. Our approach was sequenced into several steps: study of the existing displays and ATC tasks in the current context, identification of the relevant information to be displayed in our new forecasting application, brainstorming work to sort out ideas with all the potential users, production of low fidelity (mainly paper) prototypes, assessment of these prototypes, 8/8 max
software implementation, iterative assessments and improvements of the software. We have presented the current version of the resulting research prototype that allows the users to visualize and interact with “off-line” data.
The participatory design approach was found efficient by the users group and other participants. Firstly, the users' feedback on the Graphic Interface and the capability of the algorithms to be operationally useful were highly positive. Secondly, since the users were involved throughout the design process, they also participated actively in the project and had a better understanding of the research issues that were addressed, or that still need to be explored.
Defining or identifying the operational concept (the final user's role and activities, interactions with other actors, etc) into which the proposed forecasting tool could fit, was not within the scope of this participatory design approach. However, some potential uses of the tool were evoked during the brainstorming sessions. Pre-tactical forecasts on a whole day of traffic, computed from Flight Plans, could be used in the current context by the FMP operator. On-line, real-time forecasts could fit in with the SESAR operational concept by allowing the complexity manager to mitigate the risk of overload in the ATC sectors. In that context, the proposed algorithms could allow the operator firstly to anticipate future overloads, and secondly, to check the incidence of alternative corrective measures on the workload and airspace configuration.
In the current version, the successive airspace configuration changes across the day were pre-computed for a whole day of traffic, using actual flight plans as input. In future works, we plan to run the computations on demand through the interface. Subsequent iterations will also address the dynamic re-calculation of the airspace configuration forecasts on a receding time horizon, as well as the introduction of some operational rules on the transition from one airspace configuration to the next (i.e. avoid too frequent recombinations of a same sector, transfer airspace modules from one ATC sector to another).
The continuation of this iterative approach was proposed as part of the DSNA contribution to the SESAR program, in work
package 4.7.1 (“Complexity management in en-route”) and its
industrial counter-part WP 10.8.1 (“Complexity assessment
and resolution”), as well as in WP 7.5.4 (“Dynamic airspace
configuration”). Within this framework, it is expected that this
approach involving potential users, HCI experts, and researchers, in the development of the research prototype will allow us to demonstrate, and validate/invalidate the workload model and partitioning algorithm that are proposed to provide more realistic airspace configuration forecasts.
REFERENCES
[1] C. M. Bishop. Neural networks for pattern recognition. Oxford University Press, 1996.
[2] D. Gianazza. Airspace configuration using air traffic complexity metrics. In 7th USA/Europe Seminar on Air Traffic Management Research and Development, 2007. best paper of "Dynamic Airspace Configuration" track.
[3] D. Gianazza, C. Allignol, and N. Saporito. An efficient airspace configuration forecast. In Proceedings of the 8th USA/Europe Air Traffic Management R & D Seminar, 2009.
[4] D. Gianazza. Forecasting workload and airspace configuration with neural networks and tree search methods. Submitted to Artificial Intelligence Journal.
[5] D. Gianazza and K. Guittet. Evaluation of air traffic complexity metrics using neural networks and sector status. In Proceedings of the 2nd International. Conference on Research in Air Transportation. ICRAT, 2006.
[6] D. Gianazza and K. Guittet. Selection and evaluation of air traffic complexity metrics. In Proceedings of the 25th Digital Avionics Systems Conference. DASC, 2006.
[7] D. Gianazza. Smoothed traffic complexity metrics for airspace configuration schedules. In Proceedings of the 3nd International Conference on Research in Air Transportation. ICRAT, 2008.
[8] J. Greenbaum, M. Kyng, Eds. Design at Work: Cooperative Design of Computer Systems. L. Erlbaum Associates Inc 1992.
[9] G.W. Furnas, Generalized fisheye views. SIGCHI Bull. 17, 4 (Apr. 1986), 16-23.
[10] M. I. Jordan and C. Bishop. Neural Networks. CRC Press, 1997. [11] W. Mackay, A-L, Fayard, L, Frobert, L. Médini, (1998) Reinventing the
Familiar: Exploring an Augmented Reality Design Space for Air Traffic Control. In Proceedings of ACM CHI '98 Human Factors in Computing Systems. Los Angeles, California: ACM/SIGCHI. ACM Press. pp 558-565.
[12] B. D. Ripley. Pattern recognition and neural networks. Cambridge University Press, 1996.
[13] SESAR project, the ATM Target Concept, SESAR definition phase – delivrable 3.
[14] D. Schuler, A. Namioka, Participatory design: Principles and practices. Hillsdale, NJ: Erlbaum 1993.
![Figure 1: Current and SESAR program [13] timeline of actions for airspace and flow management](https://thumb-eu.123doks.com/thumbv2/123doknet/14320060.496908/3.893.472.828.134.369/figure-current-sesar-program-timeline-actions-airspace-management.webp)