Publisher’s version / Version de l'éditeur:
Vous avez des questions? Nous pouvons vous aider. Pour communiquer directement avec un auteur, consultez la première page de la revue dans laquelle son article a été publié afin de trouver ses coordonnées. Si vous n’arrivez pas à les repérer, communiquez avec nous à PublicationsArchive-ArchivesPublications@nrc-cnrc.gc.ca.
Questions? Contact the NRC Publications Archive team at
PublicationsArchive-ArchivesPublications@nrc-cnrc.gc.ca. If you wish to email the authors directly, please see the first page of the publication for their contact information.
https://publications-cnrc.canada.ca/fra/droits
L’accès à ce site Web et l’utilisation de son contenu sont assujettis aux conditions présentées dans le site LISEZ CES CONDITIONS ATTENTIVEMENT AVANT D’UTILISER CE SITE WEB.
Building Research Note, 1982-10
READ THESE TERMS AND CONDITIONS CAREFULLY BEFORE USING THIS WEBSITE. https://nrc-publications.canada.ca/eng/copyright
NRC Publications Archive Record / Notice des Archives des publications du CNRC :
https://nrc-publications.canada.ca/eng/view/object/?id=49d0425b-b0e1-4215-bef6-39a24b3ee2b0 https://publications-cnrc.canada.ca/fra/voir/objet/?id=49d0425b-b0e1-4215-bef6-39a24b3ee2b0
NRC Publications Archive
Archives des publications du CNRC
This publication could be one of several versions: author’s original, accepted manuscript or the publisher’s version. / La version de cette publication peut être l’une des suivantes : la version prépublication de l’auteur, la version acceptée du manuscrit ou la version de l’éditeur.
For the publisher’s version, please access the DOI link below./ Pour consulter la version de l’éditeur, utilisez le lien DOI ci-dessous.
https://doi.org/10.4224/40000518
Access and use of this website and the material on it are subject to the Terms and Conditions set forth at
Subjective rating of the sound insulation of party walls
INTRODUCTION
For many y e a r s the D i v i s i o n of Building Research has s t u d i e d noise- r e l a t e d problems in b u i l d i n g s and the p r o p a g a t i o n of this n o i s e through
walls.
The r e s u l t s of t h i s work provide guidance to the constructioni n d u s t r y and t o government agencies such a s Canada Morrgage and
Rousing, and are a major source of i n p u t to the National B u i l d i n g Code.
Our overall understanding of t h e p h y s f c a l acoustical aspects of
sound isolation between d w e l l i n g s has gradually improved. For about 20
years the sound insulating properties of p a r t y walls have been measured in term of t h e i r sound transmission class (STC), and t h e N a t k o n a l Building code1 now speciffes that p a r t y walls should achieve a minimum
sound insulation of STC 4 5.
U n f o r t ~ ~ n a t e l y , very l i t t l e progress has been made concerning the human s i d e of the problem. The lack of extensive s t u d i e s and d a t a on human reactions to v a r i o u s l e v e l s of party-all sound i n s u l a t i o n has made i t difficult to verify the accuracy of STC in predicting such adverse reactions. For t h e same reason, it has n o t been p o s s i b l e to
d e t e d n e a satisfactory mi nirnum v a l u e of p a r t y - w a l l sound insulation,
or t o understand the i n t e r a c t i o n of t h e many factors t h a t i n f l u e n c e t h e reaction of residents to noises caused by their neighbours. Since sorrnd tnsulation of party w a l l s is solely for the benefit of p e o p l e , it is Fmpcrardve that researchers improve t h e i r undess t a n d i n g of how p e o p l e i n multi-residence b u i l d i n g s react t o n o i s e s from t h e i r neighbours.
A number of f i e l d surveys on t h e annoyance caused by various environmental n o i s e s such as road traffic noise have been carried o u t .2 More
recent
s t u d i e s using improved experimental t e c h n i q u e s have f o u n d q u i t e strong c o r r e l a t i o n s between i n d i v i d u a l responses anda c o u s t i c a l measrlrements o f traffic noise l e v e l s . 3-6
It
was n o t c l e a r however, whether the methods usedin
the traffic n o i s e surveyswere
s u i t a b l e f a r a survey concernkg party-wall sound insulation, s t n c e
comparable prevlous studies were n o t available. (Data from t w o very recent unpublished studies have b e e n o b t a i n e d and are d i s c u s s e d later in t h i s r e p o r t . ) For example, it was not: known whether annoyance-type
r e s p o n s e s c o u l d be related to physical measures of sound insulation in a statfstically significant manner, o r whether the situation would be confused by other i n t e r v e n i n g variables. This n o t e describes t h e p i l o t
study undertaken to test the suitability of one proposed experimental approach,
To make the physical measurements as complete as possible, it was d e c i d e d to i n c l u d e both detailed 113 octave band measurements of sound
fnsularion as w e l l as at least one complete 24-hour record eE background noise levels in each home, The physical measurements were to be carried out a f t e r the related interviews were completed. As in p r e v i o u s traffic
n o i s e surveys, t h e i n i t i a l approach to each subject w a s designed to
o b t a i n the maximum cooperation, wlthout p o s s i b l y biasing responses by
exact purpose of the study. The subjective responses were to be
o b t a i n e d w i t h a s t r u c t u r e d q u e s t i o n n a i r e a d m i n i s t e r e d by a t r a i n e d
interviewer in each person's home. Results were o b t a i n e d Erom p a i r s of adjacent homes.
In
a l l , t h e r e s p o n s e s of 98 subjects were i n c l u d e d i nthe analyses, tagether with measurements o f the background noise . l e v e l s
in t h e 98 homes and t h e sound i n s u l a t i o n af t h e 49 common w a l l s .
F o r p r a c t i c a l reasons, i L was p o s s i b l e to consider o n l y one
ne5ghbour of each s u b j e c t , to measure only one common wall, and to
measure hackground levels at only one p o i n t during only one day. As t h e s e was n o p r e v i o u s information to i n d i c a t e whether disturbance d u e to
neighhours' noises was related to some p r o p e r t i e s of t h e wall, to n o i s e
l e v e l s in each home, or to a combination of these quantities, the p r o c e d u r e used should ideally have allowed the c o n s i d e r a t i o n of a l l p o s s i b l e variations. Unfortunately, f t was n o t p r a c t i c a l t o make more e x t e n s i v e measurements, due to the extra research e f f o r t r e q u i r e d , and
t o the d i f f i c u l . t y of finding large numbers of subjects willing to p e t d r
such dfsruption of their homes.
TI.
SURVEY PROCEDURE1. General
S i n c e t h i s w a s only a p i l o t study, it was limited to 100 s u b j e c t s . To ensure t h a t such a small sample would allow a r e l i a b l e e v a l u a t i o n of t h e proposed techniques, it was essential t o include the widest p o s s i b l e
range of sound i n s u l a z i o n v a l u e s . To s i m p l i f y administrative p r o b l e m ,
only r e s i d e n t s l i v i n g tn condorntniurns were approached. A l o c a l
condominfum management company a s s i s t e d by suggestfng sites that might
have superior, average or i n f e r i o r quality sound i n s u l a t i o n . S u b j e c t s
were s e l e c t e d randomly in pairs from 11 different s i t e s . G e n e r a l l y , 10
s n b j e c t s ( 5 pairs of a d j a c e n t dwellings) were interviewed at each site,
b u t t h e r e were as f e w as 6 a n d as many as 1 2 interviews at some s i t e s .
S u b j e c t s were first contacted by means a £ a n i n t r o d u c t o r y L e t t e r stating that t h e y would be v i s i t e d by an i n t e r v i a e r Erom the Division of B u i l d i n g Research a t t h e N a t k o n a l Research Council who w a s c a r r y i n g
o u t a ' " B u i l d i n g Satisfaction Survey", The i n t e r v i e w s were carried o u t
using a structured qirestionnaire that is described in the fol2owing
section. F o l l o w i n g a successful i n t e r v i e w , the i n t e r v i e w e r asked i f t h e
s u b j e c t would permit sound insulation and background noise measurements
to be made. T f one of t h e a d j a c e n t ne-lghbours was a l s o s u c c e s s f u l l y CntervIewed and a l s o agreed t o permit noise and sound i n s u l a t i o n to be measured, then one complete pair of i n t e r d e w s from adjacent residences was o h t a l n e d and sorind fnsulatian measurements were made within a month a f t e r the I n t e r v i e w s .
The First Lnterview of each pair was selected r a n d o m l y f r o m s i t e
p l a n s . The person answering t h e door, if 1 8 years or o l d e r , was asked t n answer t h e questionnaire. Interviews were carried out both in t h e d a y t l ~ n e a n d t h e evening t o e n s u r e a reasonable b a l a n c e between male and
fernale r e s p o n d e n t s . Of the s u b j e c t s , 84% l i v e d i t 1 two-storey row h o u s i n g , while t h e r e m a i n d e r l i v e d i n a p a r t m e n t h l o c k s . This linevet1
spread between row housine and apartments was dellberate s i n c e thr
acoustically s i m p l e r case of row h o u s i n g was e x p e c t e d t o p r o d u c e s i g n i f i c a n t p r o b l e m s , while the more complex situation in a p a r t m e n t
h l o c k s was not c o n s i d e r e d s u i t a b l e for an i n i t i a l p i l o t s u r v e y , A few apartment condominiu~n r e s i d e n t s were included, however, t o give some
i n d i c a t i o n of t h e possible problems in t h a t t y p e of building.
t n a l l , 120 successful i n t e r v i e w s were o h t a i n e d which r e s u l t e d i n
9 8 s u b j e c t s for t h e f i n a l analyses. Of t h e o t h e r i n t e r v i e w s , 20 w e r e
unmatched Interviews; t h a t
is,
a successful interview with an a d j a c e n tn e i g h b o u r could not o b t a i n e d . The 2 r e m a i n i n g i n t e r d e w s caurd n o t b e
used because one subject e v e n t u a l l y withdrew permission f o r the sound insulation measurements. b r i n g the i n t e r v i e w i n g stage, 27 s u b j e c t s declined to be interviewed and a f u r t h e r 6 s u b j e c t s d i d not meet the
requirements f o r subjects. I f one considers t h e 27 refusals as a
proportion of t h e 120 successful interviews, a response rate of 81% was o b t a i n e d .
On completion of t h e field measurements, a l l subjects received a
letter i n f o r m i n g them o f the average results f o r t h e i r condominium c o r p a r a t i o n , and thanking them for t h e i r assistance,
2. The Questionnaire
The questionnaire and coding tnformatkon is included i n Appendix A.
T h e f i r s t section of the questionnaire (Questtans 1 to
9)
c o n t a i n s open-ended questions and some d i r e c t questions about the general desirability o f t h e b u i l d i n g i n which t h e subject l i v e s . Questions 10 a n d I 1 a s s e s s rhe n o t s i n e s s of h i s particular home a n d lifestyle, w h i l e w e s t i o n s 12
to 19 assess directly elicited annoyance to v a r i o u s r y p e s of n o i s e s .
The noises made by n e i g h h o u r s are considered separately f o r different s p a t i a l relationships w i t h i n the b u i l d i n g a n d f o r different t i m e s of
day. Also i n c l u d e d are questions t o determine which n o i s e s a r e
partfcularly annoying. Questions 2 0 and 2 1 concern t h e p o s s i b i l i t y of sleep disturbance due to n o i s e and are followed by Q u e s t i o n 2 2 , which is
a n a t t e q t to measure t h e p e r c e i v e d annoyance in terms of a r e a d i l y
understood o b j e c t i v e c o s t . Questions 23 to 2 8 gather demographic and
other d a t a that may c o n t r i b u t e t o understanding annoyance r e s p o n s e s . The l a s t page of the questtonnaire c o n t a i n s Spellbergerrs measure of
t r a i t anxiety7 which i n p r e v i o u s s t u d i e s of annoyance due to n o ~ s e ~ - ~
,'
h a s been f o u n d t r 3 cant rithlte to annoyance r e s p o n s e s .Most responses were obtained u s i n g seven-point response scales w i t h o n l y
the extremes and t h e mid-pofnrs labelled. These were L a b e l l - e d " n o t a t a l l , " "medium" and "extremely." T h i s procedure had b e e n found TO be
s u c c e s s f u l i n t h e p a s t i n p r o v i d i n g a p p r o p r i a t e i n t e r v a l s c a l e d a t a , a n d
was lised agaln here w t t h only a minor change to one of the labels t o
The questlnnnaire was pretested on s u b j e c t s w o r k i n g L n the D t v i s i o n
o f
B u i l d i n g Reseat-ch. To ensure a realistic t e s t , p r e t e s t s u b j e c t s were selected who I t v e d in multiple-residence b u i l d i n g s and had no t e c l r n l c a lk n m l e d g e of any p r e v f nus a c o u s t f c a l s t u d i e s .
A total of 98 v a r i a b l e s per subject were entered into the Final data f i l e of which 30
were
n o i s e or s o u n d insulation measures. Survey responses were entered d t r e c t l y i n t o a mini-computer u s f n g a program t h a t promp Led t h e u s e r w i t h q u e s t i o n s f r o m t h e q u e s tlannaire. Avoiding the i n t e r m e i l k a t e step a€ codlng sheets thus eliminated t h e passibtlityof
errors in
transcription.3. Noise and Sound Insulation Measures
In each home one complete 26-hour record of normal background n o i s e
l e v e l s was o b t a i n e d u s t n g a miniature d e v i c e that s tored a n A-weigh ted
%(2 value (energy equivalent sound l e v e l ) digitally f o r each three- m l n u t e p e r i o d of a complete 24-hour day (Metrosonics ?letrnlogger dB-
301). from these 480 L v a l u e s , a daytime ( 7 ~ 0 0 a . m . to 10:00 p . m . ) , EQ
a n i g h t t i m e (10.00 p.m. to 7 : 0 0 a . m . ) and a complete 24-hour L v a l u e
were calculated. 'Chese are referred to as L D EQ * ~ - E Q
'
and LEQ 'Q24,
sespectfvely, in t h i s reporr. Each subject's d a t a in the final d a t a f i l e c o n t a i n e d t h e three L values f o r b o t h h i s home and h i s
Erl
n e l g h b o u r ' s . S i n c e t h e homes w e r e a l l o c c u p i e d a n d t h e occupants
frequently I n c l u d e d small children, t h e LEq measuring d e v t c e s had to be pnsttioned in Incations where they were least likely t o be disturbed r a t h e r t h a n i n acoustically optimum p o s i t f o n s . Thus, they were u s u a l l y
p l a c e d on shelves or on t o p o f c a b i n e t s t n the Living room of each home, T h e m i c r o p h o n e was g e n e r a l l y c l o s e t a a wall o r large r e f l e c t i n g p i e c e of f u r n i t u r e .
To n l n i r n i z e the inconvenience t o subjects, the t e s t sounds were
tape recorded i n t h e h a w s and then analyzed in t h e laboratory w i t h a computer. When perfected, t h i s technique allowed the c o m p l e t e sound
t r a n s m i s s i o n loss measurements i n v o l v i n g measurements in two a d j a c e n t
homes to be completed in
20
minutes.I n
a number of c a s e s a more t i m e - consuming procedure s i m p l y would n o t have been t o l e r a t e d .Using a conventional pink noise source and a FH instrumentatLon tape recorder, sounds were r e c o r d e d for three 16-second b u r s t s i n b o t h
the receiving and source rooms. A manually rotated microphone boom was
u s e d to average t h e sound l e v e l s f o r each room.
In
t h e s i d e s e l e c t e d a st h e receiving room, hackground nofse l e v e l s , as w e l l a s f i v e sound decays, were a l s o recorded, a g a i n u s i n g a pink n o l s e source. When recording the r e c e i v i n g room levels, in which the spectrum was s t r o n g l y tnfluenced by t h e t y p i c a l sound transmission l o s s p r o p e r t i e s of w a l l s ,
t h e sfgnal was f i r s t filtered to provide a f l a t t e r spectrum and t h e r e b y
to o p t i m i z e the use of t h e d y n a d c range of t h e tape recorder. An
i n v e r s e filter w a s then tised when playfng back t h e sound. The tape
digital converter i n t e r f a c e d t o the integrated (RMS] o u t p u t s of a
p a r a l l e l s e t of 1/3 o c t a v e f i l t e r s . Ry a v e r a g i n g the s a m p l e d s o u n d
l e v e l s i n each 11'3 octave band from 100 to 4000 llz over t h e time
required f o r the microphone t o r o t a t e , roowaveraged sound l e v e l s were
p r o d u c e d for the two cases t h a t used the p i n k noise source, as well a s
f o r the background n o i s e l e v e l s . The average of t h e sound decays
in
each 113 o c t a v e band was displayed oa a computer graphics t e r m i n a l . The o p e r a t o r t h e n selected the portion of t h e curve to whlch a s t r a i g h t l i n e was t o be fitted for calculating the reverberation t i m eI n
the r e c e i v i n g room. This avoided any possibility of including the e f f e c t s ofbackground noise l e v e l s in the calculation of reverberatlon times.
The sound transmission loss
(TL)
was calculated in each IJR o c t a v o band, from 100 to 4000 Hz, u s i n g t h e relationship:-
-
where SPLS, SPLR are the space-averaged sound pressure l e v e l s I n the source and receiving room respectively, S is the area o f t h e common
wall and AR 5s the total sound absorprion in the r e c e i v i n g room c a l n ~ l a t e d f r o m t h e Sabine reverberation e q u a t i o n as
where
V
is the room volume of the receiving room and TbO, t h e measured reverberation time.From the information for each 113 octave, several single-oumber
r a t i n g s o f t h e a i r b o r n e sound i s o l a t i o n were c a l c u l a t e d . The sound
transmission c l a s s (STC) was calculared from the El3 octave STI, v a l u e s f r o m 125 t o 4000 Hz according t o t h e standard procedure ASTM ~ 4 1 3 . ~ ~
The noise isolation class
(NIC) was
c a l c u l a t e d as well usFng the ASTME59b
procedure.'
I n addition, s e v e r a l A-weighted single-number measures were c a l c u l a t e d which, although not standardized quanrlties, are extremely s f m i l a r t o theASTM
E597 procedure.1ZSince some of the A-weighted measures depend on t h e s o u r c e
spectrum, t h e s o u r c e room levels were f l r s t c o r r e c t e d by e s t a b l i s h i n g
equal l e v e l s in each 1/3 actave band so that the source room spectrum
was e x a c t l y pink in nature. The same c e r r e c t i o n s were then a d d e d to t h e corresponding 113 o c t a v e sound l e v e l s in the r e c e i v i n g room, Four of
t h e f i v e measures calculated were a form of A-weighted l e v e l d i f f e r e n c e and would therefore be i n f l u e n c e d by the source spectrum. The exception
was a n A-weighted transmission loss sum g i v e n as Eollaws:
en,+
w,
1/10
STA = -10 l o g{
-
L
f 7 101
TLi are the individual 113 octave sound transmission l o s s values
o b t a i n e d a s in equation ( 1 ) above; Wi are t h e attenuations in d e c i h e l s
of the A-weighting curve a t the 113 o c t a v e band c e n t r e frequencies. The
STA
values are positive and very s i m i l a ri n
magnitude to the correspondingSTC
values.Four A-weighted
difference in
levels-type measures were c a l c u l a t e d and given t h e symbols 136, DAS, OAN, DANS. The f itst, DA, was s i m p l y t h edifference in o v e r a l l A-weighted l e v e l s measured a f t e r t h e s o u r c e was corrected to be p e r f e c t l y p i n k . The second, DAS, was an A-weighted difference in o v e r a l l l e v e l s between t h e source and r e c e i v i n g rooms
a f t e r the s o u r c e had been c o r r e c t e d to t h e source spectrum proposed by Schultz. This Schultz source spectrum is i n c l u d e d in the ASTM E597
procedure.12 Two other measures included a normalization that
compensated for v a r i a t i o n s i n common wall area and r e c e f v i n g room
a b s o r p t i o n . Thus, before t h e A-weighted d i f f e r e n c e s f o r each 113 o c t a v e
band were summed up, they were normalized by an addition of -10 l o g
( S / A ~ )
(where Al is t h e i n d i v i d u a l 1/3 o c t a v e band r e c e f v i n g rooma b s o r p t i o n ) , N o r m l i z e d A-weighted differences c a l c u l a t e d w i t h a pink
s o u r c e spectrum were given the symbol
DAN,
and t h o s e calculated w i t h the Schultz source spectrum were g i v e n t h esymbol
DANS.Lri t h e analysis of the results a further n o i s e m e a s u r e , the B r i t i s h aggregate adverse deviation
(AAD)
,
was a l s o c a l c u l a t e d ( e . g .,
s e eRef. 1 3 ) . 731s measure is t h e sum of a l l deviations below a reference c o n t o u r and thus ignores
all
bands where the measured p e r f o r m n c e is superior to t h e performance standard contour.4 . Analysis
Roth the survey response data and the noise and sound Insulation data were i n i t i a l l y processed on a tnini-computer. A final combined d a t a f i l e was created w i t h 98 variables f o r each s n b j e c t as d e t a l l e d in
Appendlx A. The combined d a t a file was t h e n t r a n s f e r r e d to the NRC
IBM 370 computer and s t a t i s t i c a l a n a l y s e s w e r e carried out using t h e S t a t i s t i c a l Package for Social Sciences ( S P S S ) , Release 8.1.
I RESULTS
I.
Characteristics of the Survey SamafeS i n c e the sample in t h f s pilot s t u d y is q u i t e small (98 s u b j e c t s ) , survey responses should be considered w i t h reference to t h e p a r t i c u l a r
acoris tPcal csndi tions t o
whlch
they relate and not as g e n e r a l l yrepresentative of some larger p o p u l a t i o n .
In
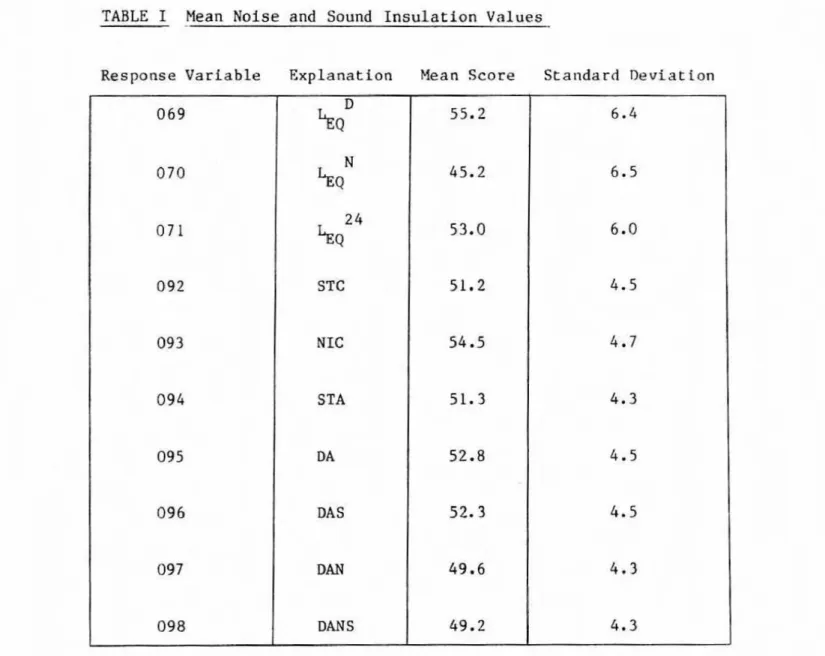
Table I, which summarixes measured noise l e v e l s and single-number sound i n s u l a t i o n v a l u e s , the mean v a l u e and s t a n d a r d d e v i a t f o n aboat the mean is given for each quantfty. It is seen that the mean 24-hour Td in the homes measuredEQ
sound transmission c l a s s (STC) is shown in T a b l e Z to be 51.2 dB. The complete d i s t r i b u t i o n of measured STC values, t l l t ~ s t r a t e d i n Figure I ,
ranges from 39 t o 60 dB. F i g u r e 2 presents the mean v a l u e s and s t a t ~ d a r d deviation of t h e measured 113 octave s o u n d t r a n s m i s s i o n loss (TL)
v a l u e s .
It
is seen t h a t these datado
represent a quite w i d e range o fparty-wall sound insulation v a l n e s In t e r n o f the STC. S i n c e one w o u l d
not expect to find significant numbers of walls with STC values outside
t h e range i n c l u d e d h e r e , t h e s e d a t a s h o u l d thus be r e p r e s e n t a t i v e of
most r e a l i s t i c party-wall sound i n s u l a t i o n v a l u e s . Unfortunately, t h e r e
i s a perhaps i n e v i t a b l e concentration of STC v a l u e s In the range STC 46
-
54
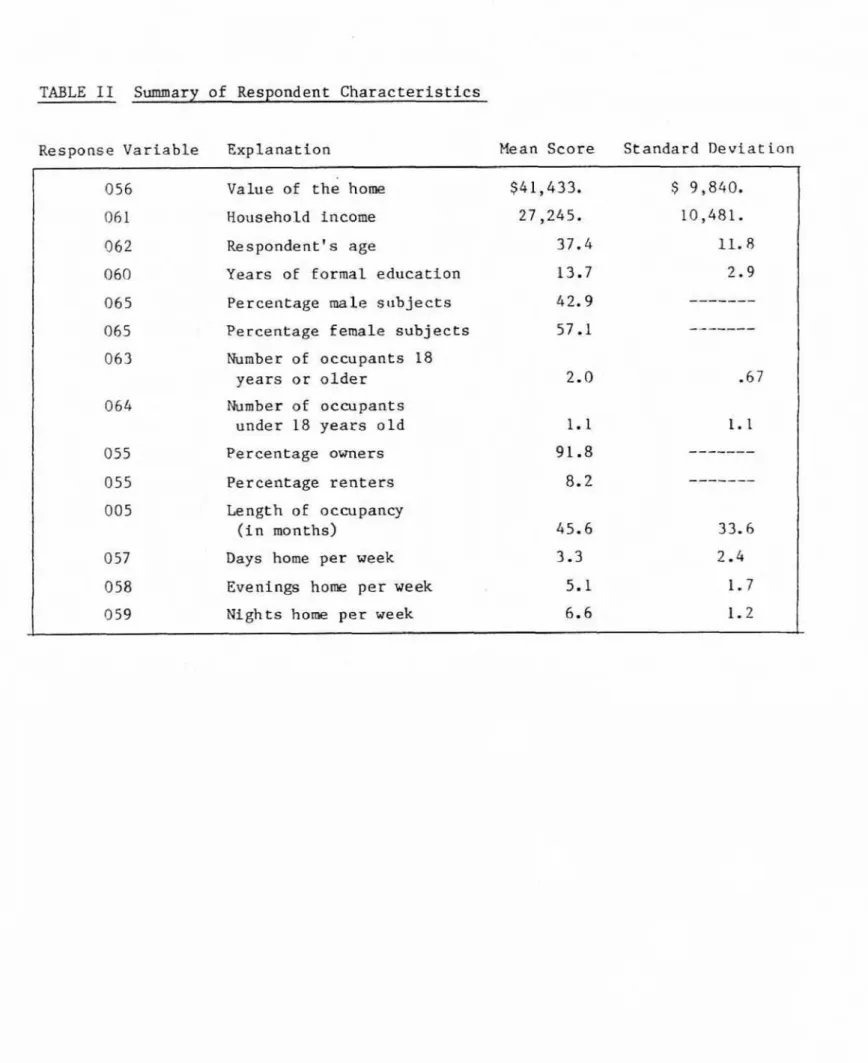
whfch i n c l u d e s 69% of the d a t a .A summary oE t h e b a s i c dernographlc information f o r t h e 98 s u b j e c t s of t h i s s t u d y 1s f o u n d in T a b l e 11. The s p l i t between males a n d females
was nearly equal and q u i r e satisfactory for studying p o s s i b l e e f f e c t s
d u e t o t h e respondents' sex. It w o u l d a p p e a r t h a t mast r e s p o n d e n t s were away from home d u r i n g the day and p r o b a b l y worked full-time, w h l l e a smaller number worked in t h e evenings o r at n i g h t and w e r e u s u a l l y hone d u r i n g the day. Since the residences were a l l condominiums, most
s u b j e c t s (91.82) were a l s o the owners of the home.
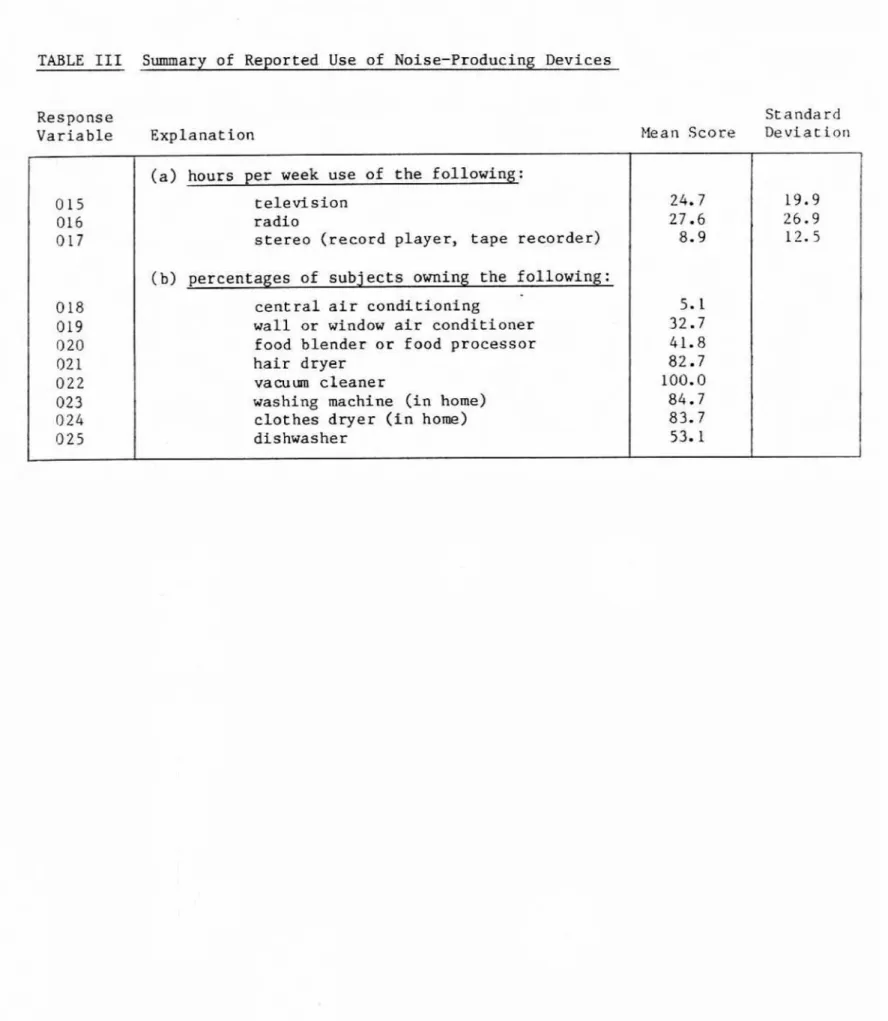
T a b l e LIP summarizes the ownership and use of various potenttally n o i s e - p r o d u c i n g d e v i c e s .
On
average, r a d i o s and t e l e v i s i o n s we r e foundt o be u s e d many more hours per week t h a n s t e r e o equipment. It should b~
n o t e d t h a t t h e range o f t h e s e values as reflected by t h e s t a n d a r d
d e v i a t i o n s ts quite large; there i s thus considerable v a r i a b i l i t y among the subjects
In
t h e use sf t h e s e three types ef d e v i c e s , T a b l eI11 a l s o lists the percentages of s u b j e c t s owning various n o i s e -
producing a p p l i a n c e s -
Annoyance responses ate f r e q u e n t l y examfned by considering the
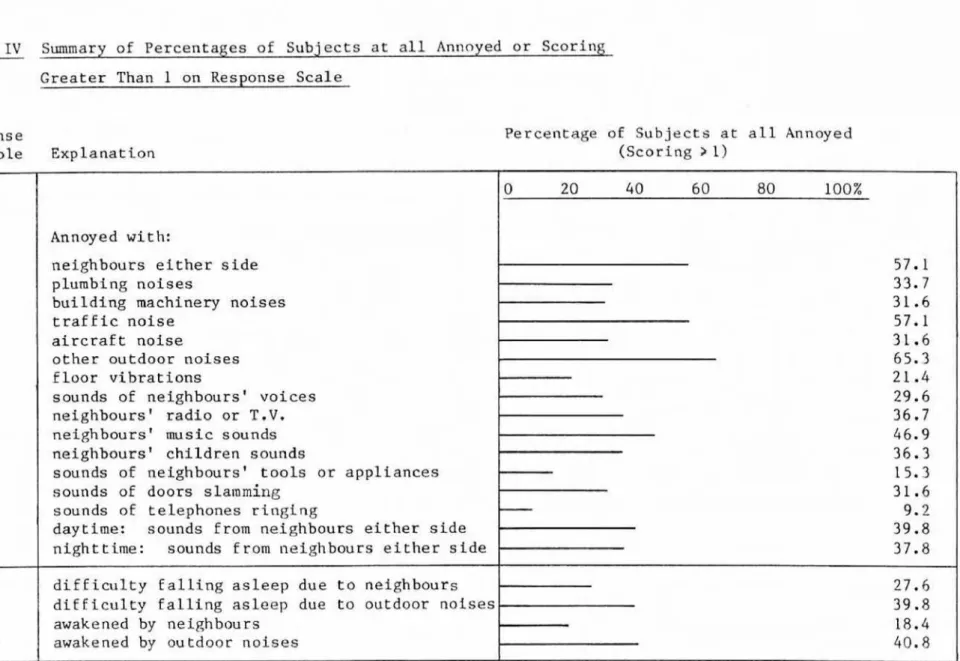
p r o p o r t i o n of respondents who a r e very annoyed by v a r i o u s n o i s e s . Because there were only 98 subjects in all, the number of subjects falling i n t o t h i s extreme c a t e g o r y w a s g e n e r a l l y too s m a l l to p r o v i d e r e l i a b l e r e s u l t s . For t h i s reason, t h e annoyance responses were flrst emmined i n t e r m of the percentage of s u b j e c t s who were annoyed t o any
degree. Thus, T a b l e IV shows the percentage of subjects s c o r i n g g r e a t e r t h a n 1 on various response s c a l e s . From T a b l e IV i t is seen t h a t more
than half of t h e subjects were annoyed by noises from neighbours on
e i t h e r s i d e of them, by t r a f f i c noise and by other ourdoat nolses. C l e a r l y , the problem of annoyance due ta outdoor noises ( i n c l u d i n g
traffic n o i s e ) was at l e a s t as severe a s t h e probLern of d i s t u r b a n c e or annoyance due to n o t s e s from their neighbours. Plumbing n o i s e s ,
b u i l d i n g m c h i n e z y noises, a i r c r a f t n o i s e s , neighbours' n o i s e s and doors slamming annoyed from 30 t o 34% of the respondents. Of course, t h e
percenLage annoyed by atrcraf t noFse would depend l a r g e l y on the
location of each home r e l a t i v e to a i r c r a f t f l i g h t paths- Annoyance d u e
to floor v i b r a t i o n s , noises from t o o l s and a p p l i a n c e s , a n d t e l e p h o n e
difficulty f a l l i n g asleep and were more o f t e n awakened by outdoor noises than by noises from t h e i r neighbours.
S u b j e c t s were asked whether there was any particular room i n which t h e y were mote annoyed by noises from their n e i g h b o u r s . Of the 4 5
s u b j e c t s who responded, 55.8% were more annoyed while in t h e i r bedrooms whereas 27.8% were more annoyed i n t h e i r living r o o m .
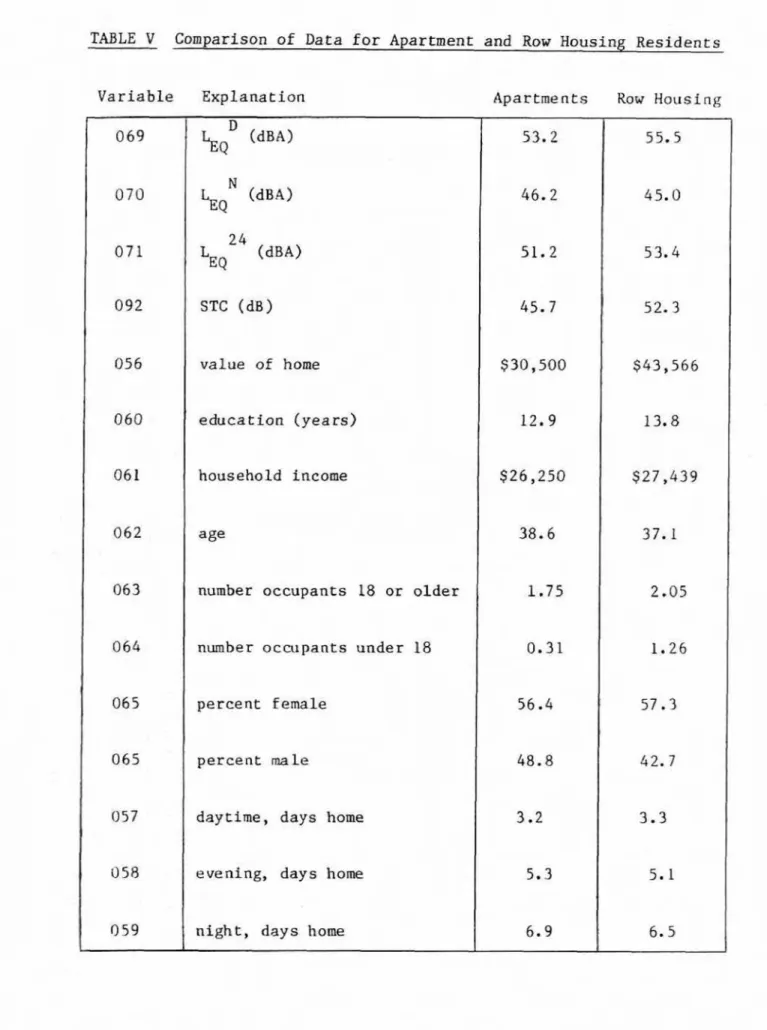
2 . Differences Between Row Housing and Apartment R e s i d e n t s
Of the 98 s u b j e c t s , 16 l i v e d in a p a r t m e n t condominiums and 8 2
l i v e d
In
two-storeyrow
h o u s i n g condominiums. Although the number of apartment residents was by d e s i g n very small, some c o m p a r i s o n s betweent h e t w o types of d w e l l i n g s can nevertheless be mde. T a b l e
V
comparesd a t a describing the two groups nF residents. It is seen that the noise
l e v e l s in the homes were qufte similar f o r t h e s e t y p e s of homes. Row
housing was on average s l i g h t l y n o i s i e r i n t h e daytime, perhaps because
of the on average g r e a t e r number of c h i l d r e n in t h e s e homes. There w e r e considerable d i f f e r e n c e s i n t h e
STC
values between t h e two housingt y p e s , the average STC f o r the apartments measured beFng c o n s i d e r a b l y
less t h a n thar f o r t h e row housing. While these observations certainly cannot be g e n e r a l t z e d , they must be borne I n mind when comparing
annoyance responses, From the other d a t a in Table V, one c a n s e e t h a t
the r o w houstng sample included more expensive homes, more c h i l d r e n , but
no other large differences when compared w i t h the apartment housing sample.
Table V I compares annoyance responses €or the t w o housing t y p e
groups. This table gives percentages of subjects who were "at all annoyed" on each response ( i - e . , scored greater t h a n I ) , and contains
combined d a t a s i m i l a r to those Fn Table TV, A number of results
i n d l c a t e t h a t apartment dwellers
were
much more disturbed rhan row h o u s i n g r e s i d e n t s . F o r example, although the percentage of r e s i d e n t sannoyed by noises from neighhours on either side of them was o n l y slightly less for t h o s e in apartments than f o r t h o s e in row housing,
t h e y were d i s t i n c t l y mnch more annoyed by: n o i s e s from neighbours above o r b e l w (81.2%), noises i n h a l l s and s t a i r s (68,7%), t r a f f i c noises
(51.2%1, and the sounds of doors slamming. Host of shese examples of
g r e a t e r annoyance f o r apartment d w e l l e r s are n e t r e a d i l y a t t r i b u t e d to
t h e i n f e r i o r average measured STC of their party walls. P e o p l e l i v i n g
i n apartments are s u b j e c t e d to a greater number of sources of a n n o y i n g noises, some af whlch are more likely to be a more s e v e r e p r o b l e m in a p a r t m e n t b u i l d i n g s . Only apartment d w e l l e r s can have neighbours above
or below them, n o i s e s from h a l l s and s t a l t s , and f o o t s t e p noFses above them. 'In a d d i t t o n , because of t h e nature of their b u i l d i n g s , they a r e poteotially exposed to more types of buildlng machinery n o i s e s and d o o r s
slamming. This combination of more sources of annoying n o i s e and g r e a t e r expostire t o some n o i s e sources causes a more s e v e r e noise Impact on them. A case in point is t h e f a c t that a11 f o u r s l e e p
response i t e m s Indicated greater disturbance to a p a r t m e n t dwellers t h a n
generally i n f e r i o r p a r t y - w a l l sound insulation of apartments. A l t l ~ o u g h t h e sound i n s u l a t i o n of floors w a s n o t a c t u a l l y measured i n this s t u d y , it appears to be a more c r i t i c a l problem in apartments t h a n the
i n s u l a t i o n a5 p a r t y w a l l s .
D e s p i t e t h e limitations caused by t h e small number of a p a r t m e n t r e s i d e n t s surveyed, these comparisons c o n f i r m t h e expectat fon t h a t t h e
disturbance by n e i g h b o u r s
'
noises within aparrrnent b u i l d i n g s is a muchmore complex p r o b l e m t o untangle than that f o r r w h o u s i n g . They a l s o i n d i c a t e t h e need f o r a d e t a i l e d s t u d y of sound Insulation problems i n floor and cetling assemblies and of f o o t s t e p noise.
3. Cornnosite Resnonse Scales
P r e v i o u s research8 has shown composite response scales to h e more
r e l l a b l e measures of disturbance t h a n single-ftem responses a n d more h i g h l y correlated
with
o b j e c t i v e acoustical measures. I n t h i s s t u d y af a c t o r a n a l y s i s was f l r s t carried out a n 2 2 annoyance and s l e e p
disturbance responses, using the principal components method of factor
a n a l y s i s . Any factors w i t h e i g e n v a l u e s greater than l.
Ci
were t h e n rotated by vsrimax. Ffnahly, composite response scales were formed by summing the responses t o i t e m t h a t l o a d e d s t r o n g l ya n
t h e major factor.It
was found to be diEficult to c r e a t e a composite r e s p o n s e scale t h a t c o r r e l a t e d much more s t r o n g l y w i t h acoustical measures t h a n d i d the individual i t e m responses. By limiting the p o s s i b l e number OF f a c t o r sro t h r e e , and o n l y summing items that had f a c t o r loadtngs 3 0.70 on the
m a j o r f a c t o r , which explained 64% of the response variance, a composfte r e s p o n s e scale was formed. The composite scale i n c l u d e d t h e E o l l o w l n g
ttems: annoyance w i t h n e i g h b o u r s h o i c e s , annoyance w i t h nei~hbours' music sounds, annoyance w i t h noLses from n e i g h b o u r s on either s i d e i n
the daytime, annoyance w i t h n o i s e s from neighbours on e i t h e r side at n i g h t , a n d Frequency of d i f f i c u l t y in f a l l i n g a s l e e p due t o neighbours' noises. This composite annoyance scale, which r ~ s u l k e d from a f a c t o r a n a l y s i s of response scores, is r e f e r r e d t o as r e s p o n s e v a r i a b l e 101 tn
t h i s report.
A second composite annoyance s c a l e was formed by summing t h e € o u r responses c o r r e l a t i n g most h i g h l y wirh measured STC values and is
referred t o as response variable 104. The four items w e r e : perceived
n o i s e i n s u b j e c t ' s own home, annoyance w i t h t h e sounds of n e i g h b o u r s ' voices, annoyance with neighbours' music sounds, and frequency of
d i f f i c u l t y in f a l l P n g a s l e e p due to neighbours' n o i s e s . This somewhat a r b i t r a r i l y dertved s c a l e c o r r e l a t e d more s t r o n g l y w i t h STC v a l u e s t h a n
the s c a l e derived by f a c t o r a n a l y s i s , as will b e s e e n i n t h e f o l l m i n g sections, Although both annoyance scales were used I n subsequent
a n a l y s e s , one s h o u l d be auare of the dffferences in their rnettlod of
formatton.
The Eact that factor analysis fafled to p r o d r ~ c e a composite
response scale with much improved correlations with STC v a l u e s may be
s u b j e c t i v e r e s p o n s e s to traffic n ~ i s e , ~ - ~ T ~ a n d ? subjective ~ ~
responses t o noises caused by n e i g h b o u r s in m l t i - f a m i l y dwellings. Tt
a p p e a r s t h a t traffic n o i s e I s a more homogeneous source of disturbance and many d i f f e r e n t responses related t o a general sense of annoyance t o
t r a f f i c n o i s e , Annoyance w i t h neighbours* n o i s e s d o e s n o t appear to e x h i b i t the same homogeneity. A s discussed in l a t e r sectfons, d i f f e r e n t
t y p e s of noise caused annoyance In different ways. This would explain
why they d l d nnt add together v e r y successfully to form a composite
r e s p o n s e scale. This difference a l s o i n d i c a t e s t h e i m p o r t a n c e of considering each response s e p a r a t e l y t h r o u g h o u t all f u r t h e r a n a l y s e s s i n c e these responses m y r e l a t e q u i t e differently with both a c o u s t i c a l
and nun-aco11s tical predictor v a r i a b l e s .
4 . Physical Variables as Response P r e d i c t o r s
Most of the questionrtatre items designed t o assess the fmpact sf noises from n e i g h b o u r s u s i n g 7-point i n t e r v a l s c a l e responses were form
of dPrect ly e l t c i r e d annoyance. With such q u e s t i o n s t h e r e is a l w a y s t h e
p o s s i b i l i t y t h a t the n a t u r e oE the question is somewhar suggestive and
hence produces a biased, excessively n e g a t i v e response. To v e r i f y t h a t
t h i s was not t h e case, i n i t i a l open-ended q u e s t i o n s were i n c l u d e d to
o b t a i n a measure of s p o n t a n e o u s annoyance to t h e n o i s e o f n e i g h b o u r s . R e s p o n s e variables 009 and 010 l i s t i n g the t h i n g s subjects l i k e d and
d i s l i k e d about t h e i r b u i l d i n g r e s p e c t i v e l y were used to o h t a i n these
s p o n t a n e o u s r e s p o n s e s . The liking of q u i e t n e s s a r the d i s L i k i n g of n o i s e were coded as 2; o t h e r l i k e s or dislikes were coded as 1 and no likes o r dislikes were coded as 0- Cross t a h l a t i o n s were t h e n
performed between t h e s e two response varfables and the STC v a l v e s of the t e s t e d w a l l s w h i c h were grouped into four STC ranges. In b o t h c a s e s a
Chi s q u a r e rest f n d i c a t e d t h a t there was a significant relationship between t h e v a r i a b l e s (p
<
0.02 for varlable 009, a n d p G 0.005 f o rv a r i a b l e 10). In addition, t h e r e s p o n d e n t s ~ a r i s f a c t - t o n u i t h t h e i r
b u i l d t n g was significantly r e l a t e d to s o m measures of sound i n s u l a t i o n ( T a b l e VII]. T h u s the spontaneous respanses tn questions t h a t d i d n o t m e n t l o n nofse were significantly related r o t h e m e a s u r e d STC of each subject's w a l l .
The r e l a t i o n s h f p s between the
major annoyance responses and t h ep h y s - l c a l measures of sound i n s u l a t i o n w e r e f i r s t e v a l u a t e d by P e a r s o n
product-moment carrelations be tween p a i r s of v a r i a b l e s . In T a h l e VII
,
whfch g i v e s t h e c a t r e l a t i o n c o e f f i c i e n t s significant a t p G 0.05 l e v e l
or hLghec f o r seven sfngle-nmnber sound insulation measures, it i s seen
t h a t t h e r e a r e a large number of s i g n i f i c a n ~ c o r r e l a t i o n s despite t h e
small sample 198 s u b j e c t s ) . T h l ~ s , t h i s p i l o t survey has s u c c e s s f u l l y
d e m o n s t r a t e d t h a t s Egnif ic a n t r e l a t i o n s h i p s be tween sound i n s u l a t i o n and
annoyance measures can be obtained. 'She correlations between responses
and STC v a l u e s vary f r o m i n s i g n i f i c a n t to a correlation of -0.335.
Correlations with t h e A-weighted transmission loss STA were slightly higher, reaching a maximum a £ -0,378. In a recent: British s t u d y ,
1,angdonl5 found c o r r e l a t i o n s between s u b j e c t i v e r a t i n g s and sound
s u b j e c t s . Thus, the magnitudes o f the c o r r e l a t i o n s shown in TabLe VII
are very much Ln
l i n e
wirh t h e only o t h e r comparable s t u d y . In b o t h t h epresent p i l o t study and Langdon's s t u d y , the Least emotional response c o r r e l a t e d m o s t h i g h l y w i t h the measured sound insulation.
In
t h ep r e s e n r study this was response variable 0 5 4 , the amount of money
s u b j e c t s were prepared to pay monthly to e l i m i n a t e a n n o y i n g n o i s e s . In
T,angdonls study it was a subjective rating of the existing sound
insulation. Table V I t : i n d i c a t e s t h a t m o s t other annoyance-type
responses correlated wtth STC at about 0.20 o r slightly higher. There
are a l s o a number of q u i t e n o t a b l e excepttons where r e s p o n s e v a r i a b l e s
did not correlate significantly w i t h sound Insulation measures; hence, one m s t assume t h a t the degree of t h e d i s t u r b a n c e is l a r g e l y
independent of t h e sound i n s u l a t i o n of t h e wall. These responses would i n c l u d e : o v e r a l l annoyance w i t h n o i s e s from their neighbours on e i t h e r
side (027), annoyance w i t h speech sounds Ernm their n e i g h b o u r s ' r a d i o o r
r e l e v i s t o n ( 0 3 9 1 , a n n o y a n c e w i t h the sounds of their n e i g h b o u r s '
children ( 0 4
11,
and dayrime annoyance w i t h noises from their n e l g h b o u c so n either s i d e ( 0 4 6 ) . In sonre of t h e s e c a s e s , correlations which were marginally significant n i g h t be increased i n a s t u d y w i t h a l a r g e r number of subjecrs.
P r e l i m i n a r y comparisons of the s u i t a b i l i t y of various s o u n d
i n s u l a t i o n measures can be o b t a i n e d Erom Tabla
VTI,
a l t h o u g h i n g e n e r a l t h e r e are o n l y minute d i E fesences between the correlarions with v a r i ~ 11s sound i n s u l a t i o n measures. The differences between DA a n dDAS
a n dbetween DAN and DANS are so small t h a t the differences between a p i n k
source s p e c t r u m and t h e S c h u l t z source spectrum are clearly unimportant in these data. S i n c e STA and DAN
are
physically very similar, it i s n o t s u r p r i s i n g that T a b l e V I I . shms them t o produce v i r t u a l l y i d e n t i c a l correlations w i t h response measures. There does seem to be a t r e n d , h w e v e r , for t h e A-weighted t r a n s m i s s i o n loss measures, such as STA orDAN, t o produce slightly higher correlations with subjective responses.
The simple A-weighted d i f f e r e n c e i n l e v e l s , DA, produced s l t g h t l y
smaller correlatkons with responses in a l l b u t two c a s e s . For the
q u e s t i o n o n t h e degree of noise p e r c e i v e d by t h e o c c u p a n t i n h i s own home, and the annoyance to sounds of slamming d o o r s , Dh c o r r e l a t e s
slightly mare h f g h l y than do STC or STA. The f i c s t of t h e s e r e s p o n s e s
1s c l e a r l y different in nature from a l l t h e o t h e r s I n that it r a t e s t h e
s u b j e c t ' s own home, The second response (slamming d o o r s ) p r o b a b l y h a s
exaggeraLed c o r r e l a t i o n s . Most s u b j e c t s c o m p l a i n i n g about the n o i s e s of
doors slamming I l v e d i n apartments which tended to have l o w e r STC v a l u e s than t h e other homes. T h u s , the small number of subjects who were
annoyed by d o o r s slamming and who tefided t o live i n a p a r t m e n t s with r e l a t i v e l y low STC v a l u e s could l e a d to somewl~ac misleadingly h i g h
correlations w i t h STC values. A l a r g e r sample o f a p a r t m e n t d w e l l e r s is needed to properly evaluate t h i s response.
Table V I L I gfves correlation coefficients o b t a i n e d between r e s p o n s e
variables and v a r i o u s measures of background n o i s e l e v e l s . Only one response correlated significantly with noise levels measured in the s u b j e c t ' s own h o w ( d e g r e e of n o i s e p e r c e i v e d by o c c u p a n t in his own
home (026). A number a € responses c o r r e l a ~ e d s i g n i r i c a n t l y w i t h t h e d a y t i m e or 24-hour LEO measllred i n t h e neighbour's apartment. mere w a s
a definlte t r e n d s u c h that the r e s p o n s e s n o t correlating significantly
w i t h sound Lnsulation measures d i d c o r r e l a t e s i g n i f i c a n t l y wtth the
n o i s e l e v e l i n the n e i g h b o u r ' s home. These responses i n c l u d e d : general annoyance with n e i g h b o u r s on e i t h e r s i d e (0271, annoyance with n o i s e s of n e i g h b a u r s ' c h i l d r e n (0411, and daytime annoyance with neighbours on e i t h e r side ( 0 4 6 ) . Table VIZI also g i v e s the results of c o r r e l a t i o n s between responses and the difference b e t w e e n the s u b j e c t ' s and t h e neighbour's 24-hour LEQu Although three of the responses d i d correlate s i g n i f i c a n t l y with t h i s n o i s e level difference, t h e s e c o r r e l a t i o n
coefficients nerc always
lower
than t h ecorrelations
with t h e netghbour" 24-hour$
Therefore, t h e r e is no e v i d e n c e t h a t t h e4
"d i f f e r e n c e
in
n o i s e l e v e l s between homes is the principal f a c t o r influencing responses. The n o i s e Level difference is j u s t a n o t h e rv a r i a b l e t h a t is c o r r e l a t e d w i t h t h e neighbour's
hQ2'
( 0 7 4 1 ,CR
= 0.652, p G 0.001). The p r e s e n t d a t a consequently do n o t s u p p o r tt h e idea that noLses i n o n e ' s own home can a c t as masking noise and t h u s lead to reduced annoyance w i t h the n o i s e s of nefghhours.
The d a t a do show t h a t different sounds from neighbours cause annoyance hy quite d i f f e r e n t mechanisms. Some noises seem to be
annoying because the sound f n s u l a t i o n of the party wall is not adequate,
while other sounds are annoying q u i t e independent of the properties of
the w a l l , p r o b a b l y s i m p l y because they c r e a t e high sound l e v e l s I n t h e neighbour' s home. The r e l a t i v e l y high correlation between t h e measured
sound tnsulation values of the party walls and the less emotional, more strictly factual responses concerning t h e number o f dollars per month t h e s u b j e c t s a r e prepared to pay to reduce annoying noise, clearly
i n d i c a t e t h a t s u b j e c t s can judge t h e q u a l i t y of t h e sound Cnsulation of
their wall and are concerned enough t o be w f l l i n g to pay to improve it.
However, when the subjects w e r e a s k e d how annoyed they were because of
t h e i r neighbours' n o i s e s , the sound insulation of the wall w a s not t h e o n l y f a c t o r t h a t influenced their answer. S u b j e c t s apparently took the
quality a £ the wall into account and tended to report g r e a t e r annoyanre w i t h excesstvely n o i s y n e i g h b o u s s , as i n d i c a t e d by the significant c o r r e l a t i o n s between annoyance ( 0 2 7 , 0 4 6 3 , and n o i s e l e v e l s in the
n e i g h b o u r s ' homes.
One Eactor that would have reduced the c o r r e l a t i o n b e t w e e n
annoyance responses and measured noise L e v e l s i n t h e n e i g h b o u r s ' homes
was that probably about 50% of the time the most annnylng nelghbour was n o t measured. Each s u b j e c t u s u a l l y had rwo l m r r r e d i a t e nrelghbours, o n e on either side of h i s home. In t h i s s t u d y , measuremerits w e r e only made in one of the neighbouring homes, s a that one c o u l d expect to pi& the more annoying neighbour i n o n l y about 50% of the cases considered- T h f s is a p a r t l c u l a t l y obvtous problem with regard to annoyance due to noises of neighbours' children. Approximately 62% of t h e homes had c h i l d r e n under 18 years o l d . h some cases, reported annoyance due to c h i l d r e n was
c o r r e l a t e d with t h e measured noise l e v e l s in homes w t t h o u t children. In
in a n e i g h b o u r i n g home
with
c h i l d r e n , who were perhaps n o t as n o i s y a s t h e children i n t h e other neighbauring home.In
spite of this problem, h i g h l y significant c o r r e l a t i o n s were obtained between annoyance due t ot h e sounds of neighbours' chf l d r e n ( 0 4 1 ) and t h e n e i g h b o u r s ' daytime L
value (072). One can probably conclude that t h e mere p r e s e n c e o f Ert
c h i l d r e n I s sufficient to cause annoyance regardless of t h e l e v e l of
noise they create.
As an initial s t e p in considering the p o s s i b t l i r y of improved single-number measures of sound insulation, t h e principal s u b j e c t i v e
r e s p o n s e s were correlated with the measured sound transmission loss i n
each 1 J 3 octave band. The s t a t i s t t c a l l y significant ( p 4 0 - 0 5 )
cnrrelation coefficients that resulted are presented in T a b l e
TX.
A l lt h e responses except one (annoyance due to sounds of neighbours'
c h i l d r e n (041)) were significantly related to the 1/3 o c t a v e
rransmisslon loss values in at least one 1/3 ocrave band. However, most
r e s p o n s e s w e t e slgniftcantly r e l a t e d to the TL v a l u e s in o n l y a small
number af bands. F o r most responses, c o r r e l a t i o n w i t h t h e 1 2 5 Hz and 160 Hz 1 / 3 octave band
Tt
values y i e l d e d the M g h e r , if n o t the h i g h e s t , c o r r e l a t i o n coefftcients. tn f a c t , a l l t h e correlation coefficients between responses and rhe 160 HzTL
values were h i g h e r than f o r those v l t h STC values. The r e s u l t s gZven i n TableIX
appear t o I n d i c a t e t h a t rhe lower 1/3 o c t a v e bands a r e most critical i n d e t e r m f n i n g ther e s u l t i n g disturbance t o residents.
To
better understand the relarionship between t h e p h y s i c a l variables, p r i o r to a t t e m p t i n g to form improved c o m p o s i t e soundi n s u l a t i o n measures, a l l sound insulation measures were c o r r e l a t e d with one another. The c o r r e l a t i o n coefficients a r e g i v e n in Table X , As was
expecred, many oE these measures were very h i g h l y intercorrelated.
Among the s e v e n single-number o v e r a l l s n u n d insulation v a l u e s (STC, N T C ,
STA, M, DAS,
DAN, DAMS)
intercarrelations were very h f g h , r a n g i n g from0.9Q4 to 0.9998. These high c o r r e l a t i o n caeEEicients clearly
demonstrated the very high similarity between STA and DAN values. Tl-le
STC and STA v a l u e s were also very similar w i t h a c o r r e l a ~ i n n coefficient of 0.965, The simple A-weighted level difference, DA, differed t h e most
from STC b u t , even s o , c o r r e l a t e d with STC values wtth a coeEEtcient o f
0.904.
It
is therefore not surprising t h a t the r e s u l t s in Table VIIi n d i c a t e no large differences among these v a r l a b l e s a s p r e d i c t o r s of t h e s u h j ectlve r e s p o n s e s .
The c o r r e l a t i o n s between t h e 1/3 o c t a v e sound transmission l a s s
v a l u e s tended t a decrease as the separation of the frequency
I n c r e a s e d . Correlation coefftcients between adjacent 113 o c t a v e bands were g e n e r a l l y apppraxirnately 0.8 to 0.9, b u t f o r bands separated by one I n t e r m e d i a t e band the i n t e r c o r r e l a t i o n s were g e n e r a l l y 0.7 to 0.8. The lowest correlations between lJ3 octave-band TL values w e r e about t h e
same as t h e highest correlations between s u b j e c t f w e responses and sound
insulation measures. T h i s same t a b l e shws rhat t h e STC v a l u e s c o r r e l a t e d m o s t highly with the 113 octave TL values for 1 / 3 octave
IL
w a s hoped t h a t new cornbLnations of 1/3 o c t a v eTL
v a l u e s could befound t h a t w a u l d c o t r e l a t e more s t r o n g l y w i t h subjective response measures. Tn an attempt to o b t a i n such new measures, multiple regression analyses were performed regressing each response o n t h e
v a r l o u s
113
o c t a v eTL
values.The
order of e n t r y of the 1 / 3 octave TLp r e d i c t o r s i n t o t h e equation was d e t e r m i n e d a c c o r d i n g to. which one
accounted f a r the largest part o f the unexplained variance a t t h a t step.
No s u c c e s s f u l combfnatinn o f even two 1/3 o c t a v e
TL
v a l u e s was found. That i s , i n no case c o u l d even two 1/3 octave v a l u e s be f o u n d t h a twhen taken together, added s i g n i f i c a n t l y to t h e prediction o f a
s u b j e c t i v e response. This is perhaps n o t s u r p r i s i n g i n v i e w of t h e high
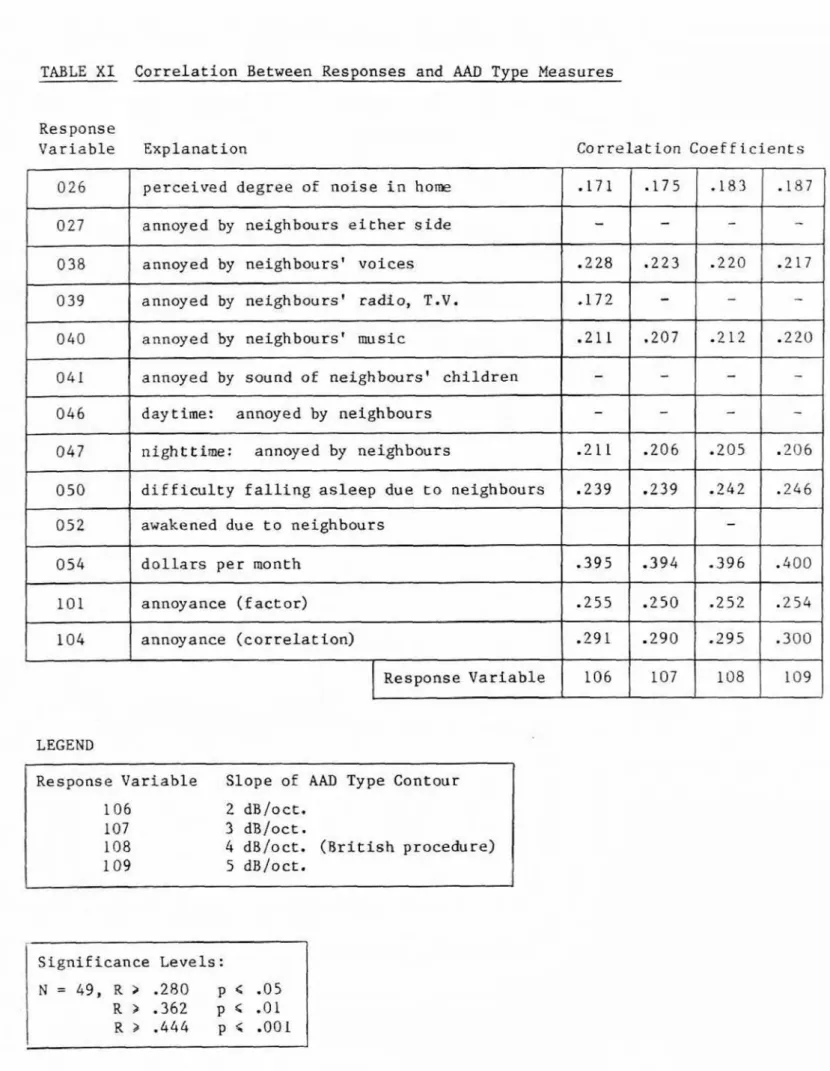
i n t e r c o r r e l a t i o n s b e t w e e n the 113 octave TL v a l u e s g i v e n i n T a b l e X. I n Rrltafn, sound Insulation Ts measured fa term3 of a n A g ~ r e g a t e
Adverse Deviation (AAD) b e l w a reference contour.13 T h l s c o n t o u r is Flat from t h e 1600 Hz t o 3150 Hz 1 / 3 octave b a n d s , w i t h a v a l v e of 56 dR
TL in each 113 o c t a v e band. Relrrw t h i s p l a t e a u t h e contour d r o p s at
4 dB p e r o c t a v e . It was d e s i r e d t o evaluate t h e AAD a s a p r e d i c t o r of s u b j e c t i v e responses. TR addition, t h r e e a t h e r variat tons of the standard AAD were considered in which t h e 4 dB per octave s l o p e was v a r i e d . Slopes of 2, 3 , 4 a n d 5 dl3 p e r o c t a v e were c o n s i d e r e d , The c o r r e l a t i o n s between the resulting
AAD
t y p e measures and t h eresponses are g i v e n in T a b l e
XI.
Varying t h e s l o p e of the r e f e r e n c ec o n t a u s wlthfn the range j u s t m e n t i o n e d had o n l y v e r y minor e f f e c t s on
t h e resulting c o r r e l a t i o n coefficients. By comparing T a b l e X I with
T a b l e V T I , i t is seen t h a t s l i g h t l y h i g h e r c o r r e l a t i o n s w i t h responses
were o b t a i n e d w i t h AAD v a l u e s a s t h e p r e d i c t o r t h a n w i t h STC values. S i n c e both sound i n s u l a t i o n values and background n o i s e l e v e l s were
found to r e l a t e signiEicankly to responses, it was h o p e d tha't: compound
p r e d i c t o r s could be found that included b o t h t y p e s af p h y s i c a l measures. M u l t l p l e regression a n a l y s e s were perEatmed
in
which t h e o r d e r o f e n t r yof the predtctor v a r i a b l e s was predetermined to allow easy comparison
b e tween v a r i o u s combinations of p r e d i c t o r s a n d t h e subjective responses. T h r e e sound insulation measures were c o n s i d e r e d in separate a n a l y s e s :
S T C , S T A and AAD. h e of these sound i n s u l a t i o n measures w a s s h e f i r s t
predictor v a r i a b l e e n t e r e d i n t o the equation, followed by the
neighhour's
LE
2 r and f i n a l l y by t h e subject's$Qzr.
The resulting'1
m u l t t p l e corre a t i o n coefficients a f t e r each step a r e g i v e n i n T a b l e XII. In a number of cases, as noted earlier, the s i m p l e
c o r r e l a t i o n s between t h e sound i n s u l a t i o n measares and t h e response
v a r i a b l e s were n o t signlffcant, and are i n c l u d e d here only to complete
t h e t a b l e . In many cases t h e second term, t h e neighbour's
hq2*,
d i dn o t add significantly to the p r e d i c t i o n ,
In
a l l cases, t h e t h i r d term,t h e s u b j e c r t s own
hnZ4,
d i d n o t add to the prediction of theses u b j e c t f v e responses. T h a t i s , although in some cases s u c c e s s f u l
c o r n h i n a t i o n s of sound insulation measure and neighbour's L~~~~ were
f o u n d , no successful cambinatLons were found t h a t i n c l u d e d the subject's rnrn T 24. The s i m p l e correlations of T a b l e V Z Z I had i m p l i e d t h a t t h e
%Q
sLmpZe difference between the s u b j e c t ' s and the n e i g h b o u r s t $QZ