Monomeric and Dimeric Oxidomolybdenum(V
and VI) Complexes, Cytotoxicity, and DNA
Interaction Studies: Molybdenum Assisted C=N
Bond Cleavage of Salophen Ligands
Sudarshana Majumder,† Sagarika Pasayat,† Alok K. Panda,§ Subhashree P. Dash,†,║ Satabdi Roy,† Ashis Biswas,§ Mokshada E. Varma,┴ Bimba N. Joshi,┴ Eugenio Garribba,¥ Chahat Kausar,ѱ Samir Kumar Patra,ѱ Werner Kaminsky,‡ Aurélien Crochet,£ Rupam Dinda †*
†
Department of Chemistry, National Institute of Technology, Rourkela 769008 Odisha India §
School of Basic Sciences, Indian Institute of Technology Bhubaneswar, Bhubaneswar 751013, Odisha, India
║
Department of Basic Sciences, Paralamaharaja Engineering College, Sitalapalli, Brahmapur, Odisha 761003, India
┴
Bioprospecting Group, Agharkar Research Institute, G.G. Agharkar Road, Pune 411004, India ¥ Dipartimento di Chimica e Farmacia, Università di Sassari, Via Vienna 2, I-07100 Sassari, Italy ѱ
Department of Life Science, National Institute of Technology, Rourkela 769008 Odisha India ‡
Department of Chemistry, University of Washington, Box 351700, Seattle, WA 98195, USA £
Department of Chemistry, Fribourg Center for Nanomaterials, University of Fribourg, CH-1700 Fribourg, Switzerland
S2
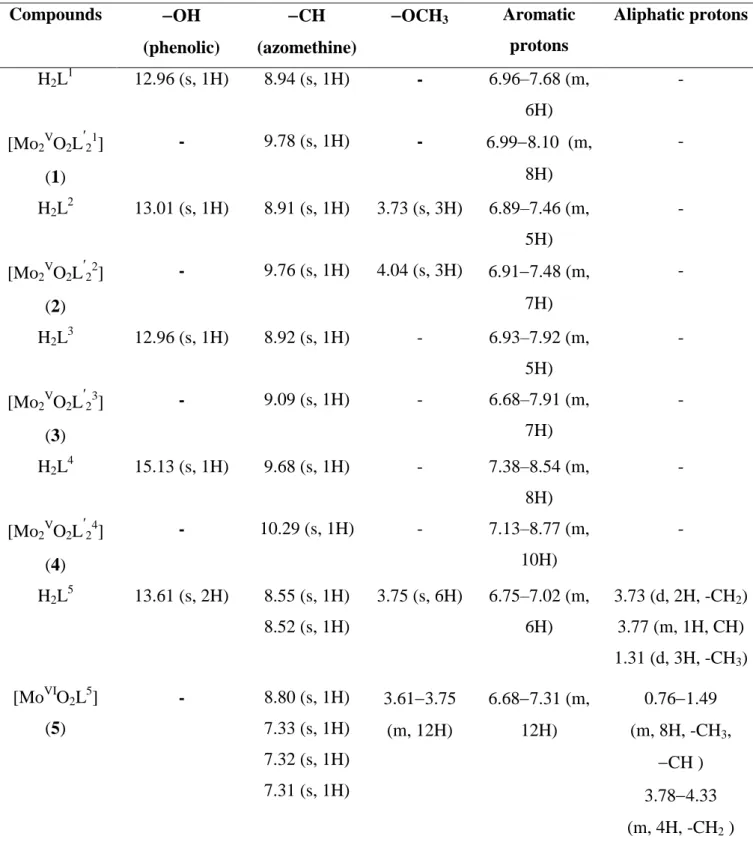
Table S1. 1H NMR (400 MHz, DMSO-d6) chemical shifts (δ in ppm) of H2L1-5 and [Mo2VO2L21-4] (1-4) and [MoVIO2L5] (5) Compounds OH (phenolic) CH (azomethine) OCH3 Aromatic protons Aliphatic protons H2L1 12.96 (s, 1H) 8.94 (s, 1H) - 6.96–7.68 (m, 6H) - [Mo2VO2L ʹ 21] (1) - 9.78 (s, 1H) - 6.998.10 (m, 8H) - H2L2 13.01 (s, 1H) 8.91 (s, 1H) 3.73 (s, 3H) 6.89–7.46 (m, 5H) - [Mo2VO2L ʹ 22] (2) - 9.76 (s, 1H) 4.04 (s, 3H) 6.917.48 (m, 7H) - H2L3 12.96 (s, 1H) 8.92 (s, 1H) - 6.93–7.92 (m, 5H) - [Mo2VO2L ʹ 23] (3) - 9.09 (s, 1H) - 6.68–7.91 (m, 7H) - H2L4 15.13 (s, 1H) 9.68 (s, 1H) - 7.38–8.54 (m, 8H) - [Mo2VO2L ʹ 24] (4) - 10.29 (s, 1H) - 7.13–8.77 (m, 10H) - H2L5 13.61 (s, 2H) 8.55 (s, 1H) 8.52 (s, 1H) 3.75 (s, 6H) 6.75–7.02 (m, 6H) 3.73 (d, 2H, -CH2) 3.77 (m, 1H, CH) 1.31 (d, 3H, -CH3) [MoVIO2L5] (5) - 8.80 (s, 1H) 7.33 (s, 1H) 7.32 (s, 1H) 7.31 (s, 1H) 3.613.75 (m, 12H) 6.687.31 (m, 12H) 0.761.49 (m, 8H, -CH3, CH ) 3.784.33 (m, 4H, -CH2 )
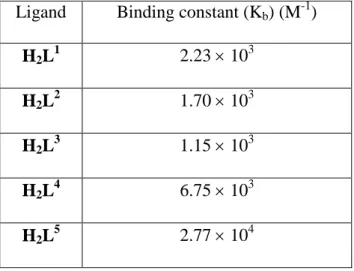
Table S2. Binding constant (Kb) values for the "CT-DNA-ligand" interactions.a
a
The DNA binding constant was determined by the UV-Vis spectral method. Ligand Binding constant (Kb) (M-1)
H2L1 2.23 103
H2L2 1.70 103
H2L3 1.15 103
H2L4 6.75 103
S4
Figure S1. (A) Absorption spectral traces of the complexes 1 (a), 2 (b), 3 (c), 4 (d) and 5 (e) (25
μM each) in 10 mM Tris-HCl buffer (pH 8.0) containing 1% DMF. The spectra were recorded up to 72 h at room temperature 300 375 450 525 600 0.0 0.2 0.4 0.6 300 375 450 525 600 0.0 0.2 0.4 0.6 0.8 300 375 450 525 600 0.0 0.2 0.4 0.6 0.8 300 375 450 525 600 0.0 0.3 0.6 0.9 1.2 300 375 450 525 600 0.0 0.1 0.2 0.3 0.4 a A b so rb an ce ( a. u .) Wavelength (nm) 0 h 12 h 24 h 72 h b A b so rb an ce ( a. u .) Wavelength (nm) 0 h 12 h 24 h 72 h c 0 h 12 h 24 h 72 h A b so rb an ce ( a. u .) Wavelength (nm) d 0 h 12 h 24 h 72 h A b so rb an ce ( a. u .) Wavelength (nm) e A b so rb an ce ( a. u .) Wavelength (nm) 0 h 12 h 24 h 72 h
(B)
Figure S1. (B) 1H NMR spectra of complex 2 in DMSO-d6 after 0 h (a) 1H NMR spectra of complex 2 in DMSO-d6 after 72 h (b) and after heating (120°C) the solution (c).
b c
S6
Figure S1. (C) UV-vis spectra of the complexes (1‒5) (5 µM) [A] in DMSO and [B] in DMSO
and water. 0.0 0.2 0.4 300 400 500 600 0.0 0.1 0.2 300 400 500 600 0.0 0.4 0.8 0.0 0.1 0.2 0.3 0.0 0.4 0.8 0.0 0.1 0.2 0.0 0.5 1.0 0.0 0.1 300 400 500 600 0.0 0.4 0.8 300 400 500 600 0.0 0.1 0.2 0.3
Wavelength / nm
Ab
so
rb
a
n
ce
5
5
4
4
3
3
2
2
1
1
B
A
Figure S2. FTIR spectra of (a): [MoVO(HL4)(OEt)] (Id4) and (b) [Mo2VO2L24] (4). (a)
(b) (a)
S8
Figure S3. Absorbance spectra of (a): [MoVO(HL4)(OEt)] (Id4) and (b): [Mo2VO2L24] (4).
(a) (b) 300 400 500 600 700 800 0 5000 10000 15000 20000 25000 30000 35000 40000 e ( dm 3 m o l-1 c m -1) Wavelength (nm) 486 397 349 279 300 400 500 600 700 800 0 5000 10000 15000 20000 25000 30000 35000 40000 45000 50000 e (d m 3 mo l-1 cm -1 ) Wavelength / nm 607 562 323 519 274
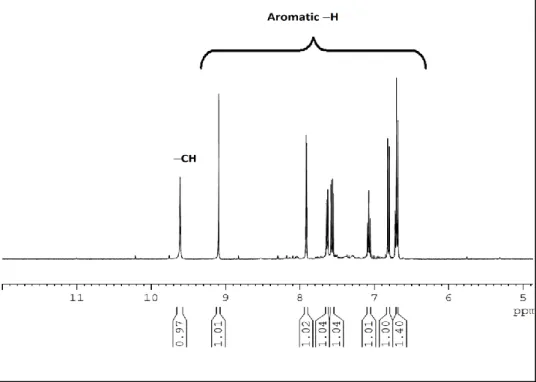
Figure S4. 1HNMR spectra of (a) H2L2 (b) [Mo2VO2L22] (2). N N H O Mo Mo N N H O O O O O N N H H OH HO O O (a) (b) (b)
S10
S12
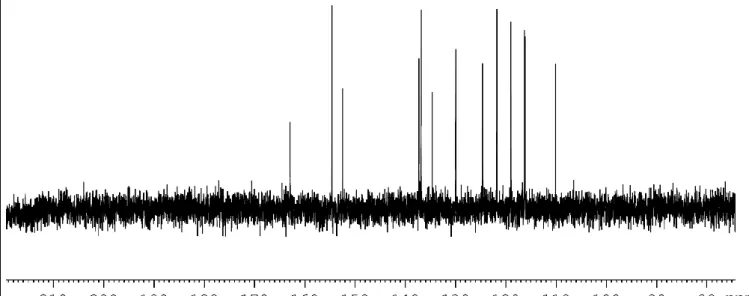
Figure S7. ESI-MS of [Mo2VO2L23] (3).
S14
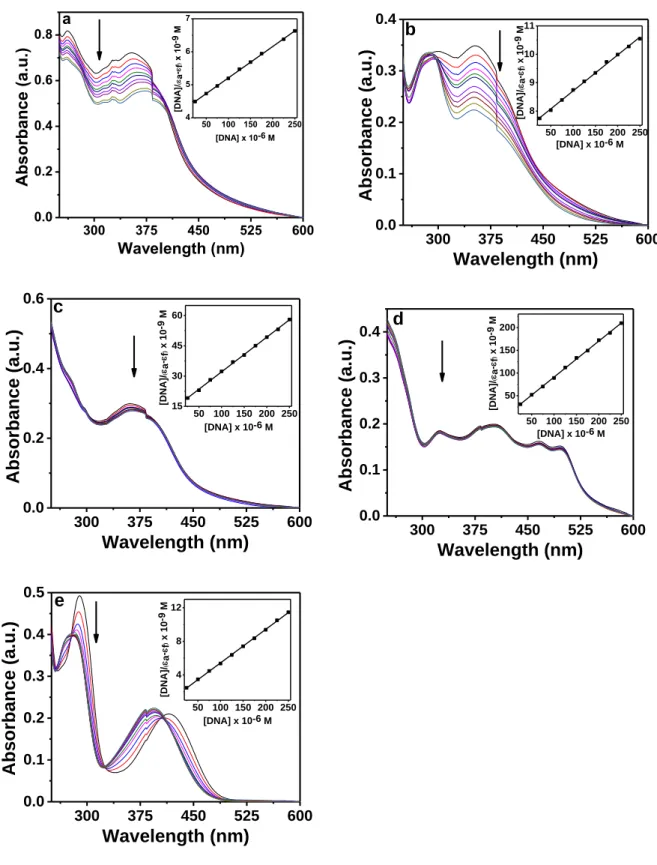
Figure S9. Electronic absorption spectra for H2L1 (a), H2L2 (b), H2L3 (c) H2L4 (d) and H2L5 (e) (25 μM each) upon the titration of CT-DNA (0 – 250 μM) in 10 mM Tris-HCl buffer (pH 8.0) containing 1% DMF. The inset shows the linear fit of [DNA]/(εa - εf) vs [DNA] from which the binding constant (Kb) was calculated using Eq. 1 (see main text).
300 375 450 525 600 0.0 0.2 0.4 0.6 0.8 50 100 150 200 250 4 5 6 7 a Absorbance (a.u .) Wavelength (nm) [D N A ]/ a-f ) x 10 -9 M [DNA] x 10-6 M 300 375 450 525 600 0.0 0.1 0.2 0.3 0.4 50 100 150 200 250 8 9 10 11 b Absorbance (a.u.) Wavelength (nm) [DNA]/ a -f ) x 10 -9 M [DNA] x 10-6 M 300 375 450 525 600 0.0 0.2 0.4 0.6 50 100 150 200 250 15 30 45 60 c Absorbance (a.u.) Wavelength (nm) [DNA]/ a -f ) x 10 -9 M [DNA] x 10-6 M 300 375 450 525 600 0.0 0.1 0.2 0.3 0.4 50 100 150 200 250 50 100 150 200 d Absorbance (a.u.) Wavelength (nm) [DNA]/ a -f ) x 10 -9 M [DNA] x 10-6 M 300 375 450 525 600 0.0 0.1 0.2 0.3 0.4 0.5 50 100 150 200 250 4 8 12 e Absorbance (a.u.) Wavelength (nm) [DNA]/ a -f ) x 10 -9 M [DNA] x 10-6 M
240
280
320
360
400
-8
-4
0
4
8
Elli
pticity (mDeg)
Wavelength (nm)
CT-DNA
1
2
3
4
5
Figure S10. Circular dichroism spectra of CT-DNA (100 μM) in the presence and absence of
complexes 15 (25 µM each). The experiment was done in 10 mM Tris-HCl buffer (pH 8.0)
S16
Figure S11. Gel diagram showing concentration dependent DNA cleavage by 1–5; 300 ng of SC
pUC19 DNA at different concentrations of the complexes [1–100 µM in 50 mM Tris-HCl buffer (pH 8.0) containing 1% DMF] was photo-irradiated with UVA at 350 nm for 3 h. Lanes 1–8: 1, 2.5, 5.0, 7.5, 10, 50, 75, and 100 µM of 1–5.
Figure S12. Gel diagram showing the effect of DMF (1%) and ligands on the photo-induced
cleavage of SC pUC19 DNA. 300 ng SC pUC19 DNA was photo-irradiated in absence and presence of 1% DMF and various ligands (50 μM) with UVA at 350 nm for 3 h. Lane 1, DNA only; Lane 2, DNA in presence of 1% DMF; Lane 3, DNA + H2L1; Lane 4, DNA + H2L2; Lane 5, DNA + H2L3; Lane 6, DNA + H2L4; Lane 7, DNA + H2L5.
S18
0
25
50
75
100
1
2
3
4
5
Net DNA Cleav
age (%)
Control
Azide
L-His
KI
Mannitol
Figure S13. DNA cleavage of SC pUC19 DNA by 1–5 in presence of various additives in 50 mM
Tris-HCl buffer (pH 8.0) containing 1% DMF. SC pUC19 DNA (300 ng) in the presence of various additives was photo-irradiated with UVA at 350 nm for 3 h in presence of 1–5 (50 µM). The additive concentrations were: sodium azide (0.5 mM), L-histidine (0.5 mM), KI (0.5 mM) and D-mannitol (0.5 mM).
Figure S14. Gel diagram depicting cleavage of SC pUC19 DNA by 1–5 in presence of various
additives in 50 mM Tris-HCl buffer (pH 8.0) containing 1% DMF. SC pUC19 DNA (300 ng) in the presence of various additives was photo-irradiated at 350 nm for 3 h with 1–5 (50 µM). The additive concentrations were: sodium azide (0.5 mM), L-histidine (0.5 mM), KI (0.5 mM) and D-mannitol (0.5 mM). Lane 1, DNA + complex; Lane 2, DNA + complex + sodium azide; Lane 3, DNA + complex + Lhistidine; Lane 4, DNA + complex + KI; Lane 5, DNA + complex + D -mannitol.
S20
Figure S15. Effect of 1–5 on cell viability and growth: HaCaT cells were treated with different
concentrations of the test compound for 48 h and then cell viability was measured by MTT assay. Data reported as the mean ± SD for n=3.
0 50 100 % Ce ll vi abi lity Metal Complexes 5 µM 10 µM 25 µM 50 µM
(a) (b)
S22
(a) 5 µM 10 µM 25 µM 50 µM
(b)
Figure S16 (B). Effect of treatment of complexes on the nuclear morphology of MCF-7 cells. The
morphological changes in nuclei of MCF-7 cells from control and treated groups were washed twice with PBS (pH 7.4) and fixed after incubation for 15 min with 3.7 % of formaldehyde. The cells were then washed twice with PBS and treated with 0.2% triton-X 100 in PBS for 30 seconds. Further the cells were washed twice with PBS and PI solution (10 µg/mL) was added and kept for 15 min in dark. Finally, the cells were washed twice with PBS and imaged under fluorescence microscope (FLoid, Life technologies). Arrows indicate the morphological changes in nuclei of MCF–7 cells observed on applying increasing concentrations (5, 10, 25 and 50 µM) of 1 in comparison to control. The scale bar corresponds to 100 μm.
(a) 5 µM 10 µM 25 µM 50 µM
(b)
Figure S16 (C). Effect of treatment of complexes on the nuclear morphology of MCF-7 cells. The
morphological changes in nuclei of MCF-7 cells from control and treated groups were washed twice with PBS (pH 7.4) and fixed after incubation for 15 min with 3.7 % of formaldehyde. The cells were then washed twice with PBS and treated with 0.2% triton-X 100 in PBS for 30 seconds. Further the cells were washed twice with PBS and PI solution (10 µg/mL) was added and kept for 15 min in dark. Finally, the cells were washed twice with PBS and imaged under fluorescence microscope (FLoid, Life technologies). Arrows indicate the morphological changes in nuclei of MCF–7 cells observed on applying increasing concentrations (5, 10, 25 and 50 µM) of 3 in comparison to control. The scale bar corresponds to 100 μm.
S24
(a) 5 µM 10 µM 25 µM 50 µM
(b)
Figure S16 (D). Effect of treatment of complexes on the nuclear morphology of MCF-7 cells. The
morphological changes in nuclei of MCF-7 cells from control and treated groups were washed twice with PBS (pH 7.4) and fixed after incubation for 15 min with 3.7 % of formaldehyde. The cells were then washed twice with PBS and treated with 0.2% triton-X 100 in PBS for 30 seconds. Further the cells were washed twice with PBS and PI solution (10 µg/mL) was added and kept for 15 min in dark. Finally, the cells were washed twice with PBS and imaged under fluorescence microscope (FLoid, Life technologies). Arrows indicate the morphological changes in nuclei of MCF–7 cells observed on applying increasing concentrations (5, 10, 25 and 50 µM) of 4 in comparison to control. The scale bar corresponds to 100 μm.
(a) 5 µM 10 µM 25 µM 50 µM
(b)
Figure S16 (E). Effect of treatment of complexes on the nuclear morphology of MCF-7 cells. The
morphological changes in nuclei of MCF-7 cells from control and treated groups were washed twice with PBS (pH 7.4) and fixed after incubation for 15 min with 3.7 % of formaldehyde. The cells were then washed twice with PBS and treated with 0.2% triton-X 100 in PBS for 30 seconds. Further the cells were washed twice with PBS and PI solution (10 µg/mL) was added and kept for 15 min in dark. Finally, the cells were washed twice with PBS and imaged under fluorescence microscope (FLoid, Life technologies). Arrows indicate the morphological changes in nuclei of MCF–7 cells observed on applying increasing concentrations (5, 10, 25 and 50 µM) of 5 in comparison to control. The scale bar corresponds to 100 μm.
S26
(a) (b)
5µM 10µM 25µM 50 µM (a)
A)
(b)
Figure S17 (B). Effect of treatment of complexes on the nuclear morphology of HCT-15 cells.
The morphological changes in nuclei of HCT-15 cells from control and treated groups were washed twice with PBS (pH 7.4) and fixed after incubation for 15 min with 3.7 % of formaldehyde. The cells were then washed twice with PBS and treated with 0.2% triton-X 100 in PBS for 30 seconds. Further the cells were washed twice with PBS and PI solution (10 µg/mL) was added and kept for 15 min in dark. Finally, the cells were washed twice with PBS and imaged under fluorescence microscope (Olympus IX 70). Arrows indicate the morphological changes in nuclei of HCT-15 cells observed on applying increasing concentrations (5, 10, 25 and 50 µM) of 1 in comparison to control. The scale bar corresponds to 50 μm.
S28
5µM 10µM 25µM 50 µM (a)
(b)
Figure S17 (C). Effect of treatment of complexes on the nuclear morphology of HCT-15 cells.
The morphological changes in nuclei of HCT-15 cells from control and treated groups were washed twice with PBS (pH 7.4) and fixed after incubation for 15 min with 3.7 % of formaldehyde. The cells were then washed twice with PBS and treated with 0.2% triton-X 100 in PBS for 30 seconds. Further the cells were washed twice with PBS and PI solution (10 µg/mL) was added and kept for 15 min in dark. Finally, the cells were washed twice with PBS and imaged under fluorescence microscope (Olympus IX 70). Arrows indicate the morphological changes in nuclei of HCT-15 cells observed on applying increasing concentrations (5, 10, 25 and 50 µM) of 3 in comparison to control. The scale bar corresponds to 50 μm.
5µM 10µM 25µM 50 µM (a)
(b)
Figure S17 (D). Effect of treatment of complexes on the nuclear morphology of HCT-15 cells.
The morphological changes in nuclei of HCT-15 cells from control and treated groups were washed twice with PBS (pH 7.4) and fixed after incubation for 15 min with 3.7 % of formaldehyde. The cells were then washed twice with PBS and treated with 0.2% triton-X 100 in PBS for 30 seconds. Further the cells were washed twice with PBS and PI solution (10 µg/mL) was added and kept for 15 min in dark. Finally, the cells were washed twice with PBS and imaged under fluorescence microscope (Olympus IX 70). Arrows indicate the morphological changes in nuclei of HCT-15 cells observed on applying increasing concentrations (5, 10, 25 and 50 µM) of 4 in comparison to control. The scale bar corresponds to 50 μm.
S30
5µM 10µM 25µM 50 µM
Figure S17 (E). Effect of treatment of complexes on the nuclear morphology of HCT-15 cells.
The morphological changes in nuclei of HCT-15 cells from control and treated groups were washed twice with PBS (pH 7.4) and fixed after incubation for 15 min with 3.7 % of formaldehyde. The cells were then washed twice with PBS and treated with 0.2% triton-X 100 in PBS for 30 seconds. Further the cells were washed twice with PBS and PI solution (10 µg/mL) was added and kept for 15 min in dark. Finally, the cells were washed twice with PBS and imaged under fluorescence microscope (Olympus IX 70). Arrows indicate the morphological changes in nuclei of HCT-15 cells observed on applying increasing concentrations (5, 10, 25 and 50 µM) of 5 in comparison to control. The scale bar corresponds to 50 μm.
![Figure S1. (C) UV-vis spectra of the complexes (1‒5) (5 µM) [A] in DMSO and [B] in DMSO and water](https://thumb-eu.123doks.com/thumbv2/123doknet/14883241.645487/6.892.171.778.115.806/figure-uv-vis-spectra-complexes-dmso-dmso-water.webp)
![Figure S2. FTIR spectra of (a): [Mo V O(HL 4 )(OEt)] (I d 4 ) and (b) [Mo 2 V O 2 L 2 4 ] (4)](https://thumb-eu.123doks.com/thumbv2/123doknet/14883241.645487/7.892.81.733.164.869/figure-s-ftir-spectra-mo-hl-oet-mo.webp)
![Figure S3. Absorbance spectra of (a): [Mo V O(HL 4 )(OEt)] (I d 4](https://thumb-eu.123doks.com/thumbv2/123doknet/14883241.645487/8.892.97.791.115.394/figure-s-absorbance-spectra-mo-v-hl-oet.webp)
![Figure S4. 1 HNMR spectra of (a) H 2 L 2 (b) [Mo 2 V O 2 L 2 2 ] (2).](https://thumb-eu.123doks.com/thumbv2/123doknet/14883241.645487/9.892.94.780.141.514/figure-s-hnmr-spectra-h-l-mo-v.webp)
![Figure S8. Cyclic voltammogram (anodic region) of [Mo V O(HL 4 )(OEt)] (I d 4 ).](https://thumb-eu.123doks.com/thumbv2/123doknet/14883241.645487/13.892.240.689.114.482/figure-cyclic-voltammogram-anodic-region-mo-hl-oet.webp)