DIAGNOSIS AND ASSESSMENT
Paradoxical Changes in Alcohol Consumption and CAGE Ratings Between 1996 and 2006 in the
General Population of Geneva
Jean-François Etter1,* and Gerhard Gmel2,3,4,5
1Institute of Social and Preventive Medicine, University of Geneva, CMU, case postale, CH-1211 Geneva 4, Switzerland,2Alcohol Treatment Centre, Lausanne University Hospital, Lausanne, Switzerland,3Swiss Institute for the Prevention of Alcohol and Drug Problems, Lausanne, Switzerland,4Centre for
Addiction and Mental Health, Toronto, ON, Canada and5University of the West of England, Frenchay Campus, Bristol, UK *Corresponding author. Tel.: +41-22-379-04-59; Fax: +41-22-379-04-52; E-mail: [email protected]
(Received 9 August 2010; in revised form 20 December 2010; accepted 29 December 2010)
Abstract — Aims: To assess changes between 1996 and 2006 in alcohol use and dependence in the general population of Geneva, Switzerland. Methods: Postal surveys of alcohol consumption patterns in representative samples of the general population were com-pared. The four-item CAGE (Cut down, Annoyed, Guilty, Eye-opener) screener was used to estimate alcohol dependence. Results: There were 742 participants in 1996 (response rate 75%) and 1487 in 2006 (76%). The proportions of daily drinkers (1996: 18%; 2006: 10%; P < 0.001), and of heavy drinkers (>14 drinks/week) decreased between 1996 (13%) and 2006 (7%; P < 0.001). However, decreases in heavy drinking were limited to men aged 30+ and women aged 30–49. The average number of drinks/week decreased from 6.4 in 1996 to 5.0 in 2006 (P < 0.001). Perception of safe drinking levels decreased between 1996 (4 drinks/day) and 2006 (3 drinks/day, P < 0.001). The prevalence of alcohol dependence, defined as a CAGE score ≥2, increased among women (1996: 6%; 2006: 14%; P = 0.001), but not among men (1996: 18%, 2006: 19%). Two of the CAGE items were endorsed more fre-quently by women in 2006 than in 1996:‘guilty’ (1996: 9%; 2006: 15%; P = 0.018) and ‘should cut down’ (1996: 12%; 2006: 18%; P = 0.04). Drinking and driving did not change significantly over time (2006: 21% of men, 9% of women). Conclusion: Alcohol consumption, heavy drinking and perceived levels of safe drinking decreased over these 10 years, but not drink driving or alcohol dependence. Paradoxically, alcohol dependence even increased among women, driven by CAGE items‘guilty’ and ‘should cut down’, suggesting that changes in CAGE scores reflected changes in the social acceptability of drinking rather than changes in dependence.
INTRODUCTION
Alcohol abuse and dependence are major factors of mor-tality, morbidity, disability and social problems in both high-and low-income countries (Mokdad et al., 2004). They impose an enormous cost not only on those directly affected, but also on their families, employers, co-workers and the society (Grant, 2000). The social cost of alcohol abuse is 6.7 billion Swiss Francs in Switzerland (Priez et al., 2005), which corresponds to 930 Swiss Francs for every inhabitant, compared with a gross domestic product of 64,907 Swiss Francs per capita in 2006 (FSO, 2010). This burden is, however, partly preventable by the implementation of effec-tive interventions, in particular, by structural interventions such as tax and price increases, by restrictions on access and availability and by early clinical interventions and effective treatments (Rehm et al., 2006;Wagenaar et al., 2009).
To inform policy, prevention programmes and treatment services, there is a need for up-to-date data on trends in alcohol consumption, dependence and alcohol-related pro-blems. Sales data are available but are not informative about trends in population subgroups (defined by age, sex, edu-cation, alcohol consumption level, co-morbidity, etc.). Survey data are necessary, and are available mainly through the Swiss Health Survey, conducted every 5 years since 1992 (Annaheim and Gmel, 2004; Chiolero et al., 2006;
Rehm et al., 2007). These data show that alcohol use has been decreasing for decades among both men and women, but recently ceased to decrease among women. However, little has been published on concurrent trends in alcohol-related consequences or alcohol dependence, which could be assumed to decrease similarly. However, discrepancies between alcohol consumption, alcohol-related consequences
and alcohol dependence have been reported in general popu-lation surveys (Grant et al., 2004; Messiah et al., 2008;
Midanik and Clark, 1995). To inform local policymakers and prevention organizations, we wanted to describe the situ-ation in Geneva specifically.
Thus, the aim of this study was to assess changes between 1996 and 2006 in alcohol consumption, drinking and driving and alcohol dependence in the general population of the urban canton Geneva, Switzerland.
METHODS Data collection
We conducted two mail surveys, the first one in 1996 and the second one in 2006, in cross-sectional, representative samples of the general population of Geneva, Switzerland. The intended samples included 1000 people in 1996 and 2000 people in 2006, aged 18–70. The samples were drawn at random from the publicly available part of the population register, which includes 86% of the population and excludes the personnel of the United Nations and other international organizations, diplomats, elected politicians and all people who asked not to be listed. This register lists individuals (not households), and we used a simple random sampling method. Up to six reminder questionnaires were sent to non-respondents.
Questionnaire content
The questionnaires covered tobacco, cannabis and alcohol use, opinions about prevention measures and socio-demographic characteristics, and took ~10 min to complete
Alcohol and Alcoholism Vol. 46, No. 2, pp. 128–132, 2011 doi: 10.1093/alcalc/agq102
Advance Access Publication 23 January 2011
(Etter, 2009a,b;2010). In 1996 and 2006, participants indi-cated whether they drank alcohol in the previous 12 months (frequency, six response options, Table1) and the number of alcohol drinks on the days when they drank. Participants answered the CAGE (Cut down, Annoyed, Guilty, Eye-opener) test, a four-item screener for alcohol dependence (Ewing, 1984;Mayfield et al., 1974). Participants also indi-cated how many glasses per day, in their opinion, rep-resented dangerous alcohol consumption; and the number of times, in the past 12 months, they had driven a motor vehicle while feeling they had drunk too much.
Analyses
All 1996–2006 comparisons were adjusted for age, sex and school years in multiple linear regression models, with all dichotomous variables coded 0–1. Coefficients of linear regression models were used to compute differences between survey waves (1996–2006) and associated P-values after adjustment for covariates. We used the SPSS 16 software (SPSS Inc., Chicago, IL, USA).
RESULTS Participation
We collected 742 questionnaires in 1996 (75% of 987 valid addresses) and 1487 in 2006 (76% of 1945 valid addresses). The average age of participants was 42.3 years in 1996 and 41.0 years in 2006 (P = 0.015), the proportion of men was 48% in 1996 and 55% in 2006 (P < 0.001) and the average number of school years was 13.4 in 1996 and 15.3 in 2006 (P < 0.001).
Alcohol consumption
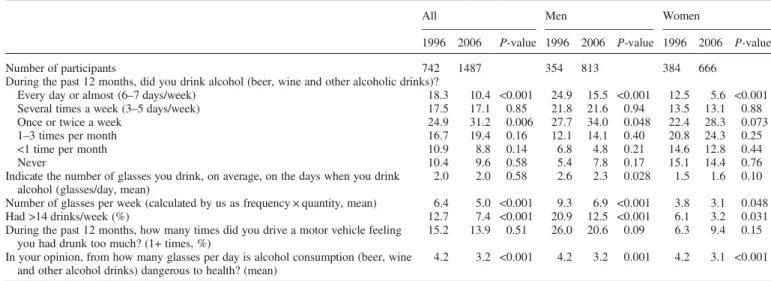
Fewer people (both men and women) drank alcohol daily in 2006 than in 1996 (Table 1). Between 1996 and 2006, the average number of alcohol drinks per week decreased in both men and women, and the number of people who drank over 14 glasses of alcohol per week decreased by almost half
in both men and women (Table 2). Decreases in heavy drinking (>14 drinks/week) were limited to men aged 30 years and older and to women aged 30–49 years (Table 2). The mean consumption, on the days when people drank, decreased in men (by an average of 0.3 glasses/day), but remained stable in women (1.5 glasses/day in 1996, 1.6 glasses/day in 2006; P = 0.10). In 2006, 16% of participants drank half (54%) of all the alcohol consumed by the whole sample, and half (55%) of the participants drank almost all (94%) the alcohol consumed by the whole sample. In 2006, one in every five men and one in every ten women admitted to at least one episode of drinking too much and driving in the previous year, without a statistically significant change between 1996 and 2006 (Table1).
Opinions
About one-third of participants (1996: 30%; 2006: 32%; P = 0.40) found it difficult to decline an alcohol drink when offered one. In 2006, answers to this question were similar in men and women and across income groups. Finally, the level of alcohol consumption that participants considered to be dangerous to health decreased from 4.2 drinks/day in 1996 to 3.2 drinks/day in 2006 (P < 0.001), and this decrease was observed in both men and women (Table1).
CAGE test
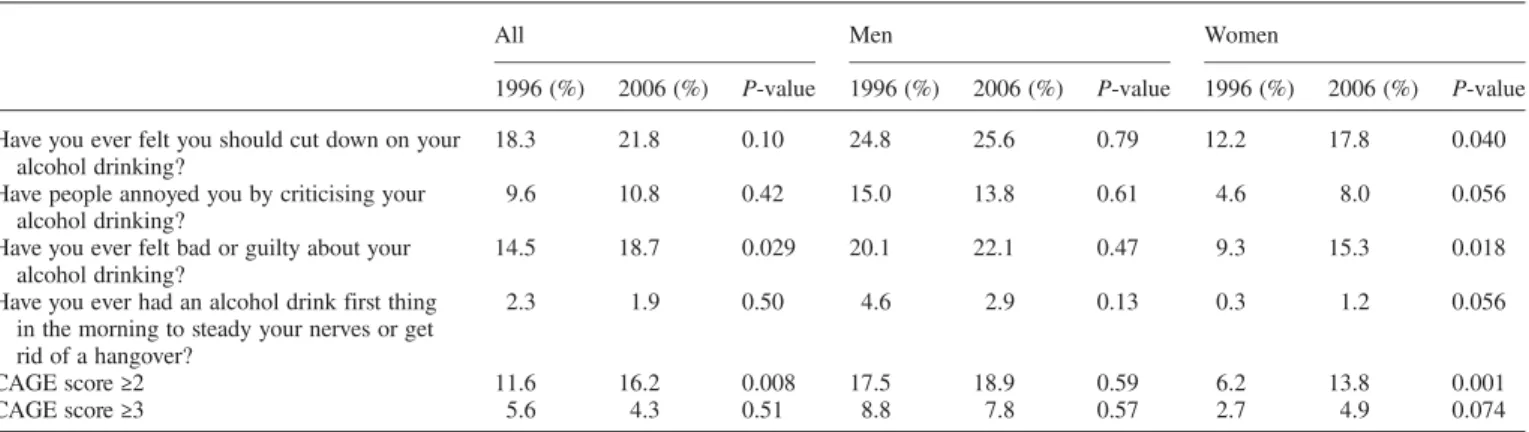
Between 1996 and 2006, there was an increase (from 11.6 to 16.2%; P = 0.008) in the proportion of participants respond-ing affirmatively to at least two questions of the CAGE test, a level suggesting the presence of alcohol dependence (Mayfield et al., 1974). CAGE scores did not change in men, and this increase was observed only in women, in whom the prevalence of CAGE ≥2 more than doubled, from 6.2% in 1996 to 13.8% in 2006 (P = 0.001). In particular, in women, the items ‘felt guilty’ and ‘felt you should cut down’ were endorsed more frequently in 2006 than in 1996 (Table 3). Endorsement of the‘eyes opener’ item was rare in both men and women. In women, the increase over time in the preva-lence of CAGE≥2 was largest in women in the lower levels
Table 1. Alcohol consumption and drink driving in men and women, Geneva, 1996–2006
All Men Women
1996 2006 P-value 1996 2006 P-value 1996 2006 P-value
Number of participants 742 1487 354 813 384 666
During the past 12 months, did you drink alcohol (beer, wine and other alcoholic drinks)?
Every day or almost (6–7 days/week) 18.3 10.4 <0.001 24.9 15.5 <0.001 12.5 5.6 <0.001 Several times a week (3–5 days/week) 17.5 17.1 0.85 21.8 21.6 0.94 13.5 13.1 0.88 Once or twice a week 24.9 31.2 0.006 27.7 34.0 0.048 22.4 28.3 0.073 1–3 times per month 16.7 19.4 0.16 12.1 14.1 0.40 20.8 24.3 0.25 <1 time per month 10.9 8.8 0.14 6.8 4.8 0.21 14.6 12.8 0.44
Never 10.4 9.6 0.58 5.4 7.8 0.17 15.1 14.4 0.76
Indicate the number of glasses you drink, on average, on the days when you drink alcohol (glasses/day, mean)
2.0 2.0 0.58 2.6 2.3 0.028 1.5 1.6 0.10 Number of glasses per week (calculated by us as frequency × quantity, mean) 6.4 5.0 <0.001 9.3 6.9 <0.001 3.8 3.1 0.048 Had >14 drinks/week (%) 12.7 7.4 <0.001 20.9 12.5 <0.001 6.1 3.2 0.031 During the past 12 months, how many times did you drive a motor vehicle feeling
you had drunk too much? (1+ times, %)
15.2 13.9 0.51 26.0 20.6 0.09 6.3 9.4 0.15 In your opinion, from how many glasses per day is alcohol consumption (beer, wine
and other alcohol drinks) dangerous to health? (mean)
4.2 3.2 <0.001 4.2 3.2 0.001 4.2 3.1 <0.001
of income and education (in women with ≤12 school years (lowest quartile): CAGE ≥2 in 1996: 5.3%; 2006: 13.4%; P = 0.009). Richer and more educated women scored equally high on the CAGE test in 1996 and 2006 (in women with 18+ school years (highest quartile): CAGE≥2 in 1996: 12.1%; 2006: 14.3%; P = 0.69).
Endorsement of the CAGE items ‘guilty’ and ‘should cut down’ increased over time in moderate drinkers only (≤14 drinks/week; ‘guilty’: 1996: 10%; 2006: 17%; P = 0.001; ‘cut down’: 1996: 13%; 2006: 20%; P = 0.002). Endorsement of all CAGE items remained unchanged in heavy drinkers (>14 drinks/week; e.g. ‘guilty’: 1996: 42%; 2006: 41%; P = 0.9; ‘cut down’: 1996: 46%; 2006: 45%; P = 0.8). By age group, the only statistically significant change in CAGE items was observed for the item‘annoyed’ in the 18–29 year olds (1996: 10%; 2006: 18%; P = 0.043).
DISCUSSION
Between 1996 and 2006, in a representative sample of the urban Swiss canton of Geneva, we observed a decrease in the proportion of people who drank alcohol daily, a decrease in the number of alcohol drinks per week, an almost two-fold decrease in the proportion of people who drank >14 drinks per week, and a decrease in the amount of drink-ing that people thought was dangerous to health. These changes were observed in both men and women, and they occurred in spite of a decrease in taxes and prices of imported alcoholic drinks that took place in 1999 (Heeb and Gmel, 2003). However, no reduction in heavy drinking was observed in the 18–29 year olds, and in women, reductions
in heavy drinking were limited to the 30–49 year olds. This suggests that interventions targeted at young adults and at the 50+ year olds, who drink the most, should be intensified. Furthermore, drink driving remained frequent, and did not change between 1996 and 2006, in spite of the decrease in alcohol consumption. This suggests that additional efforts should be taken to tackle this important public health problem.
This overall decrease in alcohol consumption and heavy drinking is in agreement with other survey data from Switzerland (Annaheim and Gmel, 2004), and with sales
data (Eidgenössische Alkoholverwaltung, 2009).
Surprisingly, this decrease in alcohol use and heavy drinking was not mirrored by a parallel decrease in dependence ratings as measured by the CAGE screening test. Paradoxical trends between alcohol consumption and a diagnostic of alcohol dependence have also been found in general popu-lation surveys in the USA and in France (Grant et al., 2004;
Messiah et al., 2008;Midanik and Clark, 1995). One poss-ible interpretation is that when alcohol use decreases, the threshold of what is perceived as acceptable consumption changes in parallel, and levels of consumption that were pre-viously seen as acceptable are then perceived as problematic. Alternatively, the social acceptability of drinking may have changed first, followed by a decrease in consumption. The cross-sectional nature of our data does not enable us to dis-entangle these alternative interpretations. In support of these hypotheses, we found that endorsement increased only for the CAGE items that reflect social pressure or social accept-ability (‘guilty’ and ‘should cut down’). On the other hand, endorsement of the ‘eye opener’ item, an item that most closely addresses a symptom of dependence, remained
Table 3. CAGE test, change 1996–2006 in men and women in Geneva
All Men Women
1996 (%) 2006 (%) P-value 1996 (%) 2006 (%) P-value 1996 (%) 2006 (%) P-value Have you ever felt you should cut down on your
alcohol drinking?
18.3 21.8 0.10 24.8 25.6 0.79 12.2 17.8 0.040 Have people annoyed you by criticising your
alcohol drinking?
9.6 10.8 0.42 15.0 13.8 0.61 4.6 8.0 0.056 Have you ever felt bad or guilty about your
alcohol drinking?
14.5 18.7 0.029 20.1 22.1 0.47 9.3 15.3 0.018 Have you ever had an alcohol drink first thing
in the morning to steady your nerves or get rid of a hangover?
2.3 1.9 0.50 4.6 2.9 0.13 0.3 1.2 0.056
CAGE score≥2 11.6 16.2 0.008 17.5 18.9 0.59 6.2 13.8 0.001
CAGE score≥3 5.6 4.3 0.51 8.8 7.8 0.57 2.7 4.9 0.074
All 1996–2006 comparisons were adjusted for age and school years and, in column ‘all’, also for sex.
Table 2. Consumption of >14 drinks per week, men and women, Geneva, 1996 and 2006
All Men Women
1996 (%) 2006 (%) P-value 1996 (%) 2006 (%) P-value 1996 (%) 2006 (%) P-value Age
18–29 6.2 4.6 0.55 11.3 7.8 0.52 2.4 2.3 0.98
30–49 13.4 6.9 <0.001 20.5 12.5 0.007 6.4 0.8 0.001
50+ 17.1 11.7 0.10 27.0 15.8 0.030 8.1 7.5 0.88
All 12.7 7.4 <0.001 20.9 12.5 <0.001 6.1 3.2 0.031
stable, suggesting that in fact alcohol dependence did not increase (but very few respondents endorsed this item). This interpretation is corroborated by the decrease in rates of daily drinking and heavy drinking (>14 drinks/week). Interestingly, the increase in the CAGE items reflecting social pressure (‘guilty’ and ‘should cut down’) were observed in women and in moderate drinkers only. These results are in agreement with data from France (Messiah et al., 2008), and suggest that social norms about drinking for women have changed recently in both France and French-speaking Switzerland, possibly as a result of preven-tion campaigns. The perceived threshold for dangerous alcohol consumption decreased from four to three daily drinks between 1996 and 2006, which also supports the interpretation that the awareness of alcohol risks has changed over time in this population.
These paradoxical results suggest that the CAGE reflects social intolerance to heavy drinking rather than problem drinking, and that it may not be an optimal tool to assess alcohol dependence in the general population (Bisson et al., 1999; Bloomfield et al., 2002). Although the CAGE has been shown to be a reliable and valid screener in clinical populations, its diagnostic and screening value in general population surveys has been criticized, because in this context, the CAGE may not be a specific measure of depen-dence, but may also reflect social intolerance to heavy use (Bisson et al., 1999; Buhler et al., 2004; Koppes et al., 2004). However, this problem may not be specific to the CAGE, as several other questionnaires assessing alcohol dependence or abuse also include items that may be affected by social norms. For example, surveys in US national samples showed that even though alcohol use decreased over time, self-reports of dependence symptoms and social conse-quences increased (Midanik and Clark, 1995). Another US study, based on the Alcohol Use Disorder and Associated Disabilities Interview Schedule, showed that alcohol abuse increased over 10 years, while alcohol use and dependence declined (Grant et al., 2004). These findings suggest that self-reports of alcohol abuse and social consequences are influenced more by changing social norms than by actual alcohol-related problems. Almost all screening instruments contain items covering concerns by others, guilt about drink-ing or attempts to cut down (e.g. the Alcohol Use Disorder Identification Test; Bush et al., 1998). Thus, instruments used for the diagnosis of alcohol use disorders may produce paradoxical results due to changing social norms, and preva-lence data based on surveys in the general population using these instruments should, therefore, be interpreted with caution. In addition, the CAGE is a screening test, not a diagnosis test. Ideally, people screened positive should be assessed more thoroughly, which is however impractical in population-based studies.
Study limitations
A first limitation is that even though the response rates were relatively high for mail surveys in the general population (Asch et al., 1997), one quarter of the intended sample did not return the questionnaires. The existence and direction of a possible non-response bias are difficult to establish (Etter and Perneger, 1997). A second limitation is that most ques-tionnaire items were developed for this survey and have not
been validated. Third, questionnaire surveys may underesti-mate alcohol consumption, compared with sales data (Midanik, 1988). Finally, analyses were adjusted for potential confounders (age, sex, school years), but unmeasured con-founders can still explain some of the differences between 1996 and 2006 (e.g. mental health, distress). However, the observed changes between 1996 and 2006 were not explained by changes in unemployment rates in Geneva (6.8% in 1996, 7.0% in 2006; OCSTAT, 2010). These changes may be explained only marginally by changes in the Muslim population in Geneva (2.2% in 1990, 4.3% in 2000, the most recent year available; Swiss Federal Office of Statistics, 2010), considering in addition that many of these immigrants are not French-speaking and may, therefore, not have answered the questionnaire. Rather, these changes may result from historical trends and from prevention policies.
Conclusions
During these 10 years, alcohol consumption and heavy drinking decreased in Geneva in both men and women, and the perceived level of safe or acceptable drinking also decreased. In spite of progress made over the past decade, much remains to be done to alleviate the burden imposed on society by alcohol use, particularly in men aged 50+ (the cat-egory with the highest alcohol consumption) and in young adults (as heavy drinking did not decrease in people aged <30). Drink driving remained frequent in both men and women and should be addressed more effectively. Paradoxically, among women, alcohol dependence even increased, driven by the items ‘guilty’ and ‘should cut down’, suggesting that changes in CAGE scores reflected changes in the social acceptability of drinking rather than changes in dependence.
Funding— This study was supported by Départment de l’économie et de la santé, Canton of Geneva, Switzerland.
REFERENCES
Annaheim B, Gmel G. (2004) Alkoholkonsum in der Schweiz. Ein Synthesebericht zu Alkoholkonsum und dessen Entwicklung auf der Basis der Schweizerischen Gesundheitsbefragungen 1997 und 2002. Lausanne: Schweizerische Fachstelle für Alkohol-und andere Drogenprobleme.
Asch DA, Jedirziewski MK, Christakis NA. (1997) Response rates to mail surveys published in medical journals. J Clin Epidemiol 50:1129–36.
Bisson J, Nadeau L, Demers A. (1999) The validity of the CAGE scale to screen for heavy drinking and drinking problems in a general population survey. Addiction 94:715–22.
Bloomfield K, Greenfield TK, Kraus L et al. (2002) A comparison of drinking patterns and alcohol-use-related problems in the United States and Germany, 1995. Subst Use Misuse 37:399–428.
Buhler A, Kraus L, Augustin R et al. (2004) Screening for alcohol-related problems in the general population using CAGE and DSM-IV: characteristics of congruently and incongruently ident-ified participants. Addict Behav 29:867–78.
Bush K, Kivlahan DR, McDonell MB et al. (1998) The AUDIT alcohol consumption questions (AUDIT-C): an effective brief screening test for problem drinking. Ambulatory Care Quality Improvement Project (ACQUIP). Alcohol Use Disorders Identification Test. Arch Intern Med 158:1789–95.
Chiolero A, Wietlisbach V, Ruffieux C et al. (2006) Clustering of risk behaviors with cigarette consumption: a population-based survey. Prev Med 42:348–53.
Eidgenössische Alkoholverwaltung (2009) Consommation de bois-sons alcoolisées par habitant en Suisse. Berne: Confédération Suisse.
Etter JF. (2009a) Perceived priorities for prevention: change between 1996 and 2006 in a general population survey. J Public Health (Oxf ) 31:113–8.
Etter JF. (2009b) Secondhand smoke in Geneva, 1996–2006: changes in exposure, opinions and workplace smoking bans in the absence on national legislation. Int J Occup Environ Health 15:159–65.
Etter JF. (2010) Smoking prevalence, cigarette consumption and advice received from physicians: change between 1996 and 2006 in Geneva, Switzerland. Addict Behav. 35:355–8.
Etter JF, Perneger TV. (1997) Analysis of non-response bias in a mailed health survey. J Clin Epidemiol 50:1123–8.
Ewing JA. (1984) Detecting alcoholism. The CAGE questionnaire. JAMA 252:1905–7.
FSO (2010) Gross domestic product per capita, 1990–2008. Statistics, S. F. O. o. ed. Berne: Swiss Federal Office of Statistics.
Grant BF. (2000) Estimates of US children exposed to alcohol abuse and dependence in the family. Am J Public Health 90:112–5.
Grant BF, Dawson DA, Stinson FS et al. (2004) The 12-month prevalence and trends in DSM-IV alcohol abuse and depen-dence: United States, 1991–1992 and 2001–2002. Drug Alcohol Depend 74:223–34.
Heeb JL, Gmel G. (2003) Veränderungen des Konsums und Kaufs von Spirituosen zwischen Frühling 1999 und Herbst 2001. Lausanne: ISPA.
Koppes LL, Twisk JW, Snel J et al. (2004) Comparison of short questionnaires on alcohol drinking behavior in a nonclinical
population of 36-year-old men and women. Subst Use Misuse 39:1041–60.
Mayfield D, McLeod G, Hall P. (1974) The CAGE questionnaire: validation of a new alcoholism screening instrument. Am J Psychiat 131:1121–3.
Messiah A, Encrenaz G, Sapinho D et al. (2008) Paradoxical increase of positive answers to the Cut-down, Annoyed, Guilt, Eye-opener (CAGE) questionnaire during a period of decreasing alcohol consumption: results from two population-based surveys in Ile-de-France, 1991 and 2005. Addiction 103:598–603. Midanik LT. (1988) Validity of self-reported alcohol use: a
litera-ture review and assessment. Br J Addict 83:1019–30.
Midanik LT, Clark WB. (1995) Drinking-related problems in the United States: description and trends, 1984–1990. J Stud Alcohol 56:395–402.
Mokdad AH, Marks JS, Stroup DF et al. (2004) Actual causes of death in the United States, 2000. JAMA 291:1238–45.
OCSTAT (2010) Effectifs des demandeurs d’emploi et des chômeurs inscrits, flux de chômeurs et taux de chômage, depuis 1990. O. C. d. l. S. ed, Geneva: (OCSTAT).
Priez F, Pellegrini S, Jeanrenaud C. (2005) Coûts humains des atteintes à la santé attribués à la consommation abusive d’alcool en Suisse. Berne: OFSP.
Rehm J, Taylor B, Patra J et al. (2006) Avoidable burden of disease: conceptual and methodological issues in substance abuse epidemiology. Int J Methods Psychiatr Res 15:181–91. Rehm J, Taylor B, Roerecke M et al. (2007) Alcohol consumption
and alcohol-attributable burden of disease in Switzerland, 2002. Int J Public Health 52:383–92.
Swiss Federal Office of Statistics (2010) Population résidante selon la religion, selon les cantons et les villes.http://www.bfs.admin. ch/bfs/portal/fr/index/themen/01/05/blank/key/religionen.html, Berne: Office fédéral de la statistique.
Wagenaar AC, Salois MJ, Komro KA. (2009) Effects of beverage alcohol price and tax levels on drinking: a meta-analysis of 1003 estimates from 112 studies. Addiction 104:179–90.