of Laying Hens in Different Years
c. HAGGER
Department of Animal Production, Swiss Federal Institute of Technology, Eidgenossische Technische Hochschule Zentrum, CH-8092 Zurich, Switzerland
(Received for publication May 31, 1990)
ABSTRACT Feed intake from 21 to 40 wk and from 41 to 60 wk of age of brown egg layers was analyzed. The full model contained BW, egg mass (EM) output, BW change (BWCH), and age at first egg as covariates in addition to effects of plumage condition class, sire, and dam. A reduced model contained the covariates only. Between 90S and 1,161, and 880 and 1,119 hens were available in the first and second periods, respectively. Averaged over 6 yr the full model explained 84 and 77%, the reduced model 73 and 63%, respectively, of the variance in feed consumption in the two periods. Regression coefficients for BW showed only a small variation between years as well as between periods. Variation was larger for the coefficients of EM and of BWCH. Larger coefficients were observed in the first period for both traits. The sequence of entering the reduced equation in a stepwise procedure was always BW, EM output, then BWCH. Averaged over 6 yr, the relative contribution of BW by its own to the accuracy of the regression model, was 68 and 60% in the two periods. Egg mass output then added 25 and 39%, and BWCH 7 and 2% in the first and second periods, respectively. The predictive value of the covariates changed with increasing age of the hens. A high average heritability of .48 could be estimated for the residual feed intake in both periods. This suggested enhanced selection response for efficiency.
(Key words: prediction, body weight, residual consumption, accuracy, heritability)
1991 Poultry Science 70:434-439 INTRODUCTION
Feed accounts for more than 60% of the production costs in laying hens. Even a small reduction of this share would, therefore, be most beneficial for egg producers. It can be taken for granted mat modem feeding equip-ment prevents feed spillage if handled proper-ly. Thus, new feed recipes and genetic selection are the means to improve further feed utilization in egg production. The difference between observed and predicted feed intake (residual or adjusted feed consumption) has been investigated quite extensively in poultry research with respect to efficiency of feed usage of layers (Arboleda et al., 1976; Hagger and Abplanalp, 1978; Bordas and Merat, 1981; Wing and Nordskog, 1982; Bentsen, 1983a; Braastad and Katie, 1989). The linear regres-sion of feed intake on BW, egg mass (EM) output, and BW change (BWCH) was most often used for prediction. Li several investiga-tions, heritability was quite high for the residual feed consumption. From this approach some insight on the importance of the individ-ual covariates for predicting feed intake can be expected. This might be useful in deciding what information should be incorporated into a
breeding program. Other possibilities would be to include feed efficiency (feed:egg mass) or to adapt a trait like income minus feed cost (Hagger, 1990) into a breeding program. The high costs of recording individual feed con-sumption limits the usefulness of this trait in breeding operations. Correlated traits that are easier to record would be of great help in poultry breeding. There are a few reports that point to plumage condition as a possible trait of interest. Very recently, Luiting (1990) gave an overview of investigations on genetic variation of energy partitioning in laying hens.
The aims of the present study were to investigate the variation between different years of 1) the regression coefficients and the accuracy of linear equations to predict feed intake, 2) the contributions of the covariates used to the accuracy of prediction, and 3) die heritability of residual feed consumption. Data were from six generations of a selection experiment on income minus feed cost in brown egg layers.
MATERIALS AND METHODS
Data emerged from six generations of a selection experiment designed to improve 434
income minus feed cost between the age of 21 and 40 wk in brown egg layers (Hagger, 1990). The experiment consisted of two selection lines and a control line, each of 20 male and 80 female breeders. An attempt was made to test 480 hens per generation and selection line and 240 in the control. In each generation chicks from three to four weekly hatches were reared on deep litter and trans-ferred to three-tier single cages of 1,350 cm2 floor space at the age of 14 wk. Twelve hours of light were provided from hatch to 40 wk of age, followed by gradually increasing day length to 15 h light, which was reached at 45 wk. A commercial layer diet was used, calculated to contain approximately 17% crude protein and 11.6 MJ (1 MJ = .239 Meal) ME/ kg. The diet was fed for ad libitum access from the 21st wk of age.
Egg number and egg weight were recorded daily from onset of lay to 28 wk of age, and on 6 days/wk thereafter. These data were adjusted to 28-day records for missing test days using an individual hen's information on rate of lay and egg weight. Individual feed consumption was recorded continuously from 21 to 60 wk of age. Plumage condition of individual hens was classified at 60 wk, except in Generation 3, when this trait was not recorded. The classification system for plumage condition and results concerning tins trait for two generations are given elsewhere (Hagger et al, 1989). All surviving hens that produced at least 10 eggs in a period were kept in the data.
The multiple linear regression approach including the intercept was used to study the influence of BW, EM output, BWCH, and age at first egg (AFE) on feed intake in two age periods. The periods were between 21 and 40 wk (Period 1) and between 41 and 60 wk (Period 2). This approach was used in similar investigations by Leeson et al. (1973) and Hagger and Abplanalp (1978) among others, as well as in genetic investigations of residual feed consumption (Bentsen, 1983a) or residual feed efficiency (Bordas and Merat, 1981).
It has been shown that, in addition to BW, EM, and BWCH, plumage condition and genetic effects also affect feed intake (Hagger
et al, 1989; Herremans et al, 1989). The
regression model was thus completed by including line, sire, and dam effects in Period 1 and by these and a plumage condition class effect in Period 2. The following full models were used.
Period 1:
yijkl = \l + Line, + fyBW + t^EM + b3BWCH + b4AFE + sy + dijk + eijki
Period 2:
yijklm = I1 + L m ei + Plumi + biBW + bzEM + b3BWCH + sy
Where yijtim is m e feed intake of a hen in one period; |x is the common mean; Linej is the fixed effect of line, i = 1 to 3; Plumj is the fixed effect of plumage class, 1 = 1 to 4; sy and djjk are random effects of sire, and dam within sire; ejjjdtn is the random residual; BW, EM, BWCH, AFE are covariates; and bi to b4 are partial regression coefficients.
The pure regression model contained only u, and the covariates. In Period 1 the weight at 30 wk served as BW, whereas in Period 2 die average of the weights at 40 and 60 wk was used. For BWCH, the difference between the weights at 40 and 20 wk was used in Period 1 and the difference between the weights at 60 and 40 wk was used in Period 2. Variance components for sire and dam were estimated by Henderson's Method 3 (Henderson, 1953) and the heritability h2 = 4a2/(c2 + O^ + o2,) calculated. The fit of the full model on the data (R2) was assessed by the ratio of the adjusted sum of squares explained by die model to die adjusted total sum of squares. This measure is equivalent to the multiple correlation coeffi-cient (R2) from die pure regression model The contribution of including a further covariate into the regression model to Rj was also calculated. Data of each generation and each period were analyzed separately.
RESULTS AND DISCUSSION
Population Means
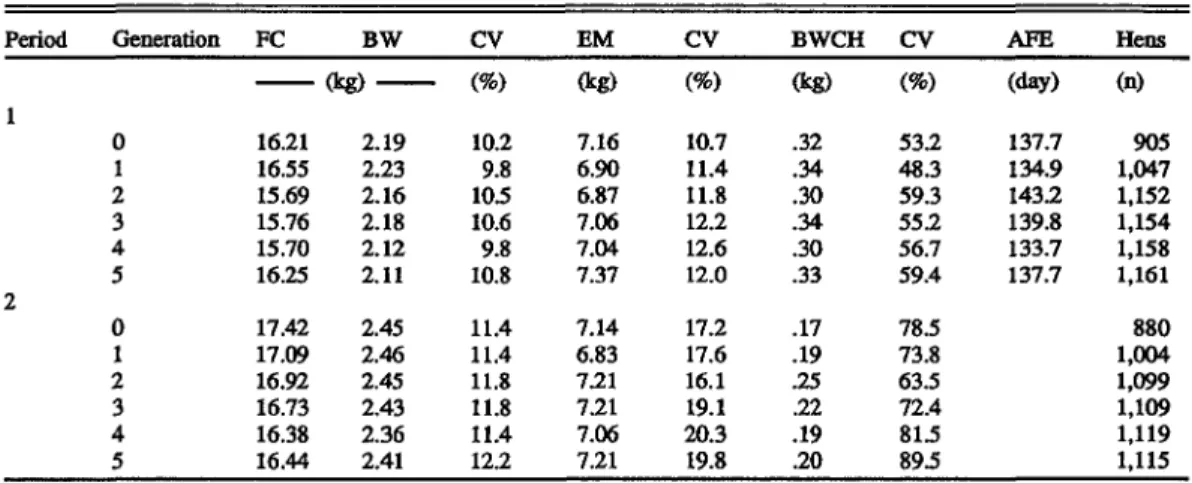
Population means of the traits used in die investigation and the number of hens are given in Table 1 according to generation and age period. For die important covariates, i.e., BW, EM output, and BWCH, the coefficients of
TABLE 1. Population means and coefficient of variation of feed consumption (FC), BW, egg mass (EM) output, body weight change (BWCH), age at first egg (AFE), and number of hens according to generation and age period (21 to 40 wk and 41 to 60 wk) Period Generation FC BW CV EM CV BWCH CV AFE Hens
(kg) (%) (kg) (%) (kg) (%) (day) (n) 16.21 16.55 15.69 15.76 15.70 16.25 17.42 17.09 16.92 16.73 16.38 16.44 2.19 2.23 2.16 2.18 2.12 2.11 2.45 2.46 2.45 2.43 2.36 2.41 10.2 9.8 10.5 10.6 9.8 10.8 11.4 11.4 11.8 11.8 11.4 12.2 7.16 6.90 6.87 7.06 7.04 7.37 7.14 6.83 7.21 7.21 7.06 7.21 10.7 11.4 11.8 12.2 12.6 12.0 17.2 17.6 16.1 19.1 20.3 19.8 .32 .34 .30 .34 .30 .33 .17 .19 .25 .22 .19 .20 53.2 48.3 59.3 55.2 56.7 59.4 78.5 73.8 63.5 72.4 81.5 89.5 137.7 134.9 143.2 139.8 133.7 137.7 905 1,047 1,152 1,154 1,158 1,161 880 1,004 1,099 1,109 1,119 1,115
variation are also given. The B W means changed only slightly between generations in both periods. The increase in mean BW between periods was roughly 300 g. The variation from year to year in average BWCH was considerably larger in Period 2 than in Period 1. The increase in weight from 20 to 40 wk was again nearly 300 g, whereas weight gain from 40 to 60 wk was around 200 g. The EM produced by the different generations were rather similar, but showed a slight drop from Generation 0 to Generation 1 in both periods. This might have partly been a consequence of the reduced heterosis, because the base population was a true Fl cross. Selection on income minus feed cost had increased egg mass in later generations (Hagger, 1990). The lower egg production of Generation 2 in Period 1 was the result of the late AFE in this generation. The EM outputs were nearly equal in the two periods of 20 wk duration each. Pullets consumed slightly less feed to produce the same quantity of EM than did older hens, in spite of the larger B W gain in Period 1. This can partly be explained by the differences in egg mass composition of pullets and older hens (Marguerat-Konig (1988)) and partly by the additional maintenance requirements of the higher BW in Period 2.
Influences on Feed Intake
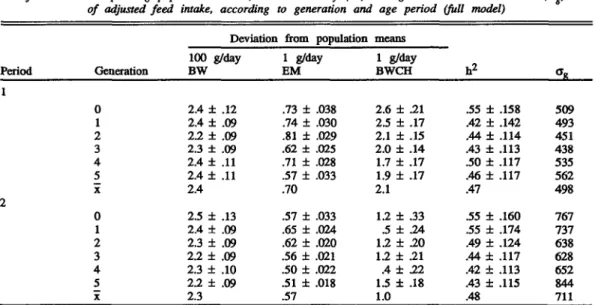
The partial regression coefficients obtained for the covariates in Table 1 and using the full
model given above were transformed to addi-tional feed intake per day. The results are for a deviation of 100 g in BW, 1 g/day in EM, and 1 g/day in BWCH from the corresponding popula-tion means, and are summarized together with their standard errors in Table 2. The regression coefficients for AFE were negative and very small compared with the coefficients of the other traits and thus not of any relevance. In both periods a remarkably constant amount of 2.3 g/ day of additional feed intake per 100 g of additional BW was observed in all generations. Wing and Nordskog (1982) reported a some-what larger value of 3.2 g/day. Numerous equations to predict feed intake of laying hens have been published, all of which used body weight raised to the power of a metabolic constant, c, between 1.0 and .5. The estimated coefficients for this trait are, therefore, not comparable to the values presented in Table 2. Using body weight directly or transformed to a metabolic size did not influence the accuracy of such a prediction equation (Hagger and Mar-guerat, 1985).
Estimated additional feed intake for a devia-tion of 1 g/day in EM output was on average larger in Period 1 than in Period 2, .70 g versus .57 g, widi quite a variation within periods. A much larger variation of EM output in Period 2 (Table 1) seemed to be responsible for this finding. This masked the expected higher additional intake due to the higher energy content of egg mass of older hens (Marguerat-Konig, 1988). Estimates from an intercept
TABLE 2. Additional feed intake (x ± SE), grams per day, due to a deviation of either 100 g in BW, 1 glday in egg mass (EM) output, or 1 g/day in body weight change (BWCH)
from the corresponding population means, and heritabitity (tr) and genetic standard deviation (ag) of adjusted feed intake, according to generation and age period (full model)
Period
Deviation from population means
Generation 100 g/day BW 1 g/day EM 1 g/day BWCH 0 1 2 3 4 5 x 0 1 2 3 4 5 x 2.4 ± 2.4 ± 2.2 ± 2.3 ± 2.4 ± 2.4 ± 2.4 2.5 ± 2.4 ± 2.3 ± 2.2 ± 2.3 ± 2.2 ± 2.3 .12 .09 .09 .09 .11 .11 .13 .09 .09 .09 .10 .09 .73 ± .74 ± .81 ± .62 ± .71 ± .57 ± .70 .57 ± .65 ± .62 ± .56 ± .50 ± .51 ± .57 .038 .030 .029 .025 .028 .033 .033 .024 .020 .021 .022 .018 2.6 ± .21 2.5 ± .17 2.1 ± .15 2.0 ± .14 1.7 ± .17 1.9 ± .17 2.1 1.2 ± .33 .5 ± .24 1.2 ± .20 1.2 ± .21 A± 22 1.5 ± .18 1.0 .55 ± .42 ± .44 ± .43 ± .50 ± .46 ± .47 .55 ± .55 ± .49 ± .44 ± .42 ± .43 ± .48 .158 .142 .114 .113 .117 .117 .160 .174 .124 .117 .113 .115 509 493 451 438 535 562 498 767 737 638 628 652 844 711
model for additional feed consumption due to deviations in EM output given in the literature are variable. For brown egg layers, Leeson et al. (1973) reported distinctly larger regression coefficients, but also smaller ones, depending on amount of data and age of hens. A slightly higher value than given in Table 2 was found by Bentsen (1983a). It has to be pointed out that many of the published results are based on a rather limited number of observations and sometimes also on short recording periods. The additional feed intake estimated for an additional 1 g/day in BWCH was much larger in Period 1 than in Period 2: 2.1 g versus 1.0 g (Table 2). However, a much greater variation between generations was observed in the second period. This difference does not indicate that less feed to produce body tissue was required in the second than in the first period. The two coefficients involved give only the amount of feed that could be attributed to a BWCH of 1 g/ day. The larger variation of BWCH in the second period (Table 1), as already found for EM output, seemed to be the cause for the smaller amount of feed explained by this trait in older hens. Leeson et al. (1973) also reported larger values of similar size for young hens. Bentsen (1983a) found an average additional intake of 1.2 g feed/g BWCH when combining data over several strains and several periods. This value would fit into the coefficients for
older hens in Table 2. The results suggest that different prediction equations for feed consump-tion should be used for hens of different ages, because the regression coefficients for the same trait may change considerably or even lose any predictive value, as, e.g., found for BWCH, with increasing age.
Accuracy of Predicting Feed Intake
The relative amount of variance in feed consumption which could be accounted for by
9 2
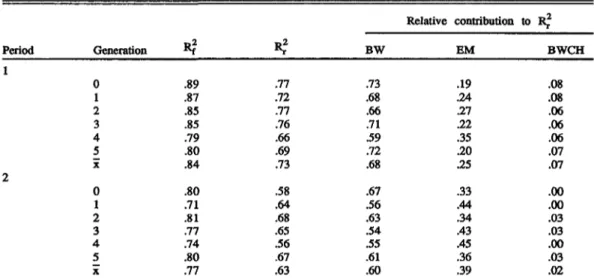
the models (Rf, Rj.) are summarized in Table 3 for all generations and both periods. The full model explained 84% of the variance in pullets and 77% in older hens. The corresponding figures for the regression model were 73 and 63%, respectively. Therefore, effects of line, plumage condition class, sire, and dam contri-buted significantly to die performance of the models. The loss in accuracy from Period 1 to Period 2 was smaller for the full than for the regression model. A large variation between generations could also be observed for the accuracy measures.
The importance of the covariates in the regression equations was assessed by a stepwise estimation procedure, which took the additional reduction in the error sum of squares of the dependent variable into account. The sequence
TABLE 3. Accuracy of the full model (F?f), the regression model (ICr), and the relative additional contributions of body weight, egg mass (EM), and body weight change (BWCH) to the accuracy
of the regression model, according to generation and period
Period 1 2 Generation 0 1 2 3 4 5 X 0 1 2 3 4 5 X
*?
.89 .87 .85 .85 .79 .80 .84 .80 .71 .81 .77 .74 .80 .77*?
.77 .72 .77 .76 .66 .69 .73 .58 .64 .68 .65 .56 .67 .63 BW .73 .68 .66 .71 .59 .72 .68 .67 .56 .63 .54 .55 .61 .60 Relative contribution EM .19 .24 21 21 .35 .20 .25 .33 .44 .34 .43 .45 .36 .39 to R? BWCH .08 .08 .06 .06 .06 .07 .07 .00 .00 .03 .03 .00 .03 .02of entering the equation was always BW, EM output, and BWCH. The additional relative contributions of the covariates to R,. are listed in Table 3. The interpretation that a single covari-ate explains the given relative part of Rj. is valid only for BW because this trait entered the equation first. The parts of the later entering variables give the additional contribution of the new combination of covariates compared with the previous one. The figures show that BW accounted for more than half of the variance explained by the models in both periods, on average 68% in Period 1 and 60% in Period 2. Including EM output in the equations resulted in a substantial increase in accuracy of 25% in Period 1 and of 39% in Period 2. In older hens, BW had lost in predictive value, whereas EM had gained in value compared with values for pullets. Including BWCH in the equations added another 7% to the accuracy in Period 1 but nearly nothing in Period 2.
From these results, it can be deduced that the prediction of feed intake in pullets from BW, EM output, and BWCH by the classical equations is accurate under normal temperatures in the laying house. For older hens, BWCH seems not to be of any predictive value. Accounting for plumage condition of the hens, however, is important, because between the poorest (over 30% naked body surface) and the
best (complete feather cover) plumage classes, differences in feed intake of 670 to 1,030 g were found in Period 2. Herremans et al. (1989) came to a different conclusion from experiments with small numbers of hens, various environmental temperatures, and short recording periods. They found no predictive value of BW but some for BWCH. They also pointed out that plumage condition of hens has an important influence on feed intake.
Genetic Effects on Feed Intake
Heritabilities were high and very similar for adjusted or residual feed intake during the 20 wk of both Periods 1 and 2 (Table 2). The variation between generations was rather small. Other estimates for this trait are .22 to .64 by Hagger and Abplanalp (1978), .26 by Wing and Nordskog (1982), and .0 to .57 by Bentsen (1983b). The genetic standard deviation of the trait was more than 40% larger in Period 2 than in Period 1. This would suggest that selection on this trait should be more effective in older hens. Selection on negative residual feed intake would slowly improve feed efficiency, as found by Bordas and Merat (1984). Expected genetic response from selecting on this trait and among females only, as done in the present experiment, hi<jg/2, with i = 1, would be -247 g with the parameters of Period 2. Compared with an
average feed intake of 16.5 kg and an EM output of 7.2 kg feed/kg EM output would change from 2.29 to 2.26, or roughly 1.5% in one generation. Residual feed intake, i.e., feed intake adjusted for the fixed effects and the covariates in the models, is sometimes taken as a measure of efficiency of laying hens (Bordas and Merat, 1981; Wing and Nordskog, 1982; Bentsen, 1983a; Hagger and Marguerat, 1985). A hen that consumes more feed than predicted from BW, EM output, and BWCH gets a positive residual and, thus, is below average efficiency. Divergent selection on this criterion has lead to lines with positive differences in feed per gram of egg mass and hatchability in favor of the high efficiency (negative residual feed intake) line, but it also has led to an undesirable difference in egg weights (Bordas and Merat, 1984). Residual feed intake, therefore, seems to have some potential in a breeding scheme designed to improve overall efficiency of egg production. However, it remains to be demonstrated that this trait has advantages over a selection criterion that directly includes the traits used to calculate residual feed consumption.
The true causes of the genetic variation in feed efficiency are still not very clear. Bordas and Merat (1984) found smaller combs and wattles in their line selected on negative residual feed consumption. They also found reduction in unfeathered appendages and a tendency for lower rectal temperature. Braastad and Katie (1989) also reported differences between lines selected on adjusted feed intake. They found that hens from the high efficiency lines were significantly less active and had a better feather cover than hens from the low efficiency line. Thus, selection for a better feather cover seems not only to reduce heat loss but should also favor less active birds and, therefore, reduce feed intake also indirectly to some extent. Plumage condition would be rather easy to record in a breeding scheme compared with measuring feed intake or some respiration parameters. Accord-ing to Herremans et al. (1989) feather cover combined with ambient temperature seems to be a useful covariate to predict feed intake in less favorable laying house temperatures than usu-ally recommended for egg production. A good feather cover may be an advantage in temperate areas but may not be so in hot areas.
ACKNOWLEDGMENTS
Thanks are due to D. Steiger-Stafl for invaluable technical assistance and to G. Stranzinger for continuous support.
REFERENCES
Arboleda, C. R., D. L. Hams, and A. W. Nordskog, 1976. Efficiency of selection in layer-type chickens by using supplementary information on feed consump-tion. I. Selection index theory. Theor. Appl. Genet 48:67-73.
Bentsen, H. B., 1983a. Genetic variation in feed efficiency of laving hens at constant body weight and egg production. I. Efficiency measured as a deviation between observed and expected feed consumption. Acta Agric. Scand. 33:289-304.
Bentsen, H. B., 1983b. Genetic variation in feed efficiency of laying hens at constant body weight and egg production. II. Sources of variation in feed consump-tion. Acta Agric. Scand. 33:305-320.
Bordas, A., and P. Merat, 1981. Genetic variation and phenotypic correlations of food consumption of laying hens corrected for body weight and produc-tion. Br. Poult Sci. 22:25-33.
Bordas, A., and P. Merat 1984. Correlated responses in a selection experiment on residual feed intake of adult Rhode-Island Red cocks and hens. Ann. Agric. Fenn. 23:233-237.
Braastad, B. O., and J. Katie, 1989. Behavioral differences between laying hen populations selected for high and low efficiency of food utilization. Br. Poult Sci. 30: 533-544.
Hagger, C , 1990. Response from selection for income minus food cost in laying hens, estimated via the animal model. Br. Poult. Sci. 31:701-713. Hagger, C , and H. Abplanalp, 1978. Food consumption
records for the genetic improvement of income over food costs in laying flocks of White Leghorns. Br. Poult Sci. 19:651-667.
Hagger, C , and C. Marguerat, 1985. Relationship of production traits and egg composition to feed consumption and the genetic variability of efficiency in laying hens. Poultry Sci. 64:2223-2229. Hagger, C , C. Marguerat D- Steiger-Stafl, and G.
Stranzinger, 1989. Plumage condition, feed con-sumption, and egg production relationships in laying hens. Poultry Sci. 68:221-225.
Henderson, C. R., 1953. Estimation of variance and covariance components. Biometrics 9:226-252. Herremans, M., E. Decuypere, and O. Siau, 1989. Effects
of feather wear and temperature on prediction of food intake and residual food consumption. Br. Poult Sci. 30:15-22.
Leeson, S., D. Lewis, and D. H. Shrimpton, 1973. Multiple linear regression equations for the prediction of food intake in the laying fowl. Br. Poult. Sci. 14:595-608. Luiting, P., 1990. Genetic variation of energy partitioning in laying hens: causes of variation in residual feed consumptioa World's Poult Sci. J. 46:133-152. Marguerat-Konig, C , 1988. Selektionsversuch auf
wirt-schaftlich gewichtete Merkmale - EierlOs minus Futterkosten - beim Huhn. Dissertation EidgenOs-sische Technische Hochschule Number 8694, Zurich, Switzerland.
Wing, T. L., and A. W. Nordskog, 1982. Use of individual feed records in a selection program for egg production efficiency. I. Heritability of the residual component of feed efficiency. Poultry Sci. 61: 226-230.