Rhodamine 6G efflux for the detection of CDR1-overexpressing azole-resistant Candida albicans strains
6
0
0
Texte intégral
(2) S. Maesaki et al. Chemical Co., St Louis, MO, USA) was prepared by dissolving the dye in DMSO at a concentration of 10 mM. A final concentration of 10 M of R6G was added to the cell suspension and incubated at 37°C in a reciprocating shaker. After incubation for 5, 10, 15, 20, 25 min, 1 mL samples were withdrawn and centrifuged at 9000g for 2 min. The supernatants (750 L) were collected and absorption was measured at 527 nm. To examine the effect of glucose, the cell suspension was centrifuged after 25 min incubation, at 5000g for 5 min and pellets were resuspended in PBS containing 1 mole of glucose and incubated at 37°C. Samples of 1 mL volume were withdrawn at 5 min intervals and centrifuged at 9000g for 2 min. Then 750 L of supernatant was collected and absorption was measured at 527 nm. The concentration of R6G was calculated using a standard concentration curve of R6G.. Materials and methods Strains, medium and azole antifungal agents Two isolates of C. albicans (B2630 and B67081) held at the Janssen Research Foundation (Beerse, Belgium) were used. Another 10 strains of C. albicans that were originally isolated from AIDS patients with OPC, were obtained from the Institute of Microbiology (Centre Hospitalier Universitaire, Vaudois, Switzerland). The species were identified using standard procedures. All strains were maintained at –80°C. Strains of C. albicans were grown in a CYG medium containing 0.5% casein hydrolysate (Merck, Darmstadt, Germany), 0.5% yeast extract (Difco, Detroit, MI, USA) and 0.5% glucose (Difco). Fluconazole was obtained from Pfizer (Sandwich, UK), and ketoconazole and itraconazole from the Janssen Research Foundation (Beerse, Belgium). Azole antifungal agents were dissolved in dimethyl sulphoxide (DMSO) at 1.5 g/L and used as stock solution.. Intracellular concentration of R6G in growing isolates of C. albicans Yeast cells were grown in 100 mL of CYG medium at 37°C for 14 h in a reciprocating shaker. A total of 1 108 cells/mL was transferred to 100 mL of fresh CYG medium and the cells were harvested after 4 h incubation by centrifugation at 5000g for 5 min, and then washed with PBS. Cells were resuspended in CYG medium to a cell concentration of 2.5 108 cells/mL. One millilitre of the cell suspension was incubated in a 10 mL glass tube with R6G (final concentration 10 M) at 37°C for 1 h, under continuous shaking at 300g in an orbital shaker. Cells were collected by centrifugation at 9000g for 2 min and were resuspended with 750 L of PBS buffer and absorption was measured at 527 nm.. MIC determination for C. albicans isolates The stock solution was diluted 100-fold with susceptibilitytesting culture medium and a series of 10 two-fold dilutions was prepared. These solutions were pipetted in 100 L volumes into rows of wells of flat-bottomed microdilution plates (Falcon 3072; Becton Dickinson, Lincoln Park, NJ, USA). The final concentrations of fluconazole ranged from 100 to 0.13 mg/L, and those of ketoconazole and itraconazole from 8 to 0.02 mg/L, in two-fold serial dilutions. The MIC of antifungal agents was determined by the microdilution method using the 96 flat-bottomed microdilution plate modified from the NCCLS macrodilution method. From deep frozen stock culture, the cells of C. albicans were inoculated into 5 mL of CYG broth and incubated at 37°C for 18–24 h with shaking. The final inoculum size was adjusted to 103 cfu/mL. The plates were sealed with plastic stickers and incubated for 48 h at 35°C. MICs were determined as the minimum concentration of the antifungal agents yielding at least 80% inhibition of the growth compared with the growth of control.. Measurement of CDR1 and CaMDR (BENr) mRNA expression The measurement of CDR1 and CaMDR (BENr) mRNA expression was reported in our previous study.10 Yeast cells were grown to logarithmic phase in 100 mL of Yeast Nitrogen Base (YNB) medium at 30°C with shaking. The cells were harvested and were ground to a fine powder under liquid nitrogen. The powder was immediately dissolved in a denaturing solution provided by the RNAeasy kit (QIAGEN Inc., Chatsworth, CA, USA). For the Northern analysis, RNA was first denatured in a loading buffer (50% formamide, 100 mM MOPS pH 7.0, 6.4% formaldehyde, 5% glycerol, 5% of a water solution saturated with bromophenol blue) at 85°C for 5 min and then subjected to electrophoresis in 1% agarose. The agarose was melted in a buffer containing 0.1 M MOPS, 0.6 M formaldehyde. The electrophoresis buffer was 0.1 M MOPS pH 7.0. Northern transfer was performed overnight on GeneScreen Plus (DuPont NEN, Boston, MA, USA) with 10 SSC (1 SSC is 0.15 M NaCl plus 0.015 M sodium citrate). Measurement of R6G uptake and glucose-induced efflux Yeast cells were grown in 100 mL of CYG broth at 37°C for 14 h. 1 108 yeast cells/mL were transferred to 100 mL of fresh CYG broth and incubated at 37°C for 4 h. The cells were harvested in 50 mL Falcon tubes (Becton Dickinson) and centrifuged at 5000g for 5 min. The pellets were washed twice with 20 mL of phosphate buffered saline (PBS; Life Technologies, Paisley, Scotland). They were then suspended in a glucose-free PBS buffer, at a concentration of 1 108 cells/mL and incubated at 37°C for 1 h in a reciprocating shaker. A stock solution of R6G (Sigma 28.
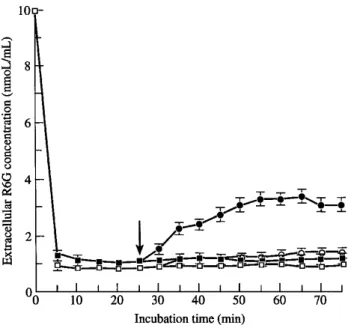
(3) R6G efflux from azole-resistant C. albicans as a transfer buffer. RNA was fixed on the membrane by baking at 80°C under vacuum. Membranes were prehybridized at 42°C with a buffer consisting of 50% formamide, 1% sodium dodecyl sulphate (SDS), 4 SSC, 10% dextran sulphate and salmon sperm DNA 100 mg/L. 32 P-labelled DNA probes were generated by random priming and were added to the hybridization solution overnight. After the washing step, membranes were exposed to X-OMAT AR film (Eastman Kodak Company, Rochester, NY, USA) for documentation. For quantitative analysis, the signals were subsequently analysed by a Phosphor Imager (Molecular Dynamics, Sunnyvale, CA, USA).. the uptake reached equilibrium 25 min after incubation. No significant difference in R6G uptake was observed between B67081 (8.86 0.03 nmol/10 9 cells, n 10) and B2630 (9.02 0.02 nmol/109 cells, n 10) 25 min after incubation. In the next step, the cells were resuspended in PBS and 1 mol of glucose was added 30 min after incubation. Azole-resistant C. albicans (B67081) pumped out higher concentrations of R6G (2.00 0.21 nmol/109 cells, n 10) into the extracellular fluid than azole-sensitive C. albicans (B2630) (0.23 0.14 nmol/109 cells, n 10). However, no R6G efflux occurred when both strains were maintained for another 35 min in the absence of glucose (Figure). Table I summarizes R6G uptake and glucose-induced R6G efflux in different clinical isolates of azole-resistant and -sensitive C. albicans strains. Intracellular accumulation of R6G was observed in all strains when incubated in PBS. In addition, glucose-induced R6G efflux was observed in all azole-resistant strains. However, one azoleresistant strain (C40) showed only a small amount of glucose-induced R6G efflux.. Results Effect of glucose on uptake and efflux of R6G by C. albicans To investigate the efflux mechanisms of azole antifungal agents, we measured the uptake and efflux of R6G by C. albicans cells. For this purpose, we compared R6G uptake and efflux in azole-resistant (B67081) and -sensitive (B2630) strains. Intracellular R6G uptake increased immediately when both types of cells were incubated in glucosefree PBS, as was evident from a sharp drop in the measured extracellular concentrations of R6G (Figure 1). However,. Intracellular R6G accumulation in growing C. albicans cells We compared the intracellular accumulation of R6G in growing C. albicans cells, both fluconazole-sensitive and -resistant strains (Table II). R6G accumulation measured by the photometric method in the azole-resistant strain (B67081) was markedly lower than in the sensitive strain (B2630). In contrast, intracellular R6G concentration in four of five fluconazole-sensitive strains (MIC of fluconazole was 6.3 mg/L for C27, C33, C23 and C37) was more than 4.0 nmol/mL. However, the concentration in one azole-sensitive strain, C32 (MIC of fluconazole was 3.2 mg/L) was lower than in the other four sensitive strains. Intracellular R6G concentration in three fluconazole-resistant strains (C82, C26 and C39) was 3.0 nmol/mL. The highest accumulation of R6G was noted in azole-resistant strains C34 and C40 (MIC of fluconazole was 25 and 100 mg/L, respectively). We correlated the concentration of intracellular R6G in growing C. albicans strains with the level of CDR1 mRNA (Table II). Six strains with a low expression of CDR1 mRNA showed a high accumulation of intracellular R6G whereas three other azole-resistant strains with a high level of CDR1 expression showed very low intracellular concentration of R6G. These results indicated that accumulation of R6G in the cell was inversely related to the expression level of CDR1 mRNA.. Figure 1. R6G uptake and glucose-induced R6G efflux by azoleresistant (B67081) and -sensitive (B2630) C. albicans strains. One mole of glucose was added after 25 min incubation (arrow) to a glucose-free PBS. Each data point represents the mean S.D. of 10 measurements of the extracellular concentration of R6G at the specified time interval. ( ) B67081 azole-resistant strain in the presence of glucose, ( ) B67081 strains without glucose, ( ) B2630 azole-sensitive strain with glucose, ( ) B2630 without glucose.. Discussion In our assay, we used the fluorescent dye rhodamine which is known to be transported into or out of the cell in a number of organisms that maintain MDR,12 from yeast to 29.
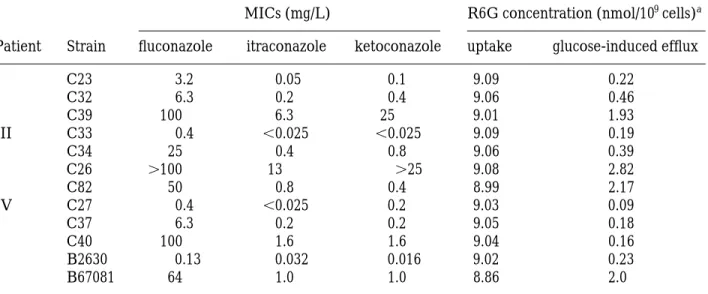
(4) S. Maesaki et al. Table I. R6G uptake and glucose-induced efflux in clinically isolated azole-sensitive and -resistant C. albicans strains R6G concentration (nmol/109 cells)a. MICs (mg/L) Patient. Strain. I. C23 C32 C39 C33 C34 C26 C82 C27 C37 C40 B2630 B67081. III. IV. fluconazole 3.2 6.3 100 0.4 25 100 50 0.4 6.3 100 0.13 64. itraconazole. ketoconazole. uptake. glucose-induced efflux. 0.05 0.2 6.3 0.025 0.4 13 0.8 0.025 0.2 1.6 0.032 1.0. 0.1 0.4 25 0.025 0.8 25 0.4 0.2 0.2 1.6 0.016 1.0. 9.09 9.06 9.01 9.09 9.06 9.08 8.99 9.03 9.05 9.04 9.02 8.86. 0.22 0.46 1.93 0.19 0.39 2.82 2.17 0.09 0.18 0.16 0.23 2.0. a R6G uptake was calculated from the extracellular R6G concentration incubated with 10 mol/mL of R6G in PBS buffer after 25 min. The concentration of R6G efflux induced by glucose was calculated thus: extracelluar R6G concentration with glucose–extracellular concentration without glucose after 30 min incubation. Each experiment was carried out three times for each strain, and the mean values at each R6G concentration are given. The variation in each concentration was 10%.. Table II. The accumulation of R6G in growing fluconazole-sensitive and -resistant C. albicans strains Relative expression level of mRNA Strain. Fluconazole MIC (mg/L). C27 C33 C23 C32 C37 C34 C82 C26 C39 C40. 0.4 0.4 3.2 6.3 6.3 25 50 100 100 100. a. S.D.. The values are mean. (n. CDR1. CaMDR. 0.2 0.2 0.3 0.6 0.2 0.2 1.7 1.4 1.3 0.2. 0 0 0 0 0 0 0 0 0 1.0. R6G accumulation (nmol/mL)a 4.38 4.09 4.30 3.03 4.50 3.99 2.63 2.58 2.62 4.46. 0.10 0.15 0.11 0.05 0.15 0.10 0.13 0.07 0.16 0.09. 6).. mammalian cells.13 In our previous study, the accumulation of fluconazole in strains C26 and C40 was lower than that in strain B2630, however, only C26 showed a marked reduction in the accumulation of itraconazole.14 Our results showed that R6G moved from the extra- into the intracellular compartment in both azole-resistant and -sensitive strains when incubated in glucose-free conditions. The R6G efflux from azole-resistant strains was significantly enhanced when glucose was added to PBS. These results suggest that these strains are capable of inducing the MDR. protein to reduce intracellular accumulation of azole compounds. It is noteworthy that in strains of azole-resistant Candida glabrata and Candida krusei, no significant differences in R6G efflux were observed between azole-sensitive and -resistant strains (data not shown). Considered together, we believe that the mechanisms of resistance of C. glabrata and C. krusei against azole antifungal agents may be different from those of C. albicans or, alternatively, R6G may not be a substrate of the MDR protein in these strains. 30.
(5) R6G efflux from azole-resistant C. albicans The resistance of C40 to fluconazole was as high as that of strain C26. The latter strain also showed cross-resistance to ketoconazole and itraconazole, but strain C40 was less resistant to ketoconazole and itraconazole.10 In the present study, R6G uptake was not significantly different between the two resistant strains. However, we observed R6G efflux only in C26, since the level of CDR1 mRNA expression of C40 was similar to that of the sensitive strain; R6G efflux in C40 was not induced by glucose. The differences in R6G efflux between strains C26 and C40 suggest that R6G is a substrate of the MDR protein produced by CDR1 mRNA. Intracellular concentrations of R6G were high in fluconazole-sensitive growing C. albicans cells but low in resistant strains. However, one of the sensitive strains, C32, had a low concentration of R6G in growing cells. Comparison between C32 and C37 strains showed that the susceptibility of both strains to fluconazole was similar, but the level of expression of CDR1 mRNA in C37 was almost twice that in the C32 strain. Thus, the differences in expression of CDR1 mRNA between these two strains may explain the difference in intracellular accumulation of R6G. Among azole-resistant strains, C34 and C40 showed a higher accumulation of R6G than other resistant strains. These two strains also showed a low level of expression of CDR1 mRNA. The C40 strain was the only resistant strain included in this study that expressed CaMDR mRNA. The methods used to measure accumulation of R6G could not confirm whether the mechanism of azole resistance was due to the CaMDR gene. The differences in R6G accumulation between these two strains suggest that the efflux mechanism of resistance was induced by a phenotype different from that of the CDR1 gene, or perhaps was caused by an entirely different mechanism. Future studies should compare the accumulation of cytochrome P450 or the binding affinity of azole compounds in these strains. This method may be simple and convenient for measuring the level of CDR1 mRNA expression in azole-resistant strains of C. albicansand could be useful in determining the basis of azole resistance among clinically isolated strains. The method is based on the molecular mechanism of C. albicans resistance to azoles and can be used for comparing azole-resistant strains of C. albicans defined using other procedures. We suggest that measurement of intracellular accumulation of R6G could be used clinically to identify resistant strains of C. albicans isolated from patients during azole antifungal therapy and to help in selecting a suitable antifungal therapy.. References 1. Willocks, L., Leen, C. L. S., Brettle, R. P., Urquhart, D., Russell, T. B. & Milne, L. J. R. (1991). Fluconazole resistance in AIDS patients. Journal of Antimicrobial Chemotherapy 28, 937–9. 2. Johnson, E. M., Warnock, D. W., Luker, J., Porter, S. R. & Scully, C. (1995). Emergence of azole drug resistance in Candida species from HIV-infected patients receiving prolonged fluconazole therapy for oral candidiasis. Journal of Antimicrobial Chemotherapy 35, 103–14. 3. Law, D., Moore, C.B., Wardle, H.M., Ganquli, L.A., Keaney, M. G., Denning, D.W. et al. (1994). High prevalence of antifungal resistance in Candida spp. from patients with AIDS. Journal of Antimicrobial Chemotherapy 34, 659–68. 4. National Committee for Clinical Laboratory Standards. (1997). Reference Method for Broth Dilution Antifungal Susceptibility Testing of Yeasts: Approved Standard M27-A. NCCLS, Villanova, PA. 5. Rex, J. H., Pfaller, M. A., Galgiani, J. N, Bartlett, M. S., EspinelIngroff, A., Ghannoum, M. A. et al. (1996). Development of interpretive breakpoints for antifungal susceptibility testing: conceptual framework and analysis of in vitro–in vivo correlation data for fluconazole, itraconazole, and Candida infections. Clinical Infectious Diseases 24, 235–47. 6. Revankar, S. G., Kirkpatrick, W. R., McAtee, R. K., Fothergill, A. W., Redding, S. W., Rinaldi, M. G. et al. (1998). Interpretation of trailing endpoints in antifungal susceptibility testing by the National Committee for Clinical Laboratory Standards method. Antimicrobial Agents and Chemotherapy 36, 153–6. 7. Vanden Bossche, H., Marichal, P. & Odds, F. C. (1994). Molecular mechanisms of drug resistance in fungi. Trends in Microbiology 2, 393–400. 8. Vanden Bossche, H., Warnock, D. W., Dupont, B., Kerridge, D., Gupta, S. S., Improvisi, L. et al. (1994). Mechanisms and clinical impact of antifungal drug resistance. Journal of Medical and Veterinary Mycology 32, suppl 1, 189–202. 9. White, T. C. (1998). Antifungal drug resistance in Candida albicans. ASM News 63, 427–33. 10. Sanglard, D., Kuchler, K., Ischer, F., Pagani, J. L., Monod, M. & Bille, J. (1995). Mechanisms of resistance to azole antifungal agents in Candida albicans isolates from AIDS patients involve specific multidrug transporters. Antimicrobial Agents and Chemotherapy 39, 2378–86. 11. Goldway, M., Teff, D., Schmidt, R., Oppenheim, A. B. & Koltin, Y. (1995). Multiple resistance in Candida albicans: Disruption of the BENr gene. Antimicrobial Agents and Chemotherapy 39, 422–6. 12. Lee, J. S., Paull, K., Alvarez, M., Hose, C., Monks, A., Grever, M. et al. (1994). Rhodamine efflux patterns predict P-glycoprotein substrates in the National Cancer Institute drug screen. Molecular Pharmacology 46, 627–38. 13. Clark, F. S., Parkinson, T., Hitchcock, C. A. & Gow, N. A. R. (1996). Correlation between rhodamine 123 accumulation and azole sensitivity in Candida species: Possible role for drug efflux in drug resistance. Antimicrobial Agents and Chemotherapy 40, 419–25. 14. Maesaki, S., Marichal, P., Hossain, M. A., Sanglard, D., Vanden Bossche, H. & Kohno, S. (1998). Synergic effects of tacrolimus and azole antifungal agents against azole-resistant Candida albicans strains. Journal of Antimicrobial Chemotherapy 42, 747–53.. Acknowledgement We thank Dr F. G. Issa, Department of Medicine, University of Sydney, Australia for careful reading and editing of the manuscript.. Received 11 October 1998; returned 1 January 1999; revised 18 January 1999; accepted 14 February 1999. 31.
(6)
(7)
Figure
Documents relatifs
