Synchrotron-based tomographic microscopy (SbTM) of wood:
development of a testing device and observation of plastic
deformation of uniaxially compressed Norway spruce samples
Michaela Zauner
1,*, Daniel Keunecke
1,
Rajmund Mokso
2, Marco Stampanoni
2and Peter Niemz
11
Department of Civil , Environmental and Geomatic
Engineering, Institute for Building Materials, ETH
Zurich, Zurich , Switzerland
2
Paul Scherrer Institut , SLS, Villigen , Switzerland
* Corresponding author.Department of Civil, Environmental and Geomatic Engineering, Institute for Building Materials, ETH Zurich, 8093 Zurich, Switzerland
Phone: + 41-44-632-5231 Fax: + 41-44-632-1174 E-mail: [email protected]
Abstract
To understand better the structure-property relationships of
wood in situ, nondestructive synchrotron-based tomographic
microscopy (SbTM) with subcellular resolution is useful. In
this context, an in situ testing device was developed to
deter-mine the cellular response of wood to mechanical loading.
Different rotationally symmetric specimens were tested to
synchronize the failure areas to the given scanning areas.
Norway spruce samples were uniaxially compressed in the
longitudinal direction and scanned in situ at several increasing
relative forces ending up in the plastic deformation regime.
A suffi ciently high quality in situ tomography was
demon-strated. The reconstructed data allowed the observation of the
load-dependent development of failure regions: cracks and
buckling on the microstructure were clearly visible. Future
investigations with SbTM on different wood species, loading
directions, and different moisture contents are promising in
terms of the micromechanical behavior of wood.
Keywords: compression; in situ tests; Norway spruce;
syn-chrotron-based tomographic microscopy (SbTM); synchrotron
radiation micro computed tomography (SR
μ CT).
Introduction
Mechanical properties of wood are infl uenced by the
compo-sition and structure of its anatomical elements at the
micro-scopic and macromicro-scopic level. Softwoods consist of 90
%
tube-shaped tracheids and 10 % of brick-shaped parenchyma
cells as part of the wood rays (Wagenf ü hr 2007 ). On the
mesoscopic scale, a growth ring is composed of thin-walled
earlywood (EW) tracheids and thick-walled latewood (LW)
tracheids. The composition of wood is inhomogeneous, and
the spatial distribution of the different cell types (and their
size) may vary, thus the physical properties of wood observed
at the macroscopic level vary signifi cantly even within the
same species (Keunecke et al. 2008). This is a reason why
the simulations of the mechanical behavior of wood are
dif-fi cult (Hofstetter et al. 2005 ). The improved knowledge of
structure-property relationships down to the cellular level
combined with imaging methods would probably facilitate
this situation.
Various imaging methods for the observation of cellular
structures at microscopic resolution are available (Butterfi eld
and Meylan 1980 ). Optical and electron microscopy (EM) are
both essential surface evaluation methods for thicker samples,
but are also suitable for analysis of deeper layers within thin
samples (transmission mode). Classical EM requires high
vacuum and surface sputtering of non-conductive materials
to obtain high-resolution images of dry samples (Jansen et al.
2008 ). The development of the environmental scanning
elec-tron microscope (ESEM) made possible the analysis of wetter
and non-sputtered samples in a low vacuum environment.
The structure-property relationships of wood was
investi-gated by EM and ESEM ex situ and in situ (Tabarsa and Chui
2000 ; Sippola and Fr ü hmann 2002 ; Fr ü hmann et al. 2003 ;
M ü ller et al. 2003 ; Vasic and Stanzl -Tschegg 2006 ). While
optical microscopy was mainly used for ex situ observations,
EM and especially ESEM are very suitable for various in situ
experiments to evaluate crack propagation and reaction to load
(Sippola and Fr ü hmann 2002 ; Fr ü hmann et al. 2003 ; M ü ller
et al. 2003 ; Vasic and Stanzl -Tschegg 2006 ). Both methods
have certain disadvantages for in situ tests under
mechani-cal load: during sample preparation, defects can be induced
(Jansen et al. 2008 ). To obtain 3D information from the 2D
data of EM or optical microscopy, the sample has to be cut
into thin slices after experimentation (Dodd 1948 ). The more
convenient X-ray tomography became available only in the
last two decades, with the help of which spatial information
can be gained, ranging from the classical computed
microto-mography X-ray (Steppe et al. 2004 ; Scholz et al. 2010 ) to
synchrotron microtomography. The latter yields the highest
possible resolution and high brilliance. The associated data
processing allows acquisition of spatial information even of
subcellular structures with a resolution of 0.35
μ m (Groso et
al. 2006 ; Stampanoni et al. 2006a,b ) and observations of
dif-ferent anatomical elements. Both methods provided useful
data from in situ mechanical experiments with wood (Trtik
et al. 2007 ; Walther and Thoemen 2009 ; Hass et al. 2010 ;
Mannes et al. 2010 ), either by means of manual or automatic
testing devices (Badel et al.
2008
; Forsberg et al.
2008
).
Suitable testing devices seem to be a bottleneck in this type
of experiments.
A special device was constructed and a suitable sample
geometry was developed with a defi ned failure area in the
fi eld of view of the synchrotron-based tomographic
micros-copy (SbTM). The goal was to obtain in situ tomographies of
a sample submitted to increasing force levels in the
longitu-dinal direction. Preliminary tests were performed on samples
with three different geometries. The expectation is that in the
future, series of experiments with various parameters can be
carried out based on the know-how of the presented
prelimi-nary observations.
Material and methods
Wood samples
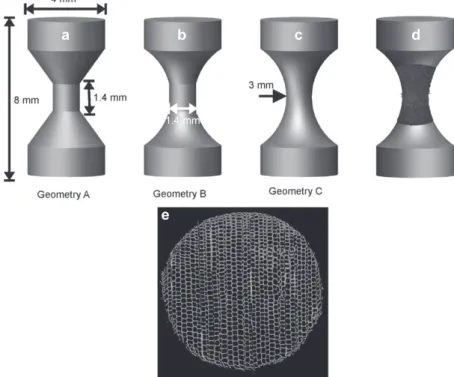
Beams of 10 mm thickness were turned to cylinders with 4 mm di-ameter for all sample shapes (Figure 1 ); then, the curvature was pro-duced through a copying process with a negative. Six samples (8 mm long and mirror-symmetrical through the cross section at the center) made of Norway spruce ( Picea abies [L.] Karst) were tested. The top and bottom parts for fi xation had the dimensions of 4 mm diameter with a length of 1.5 mm. The middle part of the specimens with a length of 5 mm differed between the three geometries. For two of the samples, the center part was cylindrical with a diameter of 1.4 mm (geometry A and B), one shape connecting the center and the top part with a linear change (geometry A); for the second shape, a curved
junction was used (geometry B). In the third sample, a curve with a 3-mm radius connected the top and bottom parts directly (geometry C), with a smallest diameter of 1.4 mm.
Experimental device
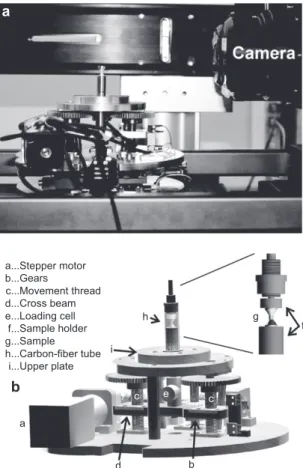
Because of the high energy during the scanning procedure, an ex-ternally controlled loading device was necessary to compress a sample in situ. A special device had to be built (Figure 2 a) to fi t the restrictions at the To mographic M icroscopy and C oherent R a diology Experimen t s (TOMCAT, PSI, Villigen, Switzerland) beamline with 2 kg maximum weight of the experimental setup and various spatial restrictions. For a broad range of future applications, the require-ments were 12 mm traveling distance for the crossbeam, possibility of different loading modes, a maximum static load of 1 kN, and fast removal of the sample. Controls of the device were implemented into the PSI system, while a different system exists for independent experi-ments outside the beamline. The travel distance is controlled through the number of steps necessary by the motor. Strain has to be calcu-lated in the tomography due to the indirect length measurement.
The details are visible in Figure 2b. The bottom part provides the necessary force in the form of rotational movement of a stepper motor (a) and a series of gears (b). The moved threads (c) are con-nected to a crossbeam. This leads to a longitudinal movement of the crossbeam (d) when the motor rotates. A load cell (e) for the force measurement is placed in the middle of the machine connected to the crossbeam on one side and the sample holder (f) on the other. The second sample holder is connected to the exchangeable tube (h) at the top of the machine. The lower end of the tube is fi xed on the upper plate (i) through a thread, while the upper end is connected to the upper sample holder. It acts as the counter hold for the movement of the sample. Owing to the low absorption coeffi cient of carbon re-garding X-rays and because of mechanical stability, carbon fi ber was
1.4 mm
a
b
e
c
d
Figure 1 Wood sample geometries with different connections between the bases. (a) Straight, (b) curved to straight, (c) curved, (d) fi eld of view of a sample with regard to the sample size, (e) cross section of compressed sample.
used for the tube. For compression, the sample holder consists of two parts with circular cuts with a depth of 1 mm to center the sample. The upper sample holder possesses a ball joint for the automatic ad-justment of the sample while exerting force.
For changing the sample and the loading conditions, the tube has to be removed. The loading case can be changed to tension, com-pression, and bending by small modifi cations of the top part of the construction consisting of the tube and the sample holdings. For the time being, the measurements were not as accurate as they should be because of the insuffi cient insulation of the connecting cables for motor controlling and force measurement.
Scanning procedure
TOMCAT beamline was adjusted to the lowest possible energy (10 keV) in absorption mode. During the recordings, the climate was 23 ° C and 63 % RH. To increase the quality of the recording, the sample was placed as close as possible to the camera for absorption mode. Taking one tomography with 1501 projections, 5 darkfi eld pictures and 160 fl ats took 11 min. The camera had a × 4 objective, with a fi eld of view of 3.7 mm producing a resolution of 1.8 × 1.8 × 1.8 μ m 3 per voxel.
The procedure for a complete loading cycle was identical for all tested sample geometries. First, a preload of 2 N was applied to ensure fi xation and avoid movement of the sample during the fi rst tomogra-phy. After taking this tomography that resembled the initial state, the sample was loaded through a movement of the crossbeam over a fi xed
a... b... c... d... e... f... g... h... i...
b
a
h i g f b d a c e c Stepper motor Gears Movement thread Cross beam Loading cell Sample holder Sample Carbon-fiber tube Upper plateFigure 2 (a) Loading device mounted on the cross table of the beamline – without surrounding tube. (b) CAD design of the testing machine with a close up of the sample holders – f.
distance. After reaching the position, the crossbeam stopped while the tomography of the sample was executed. This loading procedure step was repeated until the sample showed a failure area over the whole cross section in the tomography. The distances for each step (except the last) were 0.04 mm with a speed of 0.01 mm s -1 . Subsequently, the specimen was loaded until sliding occurred, and the compres-sion could be seen through an increased thickness or slight buckling. Finally, a tomography of the broken state was taken.
Reconstruction and image processing
The X-ray projections were reconstructed to spatial information at the facility. The reconstruction of one tomography produced a stack of 2048 subsequent slices of size 2048 × 2048 pixels each, represent-ing the fi eld of view (3.7 × 3.7 × 3.7 mm 3 ) in these experiments (Figure 1 d). Taking a tomography after every loading step, results were in a series of fi ve to seven fi les for every specimen. First, data reduction was needed. As the fi eld of view is larger than the smallest sample diameter of 1.4 mm, the picture can be cropped, and the size there-fore reduced by a factor 4. Then, the failure region was determined, and only slices close to this region were considered for further eval-uation, leading to another data reduction. To fi t the samples to the wood-based coordinate systems with tangential, radial, and cross-sectional directions, the stacks were realigned, so that the x and y axis in the fi gures represent the tangential and radial alignment, while the z equals the subsequent longitudinal direction. Finally, the noise in the pictures caused by the absorption of the surrounding carbon fi ber tube and air had to be eliminated. Those disturbances with a lower absorption than wood, as well as other nonsample-related effects, were reduced by approximating the absorption regions of wood and of the carbon fi ber tube with histograms of an uncropped picture and a cropped one. When cropped, the percentage of surrounding area to wood drops signifi cantly. This is visible in the histogram through a change in the ratio of the partly separated Gaussian curves for wood and air. Through this, a global threshold cropping the lower values can be approximated to clean the slices for a fi rst impression of the suit-ability of the in situ measurements. To further reduce noise caused by movements of the sample during the tomography and remaining noise due to various effects, connected regions in the stacks were identifi ed with MATLAB (The Mathworks, Inc., Natick, MA, USA), and small regions in the lumen related to noise were deleted. Figure 1e shows an example of a cleaned slice. Further, to identify the single tracheids, the area was cut to a small area surrounding the tracheid, and in the fi rst and last slices, they were isolated. Wood rays and bordered pits were closed through a morphological close operation, and the lumen was identifi ed. The space of the lumen was then dilated to show cell walls and connected features (wood rays, parts of connected tracheids).
The fi ltered stacks were used to identify the origin and develop-ment of failure areas. The resin channels turned out to be mostly undeformed; thus, they were used for distance measurements. In the process, the distance between two such structural elements in the center of the sample located at opposite ends was measured at the different loading steps. The displacement of the tracheids was deter-mined by the change of fi rst to last slice.
For the 3D presentation of the sample cuts and tracheids, the stan-dard software package of ImageJ 1.42q (http://rsb.info.nih.gov/ij) was available.
Results and discussion
Two specimens of each sample shape were tested. As expected,
geometry A and B broke at the transition of the cylindrical to
a
b
c
d
e
f
g
h
i
j
k
l
Figure 3 Successive tomographies of a sample at increasing force levels. Left column radial and right tangential view; (a) and (b) initial state, (c) to (l) 1. to 5. Step.
the cone-shaped geometry with a small shear failure involved.
Geometry C broke at the center nearly without detectable
bending. So the behavior of one wood sample with the
rota-tionally symmetric shape C will be described in detail. Six
successive tomographies at increasing load levels were taken.
The effects of increasing compression will be discussed based
on tangential and radial reconstructions (Figure 3 a – l) through
(1) (2) (3) (4) (5) (1) (2) (3) (4) (5) (1) (2) (3) (4) (5)
a
b
c
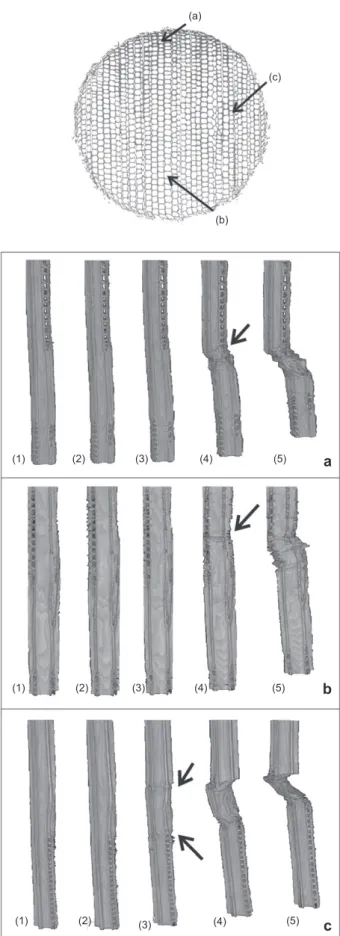
(a) (c) (b)Figure 4 Deformation of single tracheids of (a) LW, (b) EW, and (c) between LW and EW. Initial state is presented in (1), 1. – 4. com-pression steps in (2) – (5).
the center corresponding to each loading step. The subsequent
change of three single tracheids of the same sample is shown
with Figure 4 a – c. Their position can be seen in the cross
sec-tion of Figure 4.
The initial, uncompressed (unloaded) state of the sample
can be seen in the corresponding radial (Figure 3a, equal to
the lower half of Figure 1e) and tangential (3b, equal to left
half of Figure 1e) planes and serve as reference for the loaded
stages. In this tomography, the basic structure of the sample
can be described. In the center of the sample cell walls
rang-ing from EW to LW, no complete growth rrang-ing is included
(also in Figure 1e). Four radial resin channels (Figure 3a),
partly fi lled with resin, can be seen. Defects due to machining
are visible in the form of two to three compressed cells at the
surface, with no premature damage in the inner regions. The
three selected tracheids show no signs of predamage in their
initial state (Figure 4a – c1).
After the fi rst loading step (Figure 3c and d), the sample
does not show signs of compression in the fi eld of view.
Accordingly, the single tracheids (Figure 4a – c2) correspond
to the initial state (4a – c1). Presumably, deformations
hap-pened in the elastic regime. The absence of displacements can
also be explained by the fact that only half of the sample is
in the fi eld of view. Thus, compression could have occurred
in parts outside of the recorded area. The sample was perhaps
further pressed into the clamps and aligned. Furthermore, due
to the long recording time of 11 min, in comparison with the
short relaxation time for small forces, elastic deformations
could have been reversed.
After applying the next loading step, the sample shows
fi rst signs of plastic deformation that are not visible on the
surface of the sample and limited to about a quarter of the
cross section (Figure 3e, f). The displacement in the fi eld of
view is 0.004 mm. Figure 3f shows no signs of
compres-sion due to the failure area not spanning the whole sample.
The LW and the EW tracheids (Figure 4a – b3) close to the
3f cross section are equally compressed (Table 1
), while the
tangential shear is lower for the EW tracheids. In the middle
of the sample at the left border in Figure 3e, the buckling
of the fi rst cells can be observed. The failure occurs in a
stepped shape (indicated by the black lines) without a direct
connection in this plane. These cells are the origin of a part
of the failure line that subsequently develops because of the
increasing compressive load. In Figure 4c3, a double
buck-ling (equivalent Figure 3g) of the tracheids can be seen. The
compression is lower than for the other tracheids. In
con-tradiction to the expected outcome, the fi rst collapsing cells
were partly LW cells and not the less stable EW cells. One
possible explanation is the machining and the subsequent
damage at the surface of the sample where the LW cells are
located. The failure area essentially shows mostly cell walls
collapsed at one point.
When the load is further increased, the displacement
from the reference state is 0.03 mm. The failure line caused
by buckling expands further and reaches over the middle
of the samples ’ cross section (Figure 3g and h). The fi rst
failures connect to a failure line visible in Figure 3g
with-out further expanding in length and stopping at a wood ray
crossing the line. A second failure line starts to develop
above the fi rst at an angle of 25
° to the other one at the
surface. This second one crosses two thirds of the sample
and nearly reaches the other end of the picture. The two
failure areas connect at a small area where cells have
buck-led twice at different heights, as can be seen for tracheids
of Figure 4c4.
The top and bottom of the tracheids are displaced, while
the middle part between the collapsing area is
uncom-pressed, leading to a slightly lower compression (Table 1)
than for the LW tracheids (Figure 4a4). In the tangential
direction, a collective of compressed and deformed fi bers
start to push out at the edge of the specimen. The span
of the failure area can partly be seen in Figure 3h, where
the failure line spans the complete section with one
con-nected line. The EW cell (Figure 4b4), situated close to
the left end of Figure 3h, shows buckling. The relative
shear is lower than for the other tracheids (Table 1). At
this point, the behavior of the wood rays can also be seen.
Where the failure area crosses a ray, it either bends (Figure
3g), or the upper and lower parts are shifted against each
other with one cell row collapsing, while still
maintain-ing their original orientation. The failure line did not cross
a resin channel, which could be due to the higher
stabil-ity of the resin or because of the positions. The force still
increased for this compression step in relation to the
pre-vious one. Although failure continued and the maximum
load observed was reached in this step, the compression
failure could have happened in this or the following step.
A slight blurring of the parts deforming could be due to a
microdisplacement of these areas during the tomography
due to the ongoing relaxation.
Further increasing the compression leads to the fi rst failure
area expanding until it spans the whole sample (Figure 3i, j).
The thickness also increases as more cell walls collapse, and
the failure areas begin to merge. This leads to a higher density
in the corresponding area and stabilization of the two failure
lines, consequently leading to a slipping plane and provoking
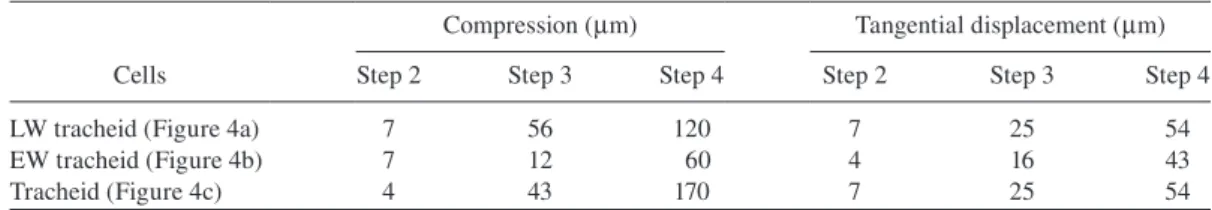
Table 1 Compression and displacement of upper against lower end of tracheids a – c of Figure 4.
Cells
Compression ( μ m) Tangential displacement ( μ m)
Step 2 Step 3 Step 4 Step 2 Step 3 Step 4
LW tracheid (Figure 4a) 7 56 120 7 25 54
EW tracheid (Figure 4b) 7 12 60 4 16 43
the cells between those areas to tilt relative to the cells outside
the connecting area. The displacement of the sample is 0.09
mm and therefore twice as high compared to the difference
between the third and fourth step. At this point, sliding begins
to occur along the main failure area, and as the
compres-sion of the cells advances, they continue to push out of the
surface. All tracheids are rapidly deformed (Figure 4a – c5).
The tracheid in Figure 4c5 shows the highest deformation
increase (Table 1) of nearly four times compared to the last
step, mainly in the region between the failure lines. The only
radial transformation of 0.007 mm can be observed for the
LW tracheids.
For the last loading step, the traveling distance was
increased leading to a deformation of 0.250 mm. Basically,
the mechanisms encountered in the last two steps are further
intensifi ed (Figure 3k, l). Already collapsed cells continue to
collapse further, and the two failure lines, which were
sepa-rated in the last tomography, merge through a complete
col-lapse of the cells between them. It forms a slightly broader
failure area in the middle, which acts as a sliding plane. The
sample breaks into two different sections along the failure
line that slide against one another. Even in this state of load
with high movement and high relaxation times, smaller
structures like bordered pits and wood rays are still clearly
visible.
Conclusions
In experiments done with SbTM and with the testing device
constructed, the development of failure areas can be clearly
seen, and the behavior of single tracheids can be observed.
Cell structures like bordered pits stay recognizable under load.
After the fi rst step, the sample is still in the elastic range of
mechanical response, and no displacement is visible. The fi rst
deformation can be seen originating from the border areas,
possibly due to the weakened structure there. LW cells with
their higher density collapse fi rst. Further increasing the load
entails an increment of failure area not only in one direction,
instead of the failure area branches, and provides two
lay-ers. Subsequently, the main branch continues to develop and
integrates the smaller one, until macroscopic failure of the
sample occurs. During the whole loading process, only
trac-heids are deformed and broken, while resin channels remain
unchanged. Wood rays are stable, until the load increases over
a certain level and subsequently are completely compressed.
Despite its preliminary character, this study shows that the
method is suitable for the observation of failure mechanisms
of wood.
Acknowledgments
We want to thank the staff of the TOMCAT beamline at SLS in Villigen: Especially Andreas Isenegger and Gordan Mikuljan for their technical assistance in implementing the loading device and controls into the Tomcat System, as well as Federica Marone and Sarah Catherine Irvine for their assistance while using the beamline. Finally, we want to thank Peter Jenni of the mechanical workshop at
D-Baug for assembling the loading device. This work was supported by the European Cooperation in the fi eld of scientifi c and technical research (COST, Action FP0802).
References
Badel, E., Delisee, C., Lux, J. (2008) 3D structural characterisation, deformation measurements and assessment of low-density wood fi breboard under compression: the use of X-ray microtomogra-phy. Compos. Sci. Technol. 68:1654 – 1663.
Butterfi eld, B.G., Meylan, B.A. Three-Dimensional Structure of Wood. Chapman and Hall, London and New York, 1980. Dodd, J.D. (1948) On the shapes of cells in the cambial zone of Pinus
silvestris L. Am. J. Bot. 35:666 – 682.
Forsberg, F., Mooser, R., Arnold, M., Hack, E., Wyss, P. (2008) 3D micro-scale deformations of wood in bending: synchrotron radiation muCT data analyzed with digital volume correlation. J. Struct. Biol. 164:255 – 262.
Fr ü hmann, K., Burgert, I., Stanzl-Tschegg, S.E. (2003) Detection of the fracture path under tensile loads through in situ tests in an ESEM chamber. Holzforschung 57:326 – 332.
Groso, A., Abela, R., Stampanoni, M. (2006) Implementation of a fast method for high resolution phase contrast tomography. Opt. Express 14:8103 – 8110.
Hass, P., Wittel, F.K., McDonald, S.A., Marone, F., Stampanoni, M., Herrmann, H.J., Niemz, P. (2010) Pore space analysis of beech wood: the vessel network. Holzforschung 64:639 – 644. Hofstetter, K., Hellmich, C., Eberhardsteiner, J. (2005) Development
and experimental validation of a continuum micromechan-ics model for the elasticity of wood. Eur. J. Mech. A – Solid 24:1030 – 1053.
Jansen, S., Pletsers, A., Sano, Y. (2008) The effect of prepara-tion techniques on SEM-imaging of pit membranes. IAWA J. 29:161 – 178.
Keunecke, D., Eder, M., Burgert, I., Niemz, P. (2008) Microme-chanical properties of common yew (Taxus baccata) and Nor-way spruce (Picea abies) transition wood fi bers subjected to longitudinal tension. J. Wood Sci. 54:420–422.
Mannes, D., Marone, F., Lehmann, E., Stampanoni, M., Niemz, P. (2010) Application areas of synchrotron radiation tomographic microscopy for wood research. Wood Sci. Technol. 44:67 – 84. M ü ller, U., Gindl, W., Teischinger, A. (2003) Effects of cell anatomy
on the plastic and elastic behaviour of different wood species loaded perpendicular to grain. IAWA J. 24:117 – 128.
Scholz, G., Zauer, M., Van den Bulcke, J., Van Loo, D., Pfriem, A., Van Acker, J., Militz, H. (2010) Investigation on wax-impreg-nated wood. Part 2: Study of void spaces fi lled with air by He pycnometry, Hg intrusion porosimetry, and 3D X-ray imaging. Holzforschung 64:587 – 593.
Sippola, M., Fr ü hmann, K. (2002) In situ longitudinal tensile tests of pine wood in an environmental scanning electron microscope. Holzforschung 56:669 – 675.
Stampanoni, M., Groso, A., Isenegger, A., Mikuljan, G., Chen, Q., Bertrand, A., Henein, S., Betemps, R., Frommherz, U., Bohler, P., Meister, D., Lange, M., Abela, R. (2006a) Trends in syn-chrotron-based tomographic imaging: the SLS experience. 5th Conference on Developments in X-ray Tomography. Ed. Bonse, U. San Diego, CA, Vol. 6318. pp. U199 – U212.
Stampanoni, M., Groso, A., Isenegger, A., Mikuljan, G., Chen, Q., Meister, D., Lange, M., Betemps, R., Henein, S., Abela, R. (2006b) TOMCAT: a beamline for TOmographic Microscopy and Coherent rAdiology experimenTs. 9th International Conference
on Synchrotron Radiation Instrumentation (SRI 2006). Eds. Choi, J.Y., Rah, S. Daegu. South Korea. Vol. 879. pp. 848 – 851. Steppe, K., Cnudde, V., Girard, C., Lemeur, R., Cnudde, J.P., Jacobs,
P. (2004) Use of X-ray computed microtomography for non-invasive determination of wood anatomical characteristics. J. Struct. Biol. 148:11 – 21.
Tabarsa, T., Chui, Y.H. (2000) Stress-strain response of wood under radial compression. Part I. Test method and infl uences of cellular properties. Wood Fiber Sci. 32:144 – 152.
Trtik, P., Dual, J., Keunecke, D., Mannes, D., Niemz, P., Stahli, P., Kaestner, A., Groso, A., Stampanoni, M. (2007) 3D imaging of microstructure of spruce wood. J. Struct Biol. 159:46 – 55.
Vasic, S., Stanzl-Tschegg, S. (2006) Experimental and numerical investigation of wood fracture mechanisms at different humidity levels. 7th World Congress on Computational Mechanics. Los Angeles, CA. Vol. 61. pp. 367 – 374.
Wagenf ü hr, R. Holzatlas. Fachbuchverlag Leipzig/Carl Hanser Verlag, Leipzig, 2007.
Walther, T., Thoemen, H. (2009) Synchrotron X-ray microtomogra-phy and 3D image analysis of medium density fi berboard (MDF). Holzforschung 63:581 – 587.
Received September 26, 2011. Accepted May 2, 2012 . Previously published online June 15, 2012.