Patient satisfaction with anaesthesia care: development of a
psychometric questionnaire and benchmarking among six
hospitals in Switzerland and Austria
²³
T. Heidegger
1*, Y. Husemann
2, M. Nuebling
3, D. Morf
4, T. Sieber
4, A. Huth
5, R. Germann
5,
P. Innerhofer
6, A. Faserl
6, C. Schubert
7, C. Geibinger
7, K. FluÈckiger
8, T. Coi
8and
G. KreienbuÈhl
11
Department of Anaesthesiology, St Gallen Cantonal Hospital, Rorschacherstrasse 95, CH-9007 St Gallen,
Switzerland.
2Picker Institute Europe, Zug, Switzerland.
3Empirical Consulting, Freiburg, Germany.
4Department of Anaesthesiology, RaÈtisches Cantonal Hospital, Chur, Switzerland.
5Department of
Anaesthesiology and Intensive Care Medicine, Landeskrankenhaus Feldkirch, Austria.
6Department of
Anaesthesiology and Critical Care Medicine, The Leopold-Franzens-University of Innsbruck, Austria.
7
Department of Anaesthesiology, St Vincent's Hospital, Linz, Austria.
8Department of Anaesthesiology,
University Hospital of Bern, Switzerland
*Corresponding author
Background. We describe the development and comparison of a psychometric questionnaire on patient satisfaction with anaesthesia care among six hospitals.
Methods. We used a rigorous protocol: generation of items, construction of the pilot questionnaire, pilot study, statistical analysis (construct validity, factor analysis, reliability analy-sis), compilation of the ®nal questionnaire, main study, repeated analysis of construct validity and reliability. We compared the mean total problem score and the scores for the dimensions: `Information/Involvement in decision-making', and `Continuity of personal care by anaesthetist'. The in¯uence of potential confounding variables was tested (multiple linear regression). Results. The average problem score from all hospitals was 18.6%. Most problems are men-tioned in the dimensions `Information/Involvement in decision-making' (mean problem score: 30.9%) and `Continuity of personal care by anaesthetist' (mean problem score: 32.2%). The overall assessment of the quality of anaesthesia care was good to excellent in 98.7% of cases. The most important dimension was `Information/Involvement in decision-making'. The mean total problem score was signi®cantly lower for two hospitals than the total mean for all hospitals (signi®cantly higher at two hospitals) (P<0.05). Amongst the confounding variables considered, age, sex, subjective state of health, type of anaesthesia and level of education had an in¯uence on the total problem score and the two dimensions mentioned. There were only marginal differ-ences with and without the in¯uence of the confounding variables for the different hospitals. Conclusions. A psychometric questionnaire on patient satisfaction with anaesthesia care must cover areas such as patient information, involvement in decision-making, and contact with the anaesthetist. The assessment using summed scores for dimensions is more informative than a global summed rating. There were signi®cant differences between hospitals. Moreover, the high problem scores indicate a great potential for improvement at all hospitals.
Br J Anaesth 2002; 89: 863±72
Keywords: anaesthesia, audit; research, anaesthesia; measurement techniques, outcome; surgery
Accepted for publication: July 30, 2002
²Declaration of interest. Y. Husemann is the country manager of the Picker Institute Europe in Switzerland, which partly funded this study.
³Some of the data were presented at the meeting of the European Society of Anaesthesiology (Gothenburg, April 2001), and published in abstract form (Eur J Anaesthesiol 2001; 18: A12).
The evaluation of the quality of patient care depends on the level at which the assessment is conducted.1 From the
patient's point of view, the quality of the outcome is of major importance.2 The evaluation of patient satisfaction
based on their subjective perception of the quality of the process forms an important part of this.1±4Previous projects
to develop questionnaires on patient satisfaction with anaesthesia care have paid too little or no attention to two aspects.5±7First, the involvement of patients when
develop-ing the questions, and second, proceeddevelop-ing accorddevelop-ing to a strictly de®ned plan using a psychometric procedure with a multi-item questionnaire. The results of single-item ratings regularly produce high scores but do not re¯ect the true nature of the anaesthesia care.5 8The modern approach to
quality measurement takes account not only of results from the researcher's hospital, but also compares these results with those from other hospitals in the form of benchmark-ing. Papers published so far from the area of anaesthesia have mainly compared anaesthesia-related incidents and complications, and not the quality of the outcome, that is, the degree of patient satisfaction with anaesthesia care.9 10
The effects of confounding variables on patient satisfaction with anaesthesia care have been studied infrequently.5 6The
aim of this project was to develop a psychometric questionnaire in cooperation with patients to assess their satisfaction with anaesthesia care. Furthermore, we com-pared the degree of patient satisfaction with different dimensions in six hospitals as a benchmarking study and, in doing so, took account of the possible effects of ten potentially confounding variables.
Methods
Generation of items
A questionnaire must contain items on all factors important to the relevant domain. This is called content validity.11
After ethics committee approval and informed consent were obtained, we conducted four focus groups with patients who had been in the care of the anaesthetic teams because of elective surgery in the past 3 months and had been
discharged more than 1 week before (January 2000). The discussion guide was formulated using an expert question-naire (unpublished data), with the items in chronological order. The focus groups were led by a psychologist. The interviews were recorded on tape and also documented in the form of contemporaneous notes. Each group consisted of 6±11 patients. We also incorporated input from anaesthe-tists, nurse anaestheanaesthe-tists, administrative assistants and published literature.
Construction of the pilot questionnaire
For the construction of the pilot questionnaire, the items were grouped in chronological order based on the usual course of treatment. Before constructing the pilot question-naire, we tested the items for comprehensibility and readability on lay members of staff. The questions were aimed at patients who had undergone elective surgery under general or regional anaesthesia. The pilot questionnaire contained questions on the instrument itself (Table 1), questions on the patient's overall impression, and space for free comment.
Pilot study
The pilot study was conducted in April 2000 in two tertiary care hospitals in eastern Switzerland. Patients aged 16 yr and older were enrolled in the study. Out-patients and emergency admissions were excluded. The questionnaires were sent to the patients together with an accompanying letter and a stamped, addressed envelope. By including all eligible patients, the aim was to receive 100 completed and evaluable questionnaires per hospital. Questionnaires were sent to 200 patients from each hospital, 2 weeks after discharge. If no response was received after a further 2 weeks, a second questionnaire was sent with a reminder letter.
Final questionnaire
The ®nal questionnaire was applied between September 2000 and January 2001 in six major hospitals in Switzerland
Table 1 Questions on the pilot instrument
Questions Possible answers
How long did it take you to complete this questionnaire? Answer in minutes
How easy was it to answer this questionnaire? Very easy; easy; quite dif®cult; very dif®cult
How easy was the questionnaire to understand? Very easy to understand; easy to understand; quite dif®cult to understand; very dif®cult to understand
In your opinion, which questions should be made easier to understand? Code (number) of question(s) In your opinion, did the questionnaire ask all the important questions
related to anaesthesia? yes ± completely; yes ± somewhat; no In your opinion, which questions were not asked in the questionnaire? Space for free comment
and Austria. The number of beds at each hospital ranged from 250 to 1480, and the number of anaesthetics per year from 5100 to 28 700. A total of 3785 questionnaires were sent to patients 1±2 weeks after discharge. The aim was to obtain at least 300 evaluable questionnaires from each hospital. Non-respondents were sent a second questionnaire 2 weeks later, together with a reminder letter.
The analysis of the construct validity and the creation of the dimensions with reliability analysis was repeated. Using standardized beta weights, we then calculated how great the relative in¯uence of each of the dimensions was (importance).11
We also compared some perioperative characteristics (ASA class, extent of surgery, length of hospital stay, type of anaesthesia) of non-respondents to assess selection bias and representativeness.
Benchmarking
The comparison was based on the means of the total problem score and the two most frequently mentioned dimensions with problems (`Information/Involvement in decision-making' and `Continuity of personal care by anaesthetist'). Possible effects of the following variables on the frequency of problems in each dimension were investigated: age, sex, state of health, length of hospital stay, extent of surgery, ASA class, type of health insurance, number of hospital stays in the past 6 months, type of anaesthesia, and level of education. If an in¯uence was found, we investigated whether the composition of the patient sample from the hospitals (`case-mix') involved was the reason for the distortion of the benchmarking values. This made it possible to adjust the comparison between the individual hospitals for the confounding variables (i.e. to take into account effects caused by different composition of the patient samples). For the comparative analysis, the mean value over all hospitals (the total problem score and the scores for the two above-mentioned dimensions) were taken as reference. The hospitals were given letter codes A±F to preserve anonymity.
Statistical analysis
Pilot study: validity and reliability
The ®ndings of the pilot study were ®rst of all subject to a missing-value analysis in order to establish whether the questions or navigational instructions should be made more speci®c. Subsequent analysis of distributions was conducted in order to eliminate items with very skewed distributions. The content validity of the pilot instrument was further checked using a free-comment question asking for `missing questions in the questionnaire' (Table 1). All individual questions that measured potential problems were dichotom-ized (i.e. were assigned to one of two groups depending on whether a problem was mentioned). For example, for the
question: Did you feel that you were adequately involved in the decision on the choice of anaesthesia? The following answers were possible: yes ± completely (not a problem response); yes ± to a certain extent, and no (problem responses).
An individual global summed problem score was calcu-lated on the basis of this problem rating (proportion of problems mentioned for all relevant questions). We checked for construct validity by establishing with multiple linear regression whether the single items had an in¯uence on the different aspects of overall care (for example: How would your rate the overall care you received for your anaesthe-sia?) or on the global summed problem score. If an item was of low statistical importance, we had to decide whether to retain or exclude it, based on its content.
Creation of dimensions
We then created higher-level dimensions to categorize the patient's perception of quality on the basis of these individual problem ratings. To achieve this, we ®rst of all subjected all problem indicators to exploratory factor analysis (principal component analysis, varimax rotation, scree test), to determine the number of dimensions that could be created from the problems mentioned.12
The internal consistency of the dimensions determined by factor analysis was then checked using reliability analysis. We calculated Cronbach's coef®cient alpha.7 11 A score
from 0 to 100 was then calculated for each dimension, which re¯ected the proportion of problem ratings in the respective area. The results of this analysis were discussed and the questionnaire was modi®ed accordingly for the main survey.
Comparison of the hospitals and in¯uence of
potential confounding variables
The mean problem scores between the hospitals were compared using analysis of variance and simple linear regression, with the total mean problem score as one reference and the best value as the second. The effects of the potential confounding variables on each dimension were ®rst determined univariately, followed by multivariate analysis using multiple linear regression (forward-stepwise method). In the case of signi®cant effects of these confounders, adjustment was performed. The ®ndings are expressed in per cent (mean) or as mean (SD). Ranges are
presented where appropriate. All analyses were conducted using the SPSS 10 analysis package (SPSS Inc. Chicago, IL, USA).
The multiple linear regression models, with and without adjustment for the confounding variables, are presented in the appendix.*
*The appendix is available to subscribers with the online version of the journal at the journal website.
Results
Focus groups
Table 2 summarizes the results from the focus groups.
Pilot questionnaire
The pilot questionnaire consisted of eight speci®c areas with a total of 53 questions. The areas were: before admission, patient information, day of anaesthesia, preparation for anaesthesia, during surgery (regional anaesthesia only), recovery room, return to the ward, and anaesthetist/nurse anaesthetist.
The overall response rate (including responses to reminder letters) was 61%. Ninety-three percent of respond-ents said the questionnaire was very easy or easy to complete, and 96% said it was very easy or easy to understand. Ninety percent of respondents completed the questionnaire within 20 minutes. Eighty-nine percent of respondents felt that all important questions related to anaesthesia had been asked, and 9% that some of them had been asked.
Pilot study
Missing-value analysis
Additional categories were incorporated into the ®nal questionnaire, such as the possible response: I underwent combined (regional and general) anaesthesia, for the question on the type of anaesthesia.
Analysis of distribution
Some questions, particularly those that assessed overall satisfaction, showed very skewed distributions. The ques-tion `Would you recommend the anaesthesiologist who looked after you to your family and friends?' was excluded from the ®nal questionnaire for this reason.
Only a few suggestions for missing questions were received, which supports the content validity of the pilot instrument. Additional questions suggested by patients therefore only resulted in minor modi®cations to the list of questions and were mainly related to the long-term after-effects of anaesthesia.
The analysis of construct validity using multiple linear regression of each individual aspect on the overall satisfac-tion was performed to establish the importance of individual
aspects in the overall assessment. Since the questions on the overall impression (for example: How would you rate the overall assessment of care you received for your anaesthe-sia) were only of limited suitability because of their extremely skewed distributions (only 0.5±1.8% of all ratings were fair and poor), this analysis was primarily based on the global summed problem score. Taking into account the eight most important items, this resulted in an R2value of
0.85.
The factor and reliability analysis to enable grouping of the individual aspects into problem dimensions resulted in three scales with a Cronbach's alpha of >0.7 each (`Information/Involvement in decision-making/Continuity of personal care by anaesthetist'; `Respect/con®dence' and `Delay management'), and two scales with a Cronbach's alpha <0.7 (`Pain management' and `Nursing care in the recovery room').
Final questionnaire
A total of 2348 questionnaires from six hospitals were included in the analysis. The response rate was 62% (including responses to reminder letters) (range 53±69%). The age range of the respondents was 16±92 yr, and the female:male ratio was 51:49.
The analysis of the perioperative characteristics of the non-respondents showed that the type of anaesthesia and the extent of surgery had no in¯uence on participation. The duration of the hospital stay (non-respondents had stays of 1 day less) and the ASA class (the patients in higher classes were slightly less prepared to participate) had a slightly positive effect on the readiness to participate amongst the respondents. Seen overall, any skew was minimal. The proportion of the declared variance in the readiness to participate was well below 0.5% in each case.
Creation and testing of dimensions
A total of 29 dichotomous problem ratings were included in the factor analysis. On the basis of the scree test,12 a
six-factor solution with an explained variance of 45.3% was selected as the best classi®cation. The subsequent reliability analysis essentially con®rmed the results of the factor analysis. The result showed that three of the dimensions had good internal consistency (Cronbach's alpha >0.7) and that two were of lower quality (Cronbach's alpha =0.43). The
Table 2 Results from focus groups
Anaesthetist Must create an atmosphere of calm and give competent and comprehensive information and respond to the needs of the patient Consultation before operation Enough time, undisturbed atmosphere; discuss risks and put them into perspective; use language which is easy to understand;
ideally the same person should perform the anaesthesia
Anxieties and fears Not to wake up from anaesthesia; pain during surgery; side-effects of regional anaesthesia (paralysis) On the day of the anaesthesia Long waiting periods were felt to be very unpleasant (especially if no reasons are given)
During surgery Regularly asking patients how they feel is important
Waking up from anaesthesia Thirst, pain; rapid information on the outcome of surgery is important Pain management Involve the patient; patient-controlled analgesia is appreciated
dimension `Nursing care in the recovery room' consisted of only two items (Cronbach's alpha =0.69) (Table 3). It was then possible to calculate for each patient the problem scores for the six dimensions as a percentage of the problem ratings he or she gave.
Validity
In a multiple linear regression model, all six scores for the dimensions made a signi®cant contribution (P<0.001) to the total summed problem score, which means that none of them was without importance in the total score. The analysis of the standardized beta weights (importance) showed that the dimension `Information/Involvement in decision-making' had by far the greatest in¯uence.
Table 4 shows the distribution of the potentially con-founding variables in the six hospitals. Table 5 shows the results of the univariate and multivariate analysis of the confounding variables considered. The results of the mul-tiple linear regression were as follows: (i) `Information/ Involvement in decision-making' was by far the most important dimension, with a beta coef®cient of 0.60.1Only
the confounding variables subjective state of health (the worse the state of health, the more critical the patient) and type of anaesthesia (patients who underwent general anaes-thesia were more critical) had an effect on the scores. (ii) `Continuity of personal care by anaesthetist' (problem score: 32.6%; beta coef®cient: 0.27) was in¯uenced only by the factors age (the older the patient, the less critical), sex (men were less critical), and level of education (less criticism from those with lower level). (iii) Mean total problem score (problem score 18.6%) was in¯uenced only by the factors age, sex, type of anaesthesia and subjective state of health (in accordance with the changes in the above-mentioned dimensions).
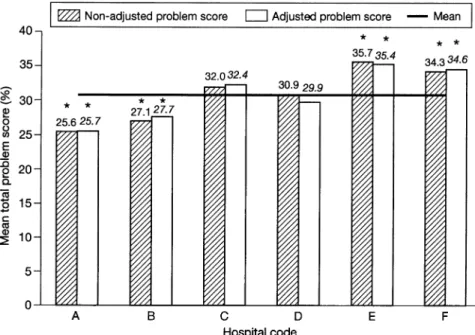
Figures 1±3 show the in¯uence of the confounding variables that had effects on the above two dimensions and the total problem score, and compare these for the six hospitals. It can be seen, for example, that for hospital D, the non-adjusted values for `Continuity of personal care by anaesthetist' were arti®cially elevated. This was because the average age of the patients at this hospital was lower (47.6 yr, as opposed to total mean of 52.7 yr); also, the level
of education of the patients at this hospital was higher. Since both variables implied a more critical attitude, the raw values (non-adjusted) were arti®cially elevated. This means that hospital D was at a disadvantage in the benchmarking process as a result of its patient case-mix. Overall, the values for the problem scores for the two dimensions differed only slightly before and after adjustment, since the patients at the six hospitals were very similar with regard to the confounding variables (age, subjective state of health) or the differences between the confounding variables at the individual hospitals led to only slight changes in the average problem scores (sex, level of education, type of anaesthe-sia). Comparison of the raw and adjusted values for the total problem score showedÐas for the two dimensionsÐan arti®cial elevation for hospital D (mainly because of the in¯uence of age; adjusted values were not signi®cantly above the total mean), and also an arti®cial lowering for hospital F (mainly in¯uenced by subjective state of health; adjusted values were signi®cantly higher than the total mean).
Discussion
The most important ®ndings were as follows: (i) A psychometric questionnaire for the assessment of patient satisfaction with anaesthesia care must cover areas such as patient information and involvement in decision-making, contact with the anaesthetist, con®dence, respect, and delay management. (ii) The most frequently mentioned problems from all hospitals were related to the dimension `Information/Involvement in decision-making' (30.9%), and `Continuity of personal care by anaesthetist' (32.2%). The values were lower than 10% for the other dimensions. (iii) By far the most important dimension was `Information/ Involvement in decision-making'. (iv) The evaluation of patient satisfaction with anaesthesia care based on the analysis of individual dimensions (mean total problem score 18.6%) was clearly superior to the global summed rating (98.7% `good' to `excellent') in terms of method. (v) Relevant differences with regard to patient satisfaction with anaesthesia care were found between the hospitals. (vi) The effects of the confounding variables considered on the number of problems mentioned in the six hospitals were
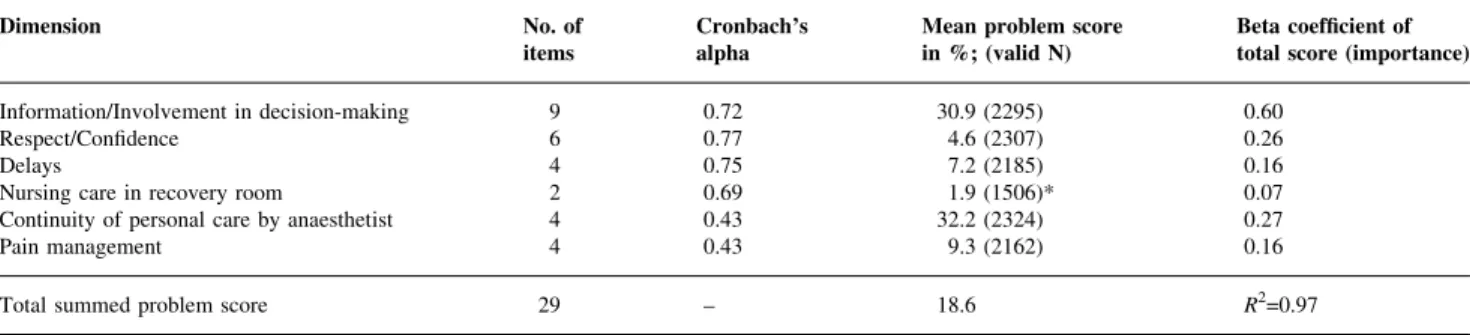
Table 3 Number of items and internal consistency of each dimension (Cronbach's alpha); means (%) of the individual problem ratings per dimension; importance of the individual dimensions in the total score for problem ratings. *Only patients who were in the recovery room or could remember being there
Dimension No. of
items Cronbach'salpha Mean problem scorein %; (valid N) Beta coef®cient oftotal score (importance) Information/Involvement in decision-making 9 0.72 30.9 (2295) 0.60
Respect/Con®dence 6 0.77 4.6 (2307) 0.26
Delays 4 0.75 7.2 (2185) 0.16
Nursing care in recovery room 2 0.69 1.9 (1506)* 0.07
Continuity of personal care by anaesthetist 4 0.43 32.2 (2324) 0.27
Pain management 4 0.43 9.3 (2162) 0.16
only slight. In terms of method, however, despite the fact that the effects measured here were slight, evaluation and statistical analysis of the relevance of these variables is indispensable in ensuring that the benchmarking process is not distorted by case-mix.
Limitations of the study
We did not conduct a `test-retest' procedure because we were of the opinion that it was too much to expect patients to complete a third, and possibly even a fourth, questionnaire,
Table 4 Distribution of potential confounding variables in the six hospitals (A±F). The ®rst row for each variable contains numbers of patients, based on the information available. The remaining data are percentages. The category codes (1) to (5) represent the numeric coding for each variable used in the multiple linear regression
Confounding variable Category code Hospital
A B C D E F Total
Subjective state of health (n) 360 360 396 349 443 377 2285
Excellent (1) 10.8 16.9 17.9 15.2 13.3 12.5 Very good (2) 32.8 38.1 32.6 36.1 28.7 31.8 Good (3) 41.9 35.0 35.1 33.8 39.5 37.7 Moderate (4) 12.8 9.7 11.6 12.9 17.2 14.6 Poor (5) 1.7 0.3 2.8 2.0 1.4 3.4 Mean 2.62 2.38 2.49 2.50 2.65 2.55 2.55 SD 0.90 0.89 1.00 0.97 0.96 0.96 0.9 ASA class (n) 374 369 407 357 458 383 2348 I (1) 25.9 44.1 57.2 42.3 41.5 34.5 II (2) 56.2 42.3 31.2 46.8 50.4 47.0 III (3) 17.4 13.3 11.1 10.9 8.1 18.0 IV (4) 0.5 0.3 0.5 0 0 0.5 Mean 1.93 1.70 1.55 1.69 1.67 1.85 1.72 SD 0.67 0.70 0.71 0.62 0.72 0.69 0.69 Age (n) 363 357 391 345 439 369 2264 Mean 55.4 54.1 50.6 47.6) 53.5 55.0 52.7 SD 17.7 17.1 17.9 17.1 16.3 17.6 17.4 Sex (n) 367 367 399 352 449 379 2313 Female (1) 48.2 40.3 58.4 52.0 60.6 44.9 Male (2) 51.8 59.7 41.6 48.0 39.4 55.1
Hospital stays in last 6 months (n) 355 330 366 327 422 346 2146
1 (1) 66.2 77.9 68.9 70.3 66.8 62.7
>1 (2) 33.8 22.1 31.1 29.7 33.2 37.3
Educational level (n) 355 347 384 341 447 368 2242
Primary school/basic schooling (1) 16.9 14.4 18.5 11.4 15.9 20.9 Secondary school/comprehensive (2) 16.9 11.2 8.1 7.0 11.6 4.3 Vocational school (3) 42.3 53.0 46.9 49.0 44.5 49.5 High school (4) 10.7 10.4 20.1 19.9 20.1 12.8 Technical college/university (5) 13.2 11.0 6.5 12.6 7.8 12.5 Mean 2.86 2.92 2.88 3.15 2.92 2.92 2.94 SD 1.21 1.11 1.13 1.10 1.12 1.23 1.15 Extent of surgery (n) 374 369 407 356 458 383 2347 Minor (1) 8.0 8.4 13.8 5.9 10.5 12.8 Moderate (2) 60.2 74.3 66.8 71.6 66.4 62.1 Major (3) 31.8 17.3 19.4 22.5 23.1 25.1 Mean 2.24 2.09 2.06 2.17 2.13 2.12 2.13 SD 0.59 0.50 0.57 0.51 0.57 0.60 0.56 Insurance (n) 365 364 388 347 444 379 2287 Standard (1) 60.8 63.2 85.1 83.0 78.6 69.4 Semi-private/private (2) 39.2 36.8 14.9 17.0 21.4 30.6
Duration of hospital stay (n) 374 369 405 354 458 383 2343
Mean 8.4 8.3 7.6 7.6 8.1 7.1 7.8
SD 7.0 6.3 7.4 7.8 6.9 7.4 7.15
Type of anaesthesia (n) 374 369 407 357 458 383 2348
General (1) 70.9 73.7 71.0 94.7 75.3 63.2
and also felt that this would considerably increase the effort required in terms of practicability and cost. The value of retesting with regard to reliability is also controversial. It is generally accepted that, in order to obtain reliable results, the focus should be on internal consistency.6
Although we had some perioperative characteristics from the non-respondents, we did not have further important additional information from these patients. In their study, Fung and Cohen13 also documented some personal details
(age, sex, type of surgery), but did not state why the non-respondents did not reply. It would also be interesting to hear these patients' opinions on their degree of satisfaction with their anaesthesia care. Socio-medical investigations have shown that non-respondents may evaluate care less favourably than those who do respond.14 In contrast,
however, Ware and co-workers15 found that patients who
were more satis®ed with their quality of care were less likely to return questionnaires.
Our response rate of 62% (n=2348) is lower than that achieved by Fung and Cohen (71%, n=45) and by Whitty and colleagues (73%, n=173).16 This may be because our
questionnaire was returned to an independent institute for evaluation.
It might be claimed that bias was introduced because two of the hospitals concerned participated in the pilot study, resulting in better scores in the main study. However, this is unlikely for the following reasons: ®rst, different patients were surveyed in the pilot study and the ®nal study; second, the two hospitals were not informed of the results of the pilot study, thus excluding the possibility of a shorter learning curve; third, there were only very slight differences between the overall problem scores for these two hospitals in the pilot study and the ®nal study.
Although data do exist on predictors of postoperative outcome,17±19no ®ndings are available on the in¯uence of
confounding variables on patient satisfaction.5 6Our results
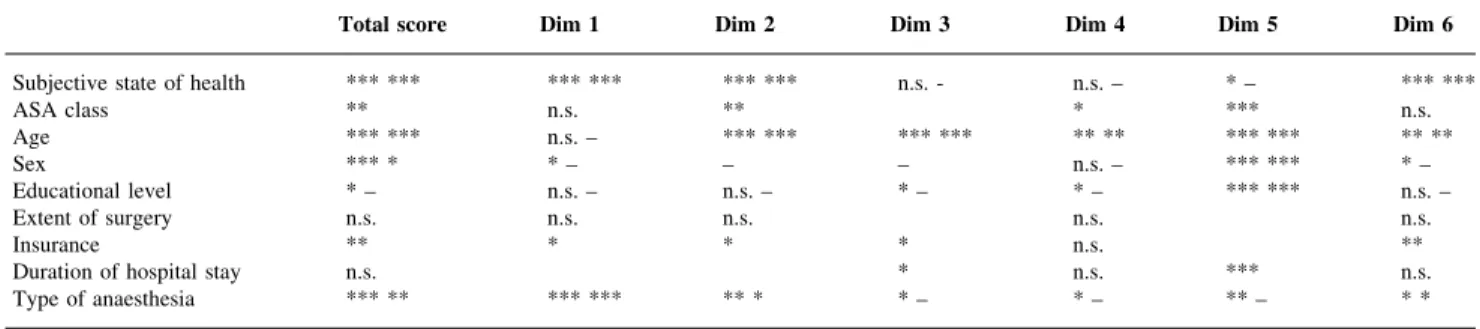
Table 5 Analysis of the confounding variables considered. Statistical in¯uence of all potential confounders was tested ®rst at the univariate level (®rst line in each cell). All variables reaching a signi®cance level of P<0.20 were entered simultaneously into a multivariate linear regression model. Method: forward-stepwise with P(in)<0.05 and P (out)<0.10 for the covariates, forced entry of the hospital-dummies. The signi®cance of variables in the multivariate model (if appropriate) is shown in the second column for those variables. Dim = dimension. P<0.20 (only bivariate); *P<0.05; **P<0.01; ***P<0.001; n.s., not signi®cant
Total score Dim 1 Dim 2 Dim 3 Dim 4 Dim 5 Dim 6
Subjective state of health *** *** *** *** *** *** n.s. - n.s. ± * ± *** ***
ASA class ** n.s. ** * *** n.s. Age *** *** n.s. ± *** *** *** *** ** ** *** *** ** ** Sex *** * * ± ± ± n.s. ± *** *** * ± Educational level * ± n.s. ± n.s. ± * ± * ± *** *** n.s. ± Extent of surgery n.s. n.s. n.s. n.s. n.s. Insurance ** * * * n.s. **
Duration of hospital stay n.s. * n.s. *** n.s.
Type of anaesthesia *** ** *** *** ** * * ± * ± ** ± * *
showed that the subjective state of health, age, sex, level of education and type of anaesthesia had an effect on the dimensions `Information/Involvement in decision-making' and `Continuity of personal care by anaesthetist'. However, the extent of surgery, type of insurance, number of hospital stays in the past 6 months, duration of hospital stay and the ASA class had no in¯uence on the number of problems mentioned. The variables selected may not be the most
appropriate, since some of them were derived from outcomes research,17 and we were only able to perform
analyses with the confounding variables we selected.20We
did not include, for example, social desirability as a confounding variable, as proposed by Le May and co-workers,6as the social desirability bias was minimized in
our study by sending out questionnaires and not having interviewers present.11
Fig 2 Comparison of the non-adjusted and adjusted mean problem scores (%) for the dimension `Information/Involvement in decision-making' at six hospitals (A±F). *P<0.05 versus total mean.
Fig 3 Comparison of the non-adjusted and adjusted mean problem scores (%) for the dimension `Continuity of personal care by anaesthetist' at six hospitals (A±F). * P<0.05 versus total mean.
Comparisons with results from other studies
Comparisons with other studies on patient satisfaction with anaesthesia care are dif®cult, since at present there is little or no similar published work in this area.5 6 Moreover,
current studies on patient satisfaction are of questionable value.6 7 21
The development of a psychometric questionnaire must follow a rigorous protocol.5 7 11 12 22 For example, Sitzia7
states that the prerequisites for a valid and reliable questionnaire are the presence of some elements of content validity and construct or criterion validity and reliability (internal consistency). According to Le May and co-workers6
and Wu and co-workers,21 none of the papers quoted by
them followed such a rigorous protocol to measure patient satisfaction with general or regional anaesthesia in in-patients.
The generation of items must incorporate the patient's perspective by using focus groups, for example.3 11 23 24
Otherwise, the surveys re¯ect the bias of the experts who constructed them. This is an instrument for content validity testing. Focus groups are required by several authors.3 23 25
We found, however, only two publications on anaesthesia in which focus groups were used for item generation.13 16By
using a pilot study including open questions, we also incorporated a second element of content testing.7
The statistical analysis of the patients' responses to the pilot questionnaire is an important part of the development of a psychometric questionnaire.5 There is no consensus
about the accepted level of reliability, but the most popular measure, the Cronbach coef®cient alpha, should exceed at least 0.6 or 0.7.26Our results showed that the dimensions
`Information/Involvement in decision-making', `Respect/ Con®dence' and `Delay management' exceeded these levels (alpha >0.7). In agreement with others, we found that the dimension `Information/Involvement in decision-making' was one of the areas where most problems were men-tioned.16 23 27
In addition to the number of problems mentioned, the importance of the problems is also of great signi®cance. As with reliability measurement, there are several methods available to assess this. The right answer is far from clear.11
One of the accepted methods is weighting using multiple linear regression via beta weights.11In agreement with Fung
and Cohen13 who studied out-patients, our results showed
that information (and communication) is the most important dimension. It is well recognized that involvement in decision-making improves patient satisfaction.28
It is also dif®cult to compare our results with those made at other hospitals because studies conducted so far have compared anaesthesia-related incidents and not patient satisfaction.9Measuring the quality of care by an
anaesthe-sia team by comparing major outcomes has emerged as unsatisfactory because such events (in particular, death) occur only very rarely. Cohen and co-workers10concluded
that their investigation of 25 000 patients in four hospitals
was not powerful enough to demonstrate a difference in mortality. Because of the low incidence of major adverse outcomes, it is therefore very unreliable to use these as a basis to draw conclusions about the quality of an anaesthesia department.10
Unlike patient experience with hospital care,29 as far as
we are aware, there are no benchmarking studies on patient satisfaction with anaesthesia care conducted using a multi-dimensional, validated questionnaire. Analysis of patient surveys by Coulter and Cleary23 also revealed problems
with provision of information, respect for patients' prefer-ences, and continuity of their care. Their ®ndings also showed a striking difference between the total number of problems mentioned between the best and the worst hospitals.
The analysis of the confounding variables and the consequent adjustment based on the composition of the patient sample enabled us to compare the hospitals with each other. The effects found were very slight, however, because the hospitals were very similar with regard to the in¯uence of the confounding variables considered. Such an analysis should nevertheless be conducted to elicit any possible effects and make appropriate adjustments.10 30 31It
is known from the literature that older patients are less critical.32 This was con®rmed by our ®ndings but other
studies found no signi®cant relationship of this sort.25In line
with most other studies, our ®ndings also showed a positive correlation between health status and satisfaction.31
In summary, the development of a psychometric ques-tionnaire for the assessment of patient satisfaction with anaesthesia care requires the following of a rigorous protocol, including the patient's perspective. The implica-tions for anaesthetic practice are that all hospitals involved should ®rst of all consider how they can improve the situation with regard to the provision of information on anaesthesia care. As a continuous quality-improvement process, all measures taken should be evaluated and compared subsequently. The importance of communication Ðwhich can simply be used as a generic term for almost all our dimensionsÐcannot be emphasized strongly enough: `Patients don't care what we know, they want to know that we care'.
Acknowledgements
This study was supported by the Department of Anaesthesiology, St Gallen Cantonal Hospital, Switzerland (®nancial support) and Picker Institute, Ibelweg 18a, CH-6300 Zug, Switzerland.
References
1 Donabedian A. The quality of care: how can it be assessed? JAMA 1988; 260: 1743±8
2 Ebner H, KoÈck CM. QualitaÈt als Wettbewerbsfaktor fuÈr Gesundheitsorganisationen. In: Heimerl-Wagner P, KoÈck CM, eds. Management in Gesundheitsorganisationen. Wien: Ueberreuter, 1996; 72±101
3 Myles PS, Hunt JO, Nightingale CE, et al. Development and psychometric testing of a quality of recovery score after general anaesthesia and surgery in adults. Anesth Analg 1999; 88: 83±90 4 Juran JM. Juran on Quality by Design, 1st Edn. New York: Free
Press, 1992
5 Fung D, Cohen MM. Measuring patient satisfaction with anaesthesia care: a review of current methodology. Anesth Analg 1998; 87: 1089±98
6 LeMay S, Hardy JF, Taillefer MC, Dupuis G. Patient satisfaction with anaesthesia services. Can J Anaesth 2001; 48: 153±61 7 Sitzia J. How valid and reliable are patient satisfaction data? An
analysis of 195 studies. Int J Qual Health Care 1999; 11: 319±28 8 Myles PS, Williams DL, Hendrata M, Anderson H, Weeks AM. Patient satisfaction after anaesthesia and surgery: results of a prospective survey of 10 811 patients. Br J Anaesth 2000; 84: 6±10
9 Bothner U, Georgieff M, Schwilk B. Building a large-scale perioperative anaesthesia outcome-tracking database: methodology, implementation, and experiences from one provider within the German quality project. Br J Anaesth 2000; 85: 271±80
10 Cohen MM, Duncan PG, Pope WDB, et al. The Canadian four-centre study of anaesthetic outcomes: II. Can outcomes be used to assess the quality of anaesthesia care? Can J Anaesth 1992; 39: 430±9
11 Streiner DL, Norman GR. Health Measurement Scales. A Practical Guide to their Development and Use, 2nd Edn. Oxford: Oxford University Press, 1995
12 De Vellis RF. Scale Development. Theory and Applications, 1st Edn. London: Sage Publications, 1991
13 Fung D, Cohen MM. What do outpatients value most in their anaesthesia care? Can J Anaesth 2001; 48: 12±19
14 Ley P, Bradshaw PW, Kinsey JA, Atherton ST. Increasing patients' satisfaction with communication. Br J Soc Clin Psychol 1976; 15: 403±13
15 Ware JE, Snyder MK, Wright WR, Davies AR. De®ning and measuring patient satisfaction with medical care. Eval Program Plann 1983; 6: 247±63
16 Whitty PM, Shaw IH, Goodwin DR. Patient satisfaction with general anaesthesia. Too dif®cult to measure? Anaesthesia 1996; 51: 327±32
17 Wolters U, Wolf T, StuÈtzer H, SchroÈder T. ASA classi®cation and perioperative variables as predictors of postoperative outcome. Br J Anaesth 1996; 77: 217±22
18 Duncan PG, Cohen MM. Anaesthetic morbidity: factors of signi®cance to anaesthetic practice. Can J Anaesth 1987; 34: 2±8 19 Farrow SC, Fowkes FG, Lunn JN, Robertson IB, Sweetnam P. Epidemiology in anaesthesia: a method for predicting hospital mortality. Eur J Anaesthesiol 1984; 1: 77±84
20 Datta M. You cannot exclude the explanation you have not considered. Lancet 1993; 342: 345±7
21 Wu CL, Naqibuddin M, Fleisher LA. Measurement of patient satisfaction as an outcome of regional anaesthesia and analgesia: a systematic review. Reg Anesth Pain Med 2001; 26: 196±208 22 Crocker L, Algina J. Introduction to Classical and Modern Test
Theory. Fort Worth: Harcourt Brace Jovanovic College Publishers, 1986
23 Allshouse KD. Treating patients as individuals. In: Gerteis M, Edgman-Levitan S, Daley J, Delbanco TL, eds. Through the Patient's Eyes. San Francisco: Jossey-Bass Publishers, 1993; 19±44 24 Dolan P, Cookson R, Ferguson B. Effect of discussion and deliberation on the public's views of priority setting in health care: focus group study. Br Med J 1999; 318: 916±19
25 Cleary PD, McNeil BJ. Patient satisfaction as an indicator of quality of care. Inquiry 1988; 25: 25±36
26 Malhorta NK, Marketing Research ± an Applied Orientation, 2nd Edn. Upper Saddle River, NJ: Prentice Hall, 1996
27 Wisiak UV, KroÈll W, List W. Communication during the preoperative visit. Eur J Anaesthesiol 1991; 51: 327±32
28 Hornberger JC, Habraken H, Bloch DA. Minimum data needed on patient preferences for accurate, ef®cient medical decision making. Med Care 1995; 33: 297±310
29 Coulter A, Cleary PD. Patients'experiences with hospital care in ®ve countries. Health Aff 2001; 20: 244±52
30 Green®eld S, Aronow H, Elashoff RM, Watanabe D. Flaws in mortality data. The hazards of ignoring comorbid disease. JAMA 1988; 260: 2253±5
31 Aharony L, Strasser S. Patient satisfaction: what we know and what we still need to explore. Med Care Rev 1993; 50: 49±79 32 Pascoe GC. Patient satisfaction in primary health care: a
literature review and analysis. Eval Program Plann 1983; 6: 185±210