Institute of Biology
Laboratory of Soil Biodiversity
Assessing soil micro-eukaryotic diversity
using high-throughput amplicons sequencing:
spatial patterns from local to global scales and
response to ecosystem perturbation.
Christophe Victor William Seppey
For the degree of:
Doctor in Science in Biology
Thesis committee:
Prof. Edward A.D. Mitchell (Supervisor)
University of Neuchâtel (Switzerland)
Dr. Enrique Lara (Co-supervisor)
University of Neuchâtel (Switzerland)
Dr. David Bass (Jury)
Natural History Museum of London (United Kingdom)
Centre for environment Fisheries & Aquaculture Science
(United Kingdom)
Dr. Micah Dunthorn (Jury)
University of Kaiserslautern (Germany)
Dr. Stefan Geisen (Jury)
Netherlands Institute of Ecology (Netherlands)
Wageningen University (Netherlands)
Imprimatur pour thèse de doctorat www.unine.ch/sciences
Rue Emile-Argand 11 2000 Neuchâtel ± Suisse Tél : + 41 (0)32 718 21 00 E-mail : [email protected]
IMPRIMATUR POUR THESE DE DOCTORAT
La Faculté des sciences de l'Université de Neuchâtel
autorise l'impression de la présente thèse soutenue par
Monsieur Christophe SEPPEY
Titre:
³
Assessing soil micro-eukaryotic diversity
using high-throughput amplicons sequencing:
spatial patterns from local to global scales and
response to ecosystem perturbation
´
sur le rapport des membres du jury composé comme suit:
x
Prof. Edward Mitchell, directeur de thèse, Université de Neuchâtel, Suisse
x
Dr Enrique Lara, co-directeur de thèse, Université de Neuchâtel, Suisse
x
Dr Micah Dunthorn, University of Kaiserslautern, Allemagne
x
Dr David Bass, Natural History Museum, Londres, UK
x
Dr Stefan Geisen, Netherlands Institute of Ecology, Wageningen, NL
and you will never have to work a day in your life.
Les micro-eucaryotes exhibent une immense diversité qui remplie plusieurs fonctions essentielles dans les écosystèmes colonisés. Ces micro-organismes sont impliqués dans tout les niveaux trophique microbiens, interagissent entre eux ainsi qu’avec d’autre groupes d’organismes tel les procaryotes ou les macro-organismes, et influencent les cycles d’éléments comme ceux du carbone ou de l’azote. Les diversité et écologie des micro-eucaryotes sont étudiées à partir de la morphologie de ces organismes et de plus en plus avec des méthodes moléculaire devenant plus abordable que jamais. Le séquençage haut débit de fragments d’ADN donnant une information taxonomique prise directement de l’environnement est maintenant le standard pour établir les communautés microbiennes et pratiquement saturer la diversité microbienne. Cette thèse profite des avancées dans cette technique pour étudier l’écologie des micro-eucaryotes des sols, organismes qui représentent la base de la plupart des écosystèmes terrestre et sont impliqué dans de critique questions écologique comme les changement climatique ou l’approvisionnement alimentaire. Les cinq chapitres suivent des communautés contraintes par différent niveaux de stress ou perturbation et distribuées autant sur de petite surfaces que sur le globe. Des analyses écologique classique et innovante sont utilisées dans ce travail pour couvrir des questions à propos de bioindication, fonctions, niveaux trophique, distribution spatiale et diversité de ce groupe de micro-organismes peu connu à l’immense diversité.
Mots clefs: Micro-eucaryotes . Sols . ADN environnementale . Séquençage haut débit Illumina . Metabarcoding . Petite sous unité du gène de l’ARN ribosomique
Summary
Micro-eukaryotes exhibit a huge diversity which fulfils many essential functions in the colonized ecosystems. These micro-organisms are involved in every level of microbial trophic networks. They interact with each other and with other biota like prokaryotes or macro-organisms, and influence element cycles like the carbon or nitrogen cycle. The diversity and ecology of micro-eukaryotes are studied based on morphological analyses and more and more with molecular methods which are increasingly affordable. High-throughput sequencing of taxonomically informative DNA fragments taken directly from the environment is now the golden standard to assess microbial communities and virtually saturate the microbial diversity. This thesis takes advantage of the advances in this technique to study the ecology of micro-eukaryotes in soils, which represent the basis of most terrestrial ecosystems and are involved in critical ecological issues like climate changes or food supply. The five chapters follow communities constrained by different levels of stress or perturbation and distributed from very limited areas to global ecosystems. Classical and innovative ecological analyses are used in this work to cover questions about the bioindication, functions, trophic networks, spacial distributions and diversity of these hyper-diverse and largely unknown micro-organisms.
Keywords: Micro-eukaryotes . Soils . Environmental DNA . Illumina high-throughput sequencing . Metabarcoding . SSU rRNA gene
Résumé . . . v Summary . . . v Contents vii Introduction 1 1 Micro-eukaryotic communities . . . 1 2 Soils . . . 4 3 Thesis aims . . . 7
1 Euglyphids response in cadaver impacted soil 9 1.1 Introduction . . . 9
1.2 Materials and methods . . . 10
1.3 Results . . . 12
1.4 Discussion . . . 13
2 Co-occurrence network of micro-eukaryotes in peatlands 19 2.1 Introduction . . . 19
2.2 Materials and methods . . . 20
2.3 Results and discussion . . . 22
3 Spatial modelling of soil protist diversity in the Swiss western Alps 33 3.1 Introduction . . . 34
3.2 Materials and methods . . . 34
3.3 Results . . . 35
3.4 Discussion . . . 37
4 Algivory: an alternative pathway for the soil microbial loop 59 4.1 Introduction . . . 59
4.2 Materials and methods . . . 60
4.3 Results . . . 62
4.4 Discussion . . . 65
5 Comparison between soils and planktonic micro-eukaryotic communities 81 5.1 Introduction . . . 82
5.2 Materials and methods . . . 83
5.3 Results and discussion . . . 84
Discussion and conclusion 97 1 Background . . . 97 2 Achievements . . . 98 3 Perspectives . . . 99 Bibliography 101 Curriculum Vitae 111 Remerciements / Acknowledgements 115 vii
Christophe V.W. Seppey1∗
1Laboratory of Soil Biodiversity, University of Neuchâtel, Rue Émile-Argand 11, 2000 Neuchâtel, Switzerland ∗Corresponding author: [email protected]
Abstract: Micro-eukaryotes exhibit a huge diversity which fulfils many essential functions in the colonized ecosystems. These micro-organisms are involved in every level of microbial trophic networks. They interact with each other and with other biota like prokaryotes or macro-organisms, and influence element cycles like the carbon or nitrogen cycle. The diversity and ecology of micro-eukaryotes are studied based on morphological analyses and more and more with molecular methods which are increasingly affordable. High-throughput sequencing of taxonomically informative DNA fragments taken directly from the environment is now the golden standard to assess microbial communities and virtually saturate the microbial diversity. This thesis takes advantage of the advances in this technique to study the ecology of micro-eukaryotes in soils, which represent the basis of most terrestrial ecosystems and are involved in critical ecological issues like climate changes or food supply. The five chapters follow communities constrained by different levels of stress or perturbation and distributed from very limited areas to global ecosystems. Classical and innovative ecological analyses are used in this work to cover questions about the bioindication, functions, trophic networks, spacial distributions and diversity of these hyper-diverse and largely unknown micro-organisms.
Keywords: Micro-eukaryotes . Soils . Environmental DNA . Illumina high-throughput sequencing . Metabarcoding . SSU rRNA gene
1
Micro-eukaryotic communities
What is a micro-eukaryote?
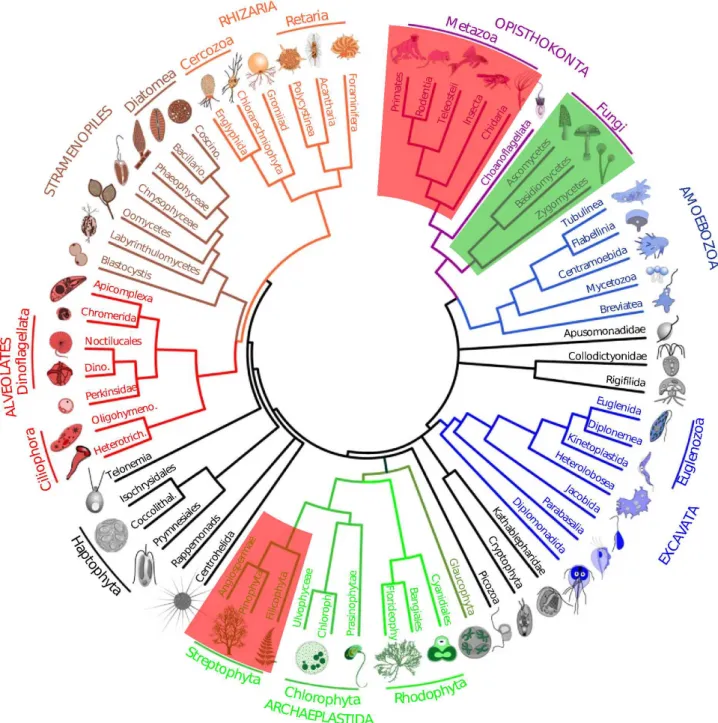
Micro-eukaryotes, include any eukaryotic organism small enough to be invisible to the naked eye and are found in all super-groups of eukaryotes (Pawlowski et al., 2012). These micro-organisms encompass mostly protists, a poly-phyletic group containing all eukaryotes except Meta-zoa (animals), Embryophyceae (higher plants) and Fungi (Whittaker, 1969) (Figure 1). This group includes the phagotrophic protozoa (e.g. Ciliata), phototrophic karyotic algae (e.g. Chlorophyceae), and osmotrophic eu-karyotes living as free organisms (e.g. Labyrinthulea) or involved in mutualistic (e.g. Trebouxiophyceae) or para-sitic symbiosis (e.g. Apicomplexa). Contrarily to its mac-robial counterpart, micro-eukaryotic diversity is mostly unknown (Pawlowski et al., 2012). This is due to their small size that 1) makes it difficult to find the organism in a sample - and even harder if the sample contains a high proportion of particles as in soils - and 2) makes it more difficult to find distinctive morphological features as this often requires using scanning electron or trans-mission electron microscopy (Ekelund and Ronn, 1994;
Mulot et al., 2017).
Fungi form the second main group of micro-eukaryotes. Indeed, although many Basidiomycota and Ascomycota produce macroscopic carpophores, many species are only found in a microscopic form like yeasts (e.g. Saccaromyces) (Masinova et al., 2017; Hittinger, 2013). In addition, most of their biomass - at least in soils - is formed from undifferentiated cells (hyphae) reach-ing considerable cumulative length but only a few micro-meters in diameter (Gobat et al., 2010d). In many soils, they play an important role in the eukaryotic microbiome as they constitute the main part of the micro-eukaryotic biomass (Ekelund et al., 2001). This osmotrophic tax-onomic group is well known to form mutual and para-sitic symbiosis with higher plants (Cairney and Chambers, 1999) as well as with other organisms like Metazoa (e.g. Entomophthoromycota (Boomsma et al., 2014)) or even Fungi (e.g. Cryptomycota (Lara and Belbahri, 2011)).
In addition to the first two groups, some Metazoa like rotifers, tardigrades or nematodes are also included in micro-eukaryotes. However, these micro-Metazoa will not be taken into account in this thesis as many of them can reach a size up to a millimetre and are constituted of differentiated cells.
2
Figure 1: Schematic tree of eukaryotes modified from (Pawlowski, 2014). Micro-eukaryotes constitute almost the entire tree apart from the Metazoa (animals) and macro-Streptophyta (higher plants) (in red). Apart from Fungi (in green) all micro-eukaryotes are protists.
What functions do they fulfil?
PhagotrophsIn every biome on Earth, micro-eukaryotes play funda-mental roles that can roughly be divided in five cate-gories. The first, and maybe most acknowledged one, is the role of microbial predators which was conceptual-ized in the microbial loop (Azam et al., 1983; Clarholm, 1985). According to this theory, phagotrophic protists act as "natural fertilizer producers" as they make nu-trients available for other organisms (e.g. plants and algae). These nutrients would otherwise stay seques-trated in bacterial biomass (Bonkowski, 2004). In ad-dition to prokaryotes, other carbon sources are used by phagotrophs like micro-eukaryotic algae (Davidson, 1996), Fungi (Ekelund, 1998; Geisen, 2016; Geisen et al.,
2016) or Metazoa (Geisen et al., 2015b; Gilbert et al., 2000). Phagotrophic protists, as a functional group, can thus be considered as predators of virtually the entire mi-crobial world. This predation pressure shapes the prey communities promoting certain characteristics like toxic-ity, motility or size (Jurgens and Matz, 2002). Neverthe-less, certain predators adapt to these defences (Swanson, 2013; Xinyao et al., 2006; Wu et al., 2004) leading to a microbial arms race (Brodie Jr et al., 1991) and consti-tuting a powerful motor of evolution.
Phototrophs
The second function micro-eukaryotes can fulfil in the environment is as primary producers. In aquatic ecosys-tems, they are an important source of carbon for higher
trophic levels and are the dominant contributors to over-all photosynthesis (Vaulot et al., 2008; Jardillier et al., 2010; Falkowski, 2002). In terrestrial ecosystems, where the surface is mainly covered by higher plants, the eu-karyotic micro-algae contribution is more discrete but can constitute a significant carbon input in arid regions (Pushkareva et al., 2016; Belnap, 2003). Through their symbiosis with lichens, eukaryotic algae also play - to a certain extent - the role of higher plants by stabilising the soil and improving the water infiltration (Chen et al., 2000; Upreti et al., 2015; Eldridge and Greene, 1994). They can also constitute a significant part of the car-bon ingested by certain soil organisms like springtails, earthworms (Schmidt et al., 2016) or phagotrophic pro-tists (Hess and Melkonian, 2013; Seppey et al., 2017). Mixotrophs
Comparatively to macro-organisms, many micro-eukaryotes are not constrained in strict phagotrophy or phototrophy, and can benefit from the two trophic strate-gies. The ideal mixotroph (constitutive mixotroph) is an organism capable of transmitting the plastid vertically to the next generation and able to regulate the organelle via nuclear genes (Mitra et al., 2016). In addition to constitutive mixotrophs, more and more phototrophic eukaryotes are observed ingesting preys under light or nu-trient limitation (Stoecker, 1998). Phagotrophs can also conserve the chloroplasts from their preys and contribute to primary production (Johnson, 2011a,b). This strategy may be the norm rather than the exception, at least in aquatic ecosystems (Flynn et al., 2013). In addition, this strategy increases the growth rate of the population in comparison to a strictly phototrophic or phagotrophic mode (Burkholder et al., 2008). The possibility to switch from a primary production mode, where carbon is eas-ily available but nutrients and light are mandatory, to a heterotrophic mode, based on preys like prokaryotes but not requiring anything else, allows this functional group to adapt to the availability of nutrients, carbon and light. This adaptability can firstly be seen at the community level when primarily autotrophic mixotrophic species (e.g. cryptophytes) dominate in eutrophic con-ditions while primarily heterotrophic mixotrophic species (e.g. chrysophytes) dominate in oligotrophic environ-ments (Saad et al., 2016; Lara et al., 2015). The adap-tation can also be seen at the species level as it was shown for Dinobryon sociale where the bacteria ingestion rate increases at a certain temperature or as nutrient concentrations decrease (Princiotta et al., 2016). Parasites
Many groups of micro-eukaryotes are known as parasites of various hosts like plants (e.g. Phytophthora sp.), an-imals (e.g. Apicomplexa) or even micro-eukaryotes (e.g. Rozella sp.). As all parasites, these micro-eukaryotes can be more or less host specific and may influence the host population in a density-dependent way, that could in-crease the diversity of the host population (i.e.
Janzen-Connel model) (Mahé et al., 2017; Freckleton and Lewis, 2006; Connell, 1972; Janzen, 1970). In addition, like micro-eukaryotic predators, parasites apply a selec-tion pressure on their host and vice versa, which can cause a Red Queen coevolution (Raberg et al., 2014; Rabajante et al., 2016). The ecological models in which parasitic micro-eukaryotes are involved can also be more complex when the symbiont can switch from a parasitic strategy to a mutualistic one depending on the health of the host (Sachs et al., 2011; Fellous and Salvaudon, 2009).
Saprotrophs
Saprotrophic micro-eukaryotes are mainly found within Fungi and some groups of protists (e.g. slime moulds, certain Oomycota, Labyrinthulomycota) (Beakes et al., 2012; Tsui et al., 2009; Mendoza et al., 2002). Their role in terrestrial ecosystems is mainly to recycle dead organic matter into new biomass (Adl and Gupta, 2006). As a result, these organisms constitute the main part of the living biomass in soil (Gobat et al., 2010d).
Where can we find them?
Micro-eukaryotes are everywhere; from marine to fresh-water ecosystems and from liquid to solid substrates. Through evolution, a variety of adaptations were selected according to the various possible environments, which led to the diversity of morphology and physiology we can ob-serve today (Katz, 2012). These adaptations allow micro-eukaryotes to colonize from more suitable to harsher and perturbed environments. The best example of adaptation to changing environments is the capacity of many pro-tists to encyst - sometime for years - waiting for more suitable conditions (Foissner, 1987). This is particularly true in soils where the conditions of humidity and nutri-ents can vary through periods of dryness or proximity of a root exudate for example (Adl and Gupta, 2006). It is even hypothesized that the soil micro-eukaryotic diver-sity would be mainly constituted by encysted organisms (Foissner, 1987; Clarholm, 2005). This capacity to en-cyst and wait for optimal conditions partly explains the incomplete picture of the eukaryotic morphological diver-sity because of our incapacity to establish the conditions needed to reactivate these organisms in the laboratory (Ekelund and Ronn, 1994; Foissner, 1999b).
The various types of symbiosis also help micro-eukaryotes to colonize almost all Earth environments. Lichen, often composed of Fungi and a eukaryotic alga (e.g. Trebouxiophyceae, Chlorophyceae), benefit of their respective adaptation to gather nutrients from bedrock and carbon from the air (Chen et al., 2000; Upreti et al., 2015).
These adaptations more or less fit into the various en-vironmental conditions which influences the spatial distri-butions of micro-eukaryotes. This phenomenon, added to historical spatial distributions and environmental barriers, helps to explain the present geographic patterns (Foissner,
4
2006; Bass et al., 2007; Smith et al., 2008; Lara et al., 2016).
How to study them?
Morphological methodsSince the beginning of protistology and mycology, micro-eukaryotes have been cultivated and observed through the microscope (optical and electronic) to characterize their diversity. The combination of these two tools is essential for the tens to hundreds of micro-eukaryotic new species descriptions taxonomists achieve every year (Appeltans et al., 2012). In addition to morphological identifications, these classical tools give precious infor-mation about the ecology of the cultivated organisms, like feeding behaviour (Berge et al., 2008; Dumack et al., 2016b; Jassey et al., 2012; Xinyao et al., 2006; Singh, 1946; Verni and Gualtieri, 1997) or tolerance to envi-ronmental characteristics like pH (Koch and Ekelund, 2005; Weisse et al., 2013; Germond et al., 2013, 2014), temperature (Pichrtova and Nemcova, 2011), salinity (Scholz and Liebezeit, 2012b; Nielsen et al., 2011) or nu-trients (Mitchell, 2004). This information is essential for most interpretations of ecological results despite be-ing unavailable for the large majority of micro-eukaryotes (Ekelund and Ronn, 1994).
Micro-eukaryotic communities can be assessed by mi-croscopy preceded or not by a cultivation step (Singh, 1955; Foissner, 1983). These techniques have the ad-vantage to be inexpensive and simple to perform. The most probable number technique (MPN) allows esti-mating the number of protists in a sample and can give pure cultures as by-products, which can be used for species description or experiment purposes (Singh, 1955; Darbyshire et al., 1974). This technique mainly makes it possible to assess opportunistic organisms that are not necessarily abundant in the environment but benefit from the cultivation medium which is normally rich in nutrients (Del Campo et al., 2013). Neverthe-less, the cultivation medium can be adapted, to a cer-tain extent, to the environmental conditions of the sam-ple of origin in order to better represent the original community (Ekelund and Ronn, 1994). Direct count-ing can also be used to avoid cultivation bias and thus have a better idea of the actual community (Foissner, 1983; Luftenegger et al., 1988). It was shown that com-munities of large and well identifiable organisms like testate amoebae (Payne and Mitchell, 2009) or ciliates (Posch et al., 2015) can be reliably assessed through this technique. However, these two techniques suffer of serious drawbacks (Ekelund and Ronn, 1994; Clarholm, 2005; Adl and Gupta, 2006). MPN is constrained by cul-tivation bias, allowing only a part of the micro-eukaryotic community to grow. On the other hand, community as-sessment by direct observations may fail to reveal small or inconspicuous organisms, particularly if the samples con-tain many particles as in soils. In addition, these meth-ods are recognised as time consuming, which reduces the number of samples that can be handled for a single study
(Hamsher et al., 2013). Molecular methods
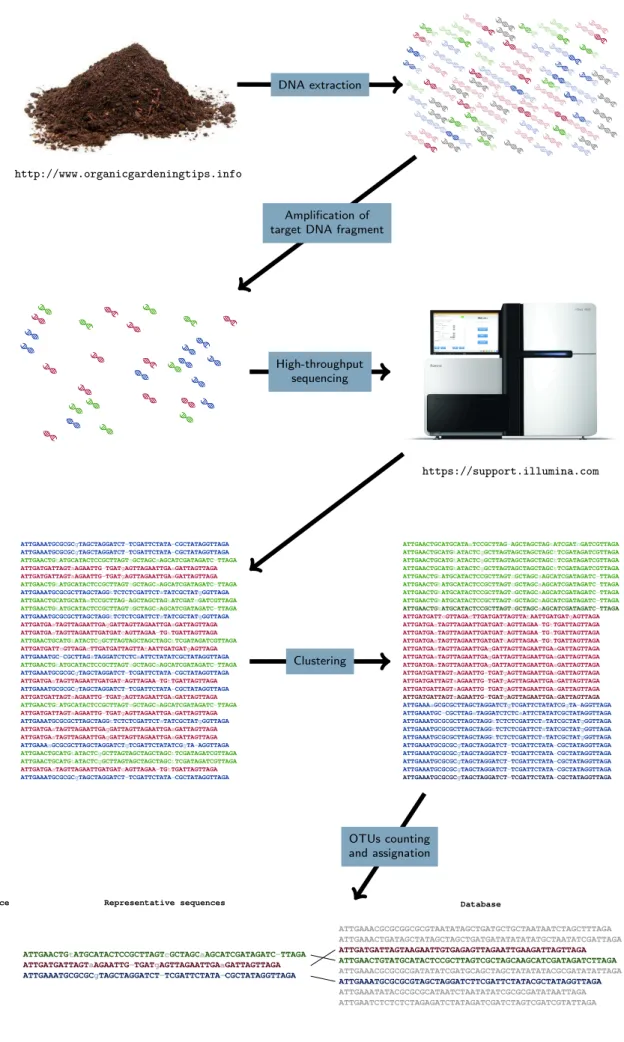
Methods based on DNA sequences allow overcom-ing a part of the issues linked to morphologi-cal identifications like organism size or cultivabil-ity (Moreira and Lopez-Garcia, 2002; Pawlowski et al., 2012). Taxonomically informative DNA fragments (DNA barcodes) like the ribosomal RNA gene were primarily used to improve the classifications of the cultivated and described species through phylogenetic reconstruction (Schlegel, 1994). For this reason, more and more effort is now given to increase and cure databases of these DNA barcodes (Pawlowski et al., 2012; Guillou et al., 2013). As for morphological data, methods emerged to obtain the cellular DNA sequences directly from the environ-ment to overcome the culturing bias and reach the un-cultivable micro-eukaryotic diversity, which constitutes the majority of the diversity for many taxonomic groups (de Vargas et al., 2015; Pawlowski et al., 2012). Once the DNA is extracted from the environment, amplicons of the DNA barcodes (metabarcoding) can be grouped according to their similarity to form operational taxo-nomic units (OTUs) that constitute biological entities like their morphological counterparts observed by microscopy (Taberlet et al., 2012; Valentini et al., 2009). Each OTU can then be taxonomically assigned by comparing its char-acteristic sequence to a DNA barcode database. The obtained community matrix can then give a good proxy to assess the responses of both dead or alive and active or inactive micro-organisms to environmental constrains (Giner et al., 2016).
Within the last few years, the democratisation of high-throughput sequencing allows assessing micro-eukaryotic OTU communities faster and from much more samples than before (Shendure and Ji, 2008). A constraint of high-throughput sequencing is the use of short fragments, which provide less phylogenetic information but are less prone to break in the environment and/or form chimera (Valentini et al., 2009). Nevertheless, these sequencing technologies develop rapidly resulting in an increase in sequences length and numbers (Guzvic, 2013). Despite giving semi-quantitative results, the number of sequences belonging to each OTU can be used to calculate eco-logical metrics and give results in line with studies made on morphological data. Metabarcoding is now the golden standard to assess high numbers of micro-eukaryotic com-munities in a reasonable amount of time (Figure 2).
2
Soils
What is a soil?
Soils are the intersection between the geological, aquatic, aerial and biological worlds. They re-sult from the weathering of the bedrock through physical and chemical processes and the action of pioneer living organisms like lichen or mosses
ATTGATGATTAGTaAGAATTG TGATgAGTTAGAATTGA GATTAGTTAGA
ATTGATGATTcGTTAGA TTGATGATTAGTTA AATTGATGATgAGTTAGA
ATTGATGA TAGTTAGAATTGA GATTAGTTAGAATTGA GATTAGTTAGA
ATTGATGA TAGTTAGAATTGATGATcAGTTAGAA TG TGATTAGTTAGA
ATTGATGA TAGTTAGAATTGA GATTAGTTAGAATTGA GATTAGTTAGA ATTGATGA TAGTTAGAATTGA GATTAGTTAGAATTGA GATTAGTTAGA
ATTGATGATTAGTaAGAATTG TGATgAGTTAGAATTGA GATTAGTTAGA
ATTGATGA TAGTTAGAATTGATGATcAGTTAGAA TG TGATTAGTTAGA
ATTGATGA TAGTTAGAATTGATGATcAGTTAGAA TG TGATTAGTTAGA
ATTGATGATTAGTaAGAATTG TGATgAGTTAGAATTGA GATTAGTTAGA
ATTGATGATTAGTaAGAATTG TGATgAGTTAGAATTGA GATTAGTTAGA
ATTGAACTG ATGCATACTCCGCTTAGT GCTAGCaAGCATCGATAGATC-TTAGA
ATTGAACTGCATGCATA TCCGCTTAG-AGCTAGCTAG ATCGAT GATCGTTAGA
ATTGAACTGCATG ATACTC GCTTAGTAGCTAGCTAGC TCGATAGATCGTTAGA ATTGAACTGCATG ATACTC GCTTAGTAGCTAGCTAGC TCGATAGATCGTTAGA
ATTGAACTGCATG ATACTC GCTTAGTAGCTAGCTAGC TCGATAGATCGTTAGA ATTGAACTG ATGCATACTCCGCTTAGT GCTAGCaAGCATCGATAGATC-TTAGA
ATTGAACTG ATGCATACTCCGCTTAGT GCTAGCaAGCATCGATAGATC-TTAGA ATTGAACTG ATGCATACTCCGCTTAGT GCTAGCaAGCATCGATAGATC-TTAGA
ATTGAAATGCGCGCTTAGCTAGG TCTCTCGATTCT TATCGCTATgGGTTAGA
ATTGAAA GCGCGCTTAGCTAGGATCT TCGATTCTATATCG TA AGGTTAGA ATTGAAATGC-CGCTTAGaTAGGATCTCTCaATTCTATATCGCTATAGGTTAGA
ATTGAAATGCGCGCgTAGCTAGGATCT-TCGATTCTATA CGCTATAGGTTAGA ATTGAAATGCGCGCgTAGCTAGGATCT-TCGATTCTATA CGCTATAGGTTAGA ATTGAAATGCGCGCgTAGCTAGGATCT-TCGATTCTATA CGCTATAGGTTAGA
ATTGAAATGCGCGCgTAGCTAGGATCT-TCGATTCTATA CGCTATAGGTTAGA ATTGAAATGCGCGCTTAGCTAGG TCTCTCGATTCT TATCGCTATgGGTTAGA
ATTGAAATGCGCGCTTAGCTAGG TCTCTCGATTCT TATCGCTATgGGTTAGA ATTGAAATGCGCGCgTAGCTAGGATCT-TCGATTCTATA CGCTATAGGTTAGA
ATTGAACTG ATGCATACTCCGCTTAGT GCTAGCaAGCATCGATAGATC-TTAGA
ATTGATGATTAGTaAGAATTG TGATgAGTTAGAATTGA GATTAGTTAGA
ATTGATGATTcGTTAGA TTGATGATTAGTTA AATTGATGATgAGTTAGA
ATTGATGA TAGTTAGAATTGA GATTAGTTAGAATTGA GATTAGTTAGA
ATTGATGA TAGTTAGAATTGATGATcAGTTAGAA TG TGATTAGTTAGA
ATTGATGA TAGTTAGAATTGA GATTAGTTAGAATTGA GATTAGTTAGA ATTGATGA TAGTTAGAATTGA GATTAGTTAGAATTGA GATTAGTTAGA
ATTGATGATTAGTaAGAATTG TGATgAGTTAGAATTGA GATTAGTTAGA
ATTGATGA TAGTTAGAATTGATGATcAGTTAGAA TG TGATTAGTTAGA
ATTGATGA TAGTTAGAATTGATGATcAGTTAGAA TG TGATTAGTTAGA
ATTGATGATTAGTaAGAATTG TGATgAGTTAGAATTGA GATTAGTTAGA
ATTGATGATTAGTaAGAATTG TGATgAGTTAGAATTGA GATTAGTTAGA
ATTGAACTG ATGCATACTCCGCTTAGT GCTAGCaAGCATCGATAGATC-TTAGA ATTGAACTGCATGCATA TCCGCTTAG-AGCTAGCTAG ATCGAT GATCGTTAGA ATTGAACTGCATG ATACTC GCTTAGTAGCTAGCTAGC TCGATAGATCGTTAGA ATTGAACTGCATG ATACTC GCTTAGTAGCTAGCTAGC TCGATAGATCGTTAGA ATTGAACTGCATG ATACTC GCTTAGTAGCTAGCTAGC TCGATAGATCGTTAGA
ATTGAACTG ATGCATACTCCGCTTAGT GCTAGCaAGCATCGATAGATC-TTAGA
ATTGAACTG ATGCATACTCCGCTTAGT GCTAGCaAGCATCGATAGATC-TTAGA ATTGAACTG ATGCATACTCCGCTTAGT GCTAGCaAGCATCGATAGATC-TTAGA
ATTGAAATGCGCGCTTAGCTAGG TCTCTCGATTCT TATCGCTATgGGTTAGA ATTGAAA GCGCGCTTAGCTAGGATCT TCGATTCTATATCG TA AGGTTAGA ATTGAAATGC-CGCTTAGaTAGGATCTCTCaATTCTATATCGCTATAGGTTAGA
ATTGAAATGCGCGCgTAGCTAGGATCT-TCGATTCTATA CGCTATAGGTTAGA
ATTGAAATGCGCGCgTAGCTAGGATCT-TCGATTCTATA CGCTATAGGTTAGA ATTGAAATGCGCGCgTAGCTAGGATCT-TCGATTCTATA CGCTATAGGTTAGA ATTGAAATGCGCGCgTAGCTAGGATCT-TCGATTCTATA CGCTATAGGTTAGA ATTGAAATGCGCGCTTAGCTAGG TCTCTCGATTCT TATCGCTATgGGTTAGA ATTGAAATGCGCGCTTAGCTAGG TCTCTCGATTCT TATCGCTATgGGTTAGA
ATTGAAATGCGCGCgTAGCTAGGATCT-TCGATTCTATA CGCTATAGGTTAGA
ATTGAACTG ATGCATACTCCGCTTAGT GCTAGCaAGCATCGATAGATC-TTAGA
ATTGATGATTAGTaAGAATTG TGATgAGTTAGAATTGA GATTAGTTAGA
ATTGAACTG ATGCATACTCCGCTTAGT GCTAGC AGCATCGATAGATC-TTAGA
ATTGAAATGCGCGCgTAGCTAGGATCT TCGATTCTATA CGCTATAGGTTAGA
ATTGAACTGTATGCATACTCCGCTTAGTCGCTAGCAAGCATCGATAGATCTTAGA ATTGATGATTAGTAAGAATTGTGAGAGTTAGAATTGAAGATTAGTTAGA ATTGAAATGCGCGCGTAGCTAGGATCTTCGATTCTATACGCTATAGGTTAGA ATTGAAACTGATAGCTATAGCTAGCTGATGATATATATATGCTAATATCGATTAGA ATTGAAATATACGCGCGCATAATCTAATATATCGCGCGATATAATTAGA ATTGAATCTCTCTCTAGAGATCTATAGATCGATCTAGTCGATCGTATTAGA ATTGAAACGCGCGCGATATATCGATGCAGCTAGCTATATATACGCGATATATTAGA ATTGAAACGCGCGGCGCGTAATATAGCTGATGCTGCTAATAATCTAGCTTTAGA taxon #8 taxon #6 taxon #5 taxon #4 taxon #3 taxon #2 taxon #1 taxon #7 Database Representative sequences 10 11 9 Occurrence http://www.organicgardeningtips.info https://support.illumina.com DNA extraction Amplification of target DNA fragment
High-throughput sequencing
Clustering
OTUs counting and assignation
6
Area covered
cadaver fluids low pH and nutrients from low to high altitude from natural to entropic land use conventional samplesP
er
tu
rb
a
ti
o
n
/
st
re
ss
le
ve
l
few square meters hundreds square metersregion country world
Chapter 1 Euglyphids response in cadaver impacted soils
Chapter 2 Co-occurrence networks of micro-eukaryotes in peatbogs
Chapter 3
Spacial modelling of soil protist diversity in the Swiss western Alps
Chapter 4
Algivory: alternative pathway for the soil microbial loop
Chapter 5 Comparison between soils and planktonic micro-eukaryotic
communities
Figure 3: Schematic organisation of the chapters according to the size of area studied and the level of perturbation/stress.
(Coleman et al., 2004a; Bardgett, 2005b; Chen et al., 2000). These organisms contribute to the genesis of soils by taking nutrients from the parental material and the carbon (CO2) and nitrogen (N2) from the air (Bardgett, 2005c; Gobat et al., 2010a,b; Coleman et al., 2004b). The dead organic matter produced by the pioneer or-ganisms accumulates and mixes with the fragmented mineral substrate, allowing sequential colonisation waves leading to a deeper soil and a more complex ecosystem (Gobat et al., 2010c).
Soils can firstly be described vertically through their horizons going from the more mineral, closer to the parental material, to the more organic at the surface (Bardgett, 2005a). This vertical gradient obviously in-fluences, and is influenced, by the soil organisms who are more abundant in the upper horizons because of their higher content of nutrients and labile carbon. A soil can also be described by its texture (percentage of clay, silt and sand), as well as by the structure of its aggregates. These characteristics will influence the porosity of the soil and its capacity to retain water and nutrients as well
as its resistance to erosion or compaction (Boiffin et al., 1988). As an example, a clay-rich soil retains more water and nutrients with a positive impact on soils organisms (Gobat et al., 2010e).
What are its functions?
Above ground supportSoils are essential components of terrestrial ecosystems. They support plant growth that provides most of the or-ganic carbon that feeds terrestrial life, including humans. This support to plants is firstly influenced by the capac-ity of the soil to provide nutrients, water and physical support but also catalysed by the below ground diversity (Anderson and Weigel, 2003). Indeed, many soil organ-isms contribute to plant well-being like mycorhizal fungi which increase the nutrients and water intake surface of a plant (van der Heijden et al., 1998). Plants also benefit from soil micro-organisms from their production of bio-available nitrogen as symbiotic nitrogen-fixing bacteria
(Pajares and Bohannan, 2016) or by releasing ammonium as metabolic waste from the digestion of their microbial preys (Clarholm, 1985; Bonkowski, 2004). Vertebrates and invertebrates also physically aerate the soil and pro-vide privileged interstices for roots to pass (Gobat et al., 2010f).
The quality of this support to above ground ecosys-tems is directly affected by what can impact soils phys-ically, chemically and biologically. An example are agri-cultural soils which are physically compacted, and chem-ically amended and treated with pesticides. The com-paction can create a hardpan which reduces water infil-tration to deeper horizons, thus reducing the crop water reserve for dry periods. In addition, water runoff is in-creased as the liquid is constrained to stay on the surface, causing erosion (Boiffin et al., 1988). Chemically, fertil-izers and pesticides have often detrimental effects on the abundance and diversity of soil organisms thus hampering their beneficial effects on soils and plants (Mitchell, 2004; Todorov and Golemansky, 1992; Foissner, 1997). Heterogeneous habitat
Soils constitute the habitats of a plethora of macro- and micro-organisms. One of the specificity which explains this high diversity is heterogeneity. Indeed, soil char-acteristics change in the vertical and horizontal spaces according to e.g. topography, parental material, vegeta-tion or human activity (IUSS et al., 1999). At a smaller scale, soils also show micro-heterogeneity through their aggregates, with interstices more or less humid or rich in nutrients. At the microbial scale, this alternation of more or less suitable habitats can allow two species competing for the same niche to live almost in the same place (Adl and Gupta, 2006). Soil conditions are also temporally heterogeneous, for instance when push-ing many micro-organisms to encyst under temporally harsh conditions (e.g. dryness) (Adl and Gupta, 2006). This encystment of certain species allows others, that are less competitive under optimal conditions but can support the harsh conditions, to use the available niche (Adl and Gupta, 2006).
An excellent example of how soil spatial and temporal heterogeneity can drive below-ground communities can be illustrated with cadaver decomposition (Barton et al., 2013). Cadaveric fluids drastically change soil chemi-cal properties by altering pH (Benninger et al., 2008), carbon or nitrogen concentration (Hopkins et al., 2000; Anderson et al., 2013) and other nutrients such as phos-phorus (Towne, 2000) or potassium (Stokes et al., 2013). In addition, the soil can become temporarily anoxic dur-ing the most active parts of decomposition due to cadav-eric fluids entering the soil (Aitkenhead-Peterson et al., 2015) and mainly because of the intense bacterial respi-ration (Dent et al., 2004). Over the short term, these changes favour anoxic organisms and r-strategists, and kill most of the established diversity (Szelecz et al., 2014; Dent et al., 2004). Nevertheless, these high nutrient con-centrations are favourable for specific communities that then flourish for some time after the nutrients
concen-tration drops below an acceptable level (Towne, 2000; Seppey et al., 2016). These specific conditions are still not fully explored and thus probably hide a high propor-tion of unknown diversity (Seppey et al., 2016).
Elements cycles (Carbon and Nitrogen)
Soils also play a central role in the cycles of many el-ements, including carbon, the most well known. Soils firstly stock a significant amount of the terrestrial organic carbon (2160 Pg; Gobat et al., 2010a; Davidson et al., 2000), principally in waterlogged soils where the oxidation of organic matter is slowed down by anaerobic conditions (Belyea and Malmer, 2004). This phenomenon is partic-ularly true in the case of peatlands which cover ca. 3% of the terrestrial surface (Kivinen and Pakarinen, 1981) and contain ca. 30% of its organic carbon (Gorham, 1991; Rydin and Jeglum, 2013; Clymo and Hayward, 2012). Depending on how these ecosystems respond to on-going climate change they could either buffer or enhance global warming. Indeed, climate change tends to lower the wa-ter level, thus exposing the peat to oxidation. This oxy-gen increase causes a shift from anaerobic to aerobic mi-crobial communities which start to release CO2, trigger-ing a warmtrigger-ing positive feedback (Dieleman et al., 2015; Dorrepaal et al., 2009).
Soils are also a essential compartment in the nitrogen cycle, particularly in terrestrial ecosystems. Indeed, it is in soils that the un-assimilable atmospheric N2is fixed by ni-trifying bacteria as NH4+that can than be taken by plants and higher terrestrial trophic levels (Gobat et al., 2010b). In many ecosystems, nitrogen is the limiting factor for primary producer growth and it is thus the reason why industrial fixation produces up to 100 Tg of assimilable nitrogen per year for crop uses. Most of this input is how-ever leached in aquatic networks and contributes to the growth of algae and the eutrophication of the ecosystem after the consumption and respiration of the algal biomass (Bunting et al., 2016; Howarth and Marino, 2006).
3
Thesis aims
The aim of this thesis is to improve knowledge about soil micro-eukaryotic diversity and community ecology us-ing the metabarcodus-ing approach. The diversity of micro-eukaryotes is studied at different spatial scales and in re-lation to various disturbance factors (Figure 3).
The first chapter assesses the very localised effect of a cadaver perturbation on the community of euglyphid tes-tate amoebae. The effect of the perturbation is studied over more than two and a half years, allowing to measure the recovery of the euglyphid communities over time. In addition, the molecular data revealed that, although most OTUs responded negatively, some could benefit from the conditions brought by the cadavers.
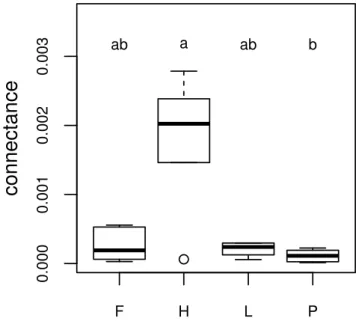
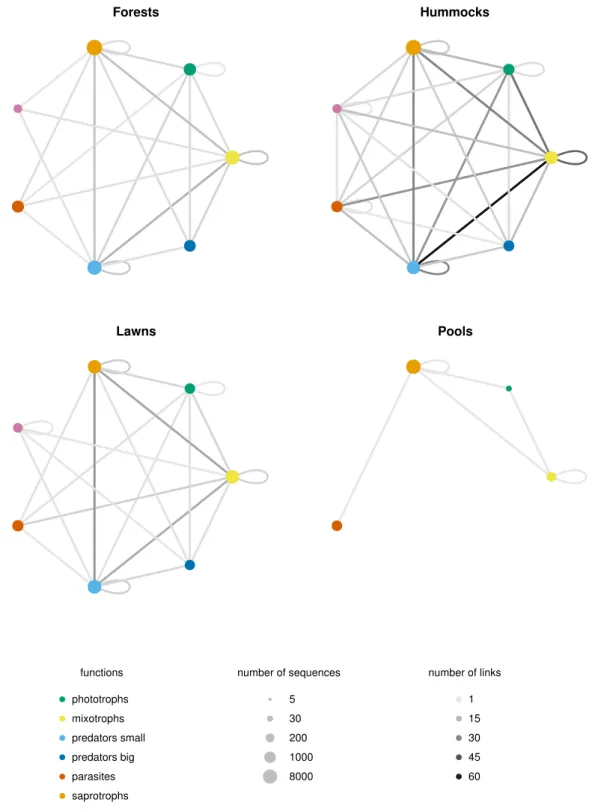
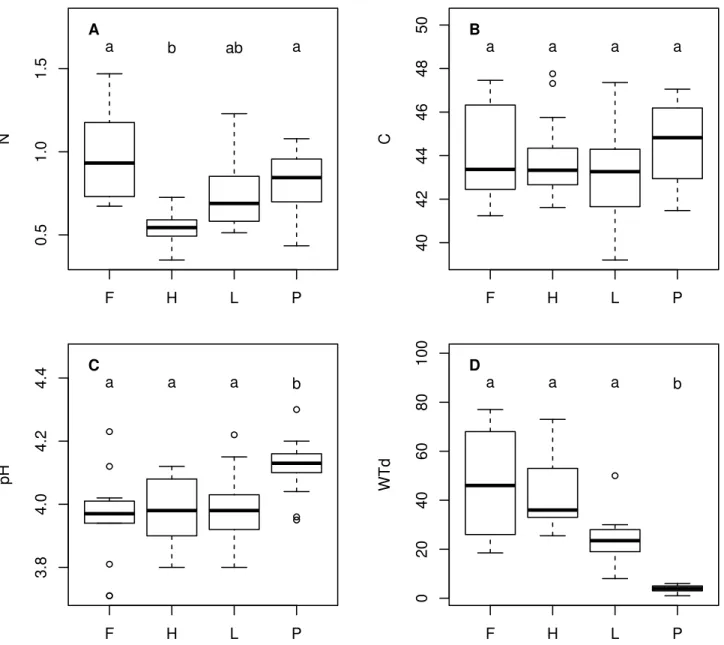
The second chapter explores the interactions among different functional groups of micro-eukaryotes in four peatland micro-habitats. As these four micro-habitats differ in nutrient content and humidity, the design allows
8
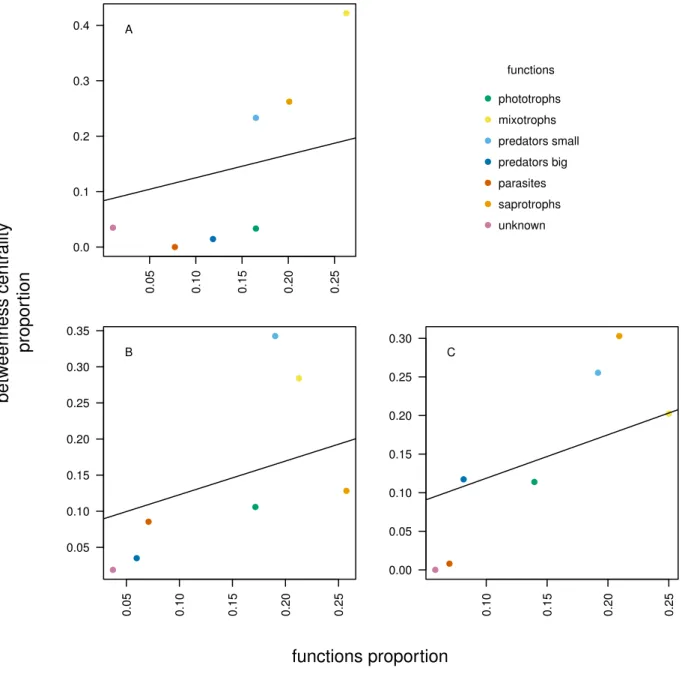
linking the interactions between functions to the environ-mental gradients. The interactions between OTUs are assessed by co-occurrence networks, an innovative anal-ysis in the field of protistology. The results show that the less diverse micro-habitat, which is nutrient-poor and comparatively drier, is the one where the communities are the most tightly linked, suggesting a higher resistance to environmental changes. OTUs assigned to low trophic levels, like small predators or mixotrophs, show the high-est degree of linkage. This sugghigh-ests that the network stability is based on low trophic levels functional groups, implying a bottom-up driven trophic network in stressed habitats like peatlands.
The third chapter shows the preliminary results 1 of a study aiming to predict the micro-eukaryotic diversity of meadow soils through the mountainous regional area of the Swiss western Alps. Spatial distribution models are used to measure the predictive power of both local physico-chemical (e.g. pH, texture, soil temperature) and regional topo-climatic (e.g. slope aspect, air tem-perature) environmental predictors on the diversity of to-tal protists community and of nine broad phylogenetic groups. In general, the predictive power of regional pre-dictors was similar to that of physico-chemical variables. These results open the door to the extrapolation of
pro-tist diversity through a large territory as the topo-climatic predictors are easier to extrapolate to an area than local physico-chemical ones.
The fourth chapter explores the functional and taxo-nomic diversity of micro-eukaryotes across Switzerland in three common land-uses (forests, meadows, crop lands). The relations between the more dominant phagotroph OTUs and the amount of sequences assigned to pho-totrophic micro-eukaryotes is assessed. Positive linear re-lations are found for seven of the phagotrophic assigned OTUs, cumulating between the third and the fourth of the phagotroph assigned sequences. Taxonomic evidence was found in the literature to support the hypothesis ac-cording to which these OTUs would be related to algivo-rous organisms. In addition, observations of three protists sharing a similar taxonomy to the one used to assigned the putative algivores OTUs were done. This suggests that a significant amount of carbon is entering the microbial loop through micro-eukaryotic algae.
The fifth and last chapter aims to compare the micro-eukaryotic diversity of world soils and plankton (marine and freshwater). The results show that soils host at least as much diversity as oceans and suggest that the diver-sity of certain acknowledged aquatic taxa is higher in soils than previously thought.
1 The discussion of this chapter should be extended with respect to the predictive power of topo-climatic and edaphic variables on protist diversity. Nevertheless, the results about 1) the communities retrieved in that mountain area, 2) the difference in explicative power of two sets of variables (edaphic and topo-climatic) and, 3) the spatial prediction of soil protist diversity were considered innovative enough to be included in the manuscript.
doi:10.1007/s00414-015-1149-7
Chapter 1
Response of forest soil euglyphid testate
amoebae (Rhizaria: Cercozoa) to pig cadavers
assessed by high-throughput sequencing
Christophe V.W. Seppey1∗, Bertrand Fournier1,2, Ildikò Szelecz1,3, David Singer1, Edward A.D. Mitchell1,4, Enrique Lara1
1Laboratory of Soil Biodiversity, University of Neuchâtel, Rue Émile-Argand 11, 2000 Neuchâtel, Switzerland 2Evolutionary Community Ecology Group, CNRS, University of Montpellier 2, 34095 Montpellier Cedex 05, France 3Institute of Forensic Medicine, Goethe University, Kennedyallee 104, 60596 Frankfurt, Germany
4Botanical Garden of Neuchâtel, Chemin du Perthuis-du-Sault 58, 2000 Neuchâtel, Switzerland ∗Corresponding author: [email protected]
Abstract:Decomposing cadavers modify the soil environment, but the effect on soil organisms and especially on soil protists is still poorly documented. We conducted a 35-month experiment in a deciduous forest where soil samples were taken under pig cadavers, control plots and fake pigs (bags of similar volume as the pigs). We extracted total soil DNA, amplified the SSU ribosomal RNA (rRNA) gene V9 region and sequenced it by Illumina technology and analysed the data for euglyphid testate amoebae (Rhizaria: Euglyphida), a common group of protozoa known to respond to micro-environmental changes. We found 51 euglyphid operational taxonomic units (OTUs), 45 of which did not match any known sequence. Most OTUs decreased in abundance underneath cadavers between days 0 and 309, but some responded positively after a time lag. We sequenced the full-length SSU rRNA gene of two common OTUs that responded positively to cadavers; a phylogenetic analysis showed that they did not belong to any known euglyphid family. This study confirmed the existence of an unknown diversity of euglyphids and that they react to cadavers. Results suggest that metabarcoding of soil euglyphids could be used as a forensic tool to estimate the post-mortem interval (PMI) particularly for long-term (>2 months) PMI, for which no reliable tool exists.
Keywords: Environmental DNA . Euglyphid testate amoebae . Illumina high-throughput sequencing . Metabarcoding . SSU rRNA gene V9 region . Forensic ecology
1.1
Introduction
The estimation of time since death and more generally the ability to detect the presence of cadavers even when the remains are no longer present are the two major objec-tives in forensic research (Prangnell and McGowan, 2009; Rodriguez and Bass, 1985).
Calculation of the post-mortem interval (PMI), an essential element of legal medicine and criminal inves-tigation to estab- lish the timing of events that led to the death of a person, becomes less precise with the advance of the decomposition process. Until now, two main approaches are used to estimate the PMI. The medical method provides information ranging from a few
hours to several days after death (Henssge et al., 2000; Amendt et al., 2004; Wyss and Cherix, 2006). The sec-ond method, forensic entomology, is based on the obser-vation of larval stages of necrophagous flies and beetles and can be used to establish a PMI up to some weeks (Amendt et al., 2004; Wyss and Cherix, 2006). Although well established, the accuracy of entomological methods has been questioned after the full development of the first generation of necrophagous insects (Wyss and Cherix, 2006). Therefore, the development of additional indica-tors for PMI estimates beyond 1 month would constitute a welcome addition to the toolkit of forensic criminal in-vestigators.
According to Payne (1965), the decomposition of ca-9
10 Chapter1 davers can be separated into six stages: fresh, bloated,
active decay, advanced decay, dry and remain stages. During the ‘bloated’ and ‘active decay’ stages (Payne, 1965; Carter et al., 2007), the release of cadaver liq-uids into the soil changes the chemical parameters dras-tically (Vass et al., 1992) This perturbation of the soil environment has been referred to as ‘ephemeral re-source patches’ (Barton et al., 2013) leading to the development of ‘cadaver decomposition islands’ (CDI) (Carter et al., 2007). Although most of the decom-position takes place in the first few weeks under op-timal conditions, cadaver effects on the soil environ-ment can be long lasting. For example, Towne (Towne, 2000) showed that nitrogen and phosphorus concentra-tion and pH were still significantly enhanced in soil sam-ples taken under cadavers 2 years after laying ungulate cadavers on a prairie, while Melis et al. (Melis et al., 2007) reported enhanced soil calcium content and pH as late as 7 years post mortem in a CDI. Such envi-ronmental changes were shown to have an effect on the soil fauna (Bornemissza, 1957), bacteria (Horswell et al., 2002; Howard et al., 2010; Moreno et al., 2011) and fungi (Hawksworth and Wiltshire, 2011; Carter and Tibbett, 2003). However, knowledge about cadaver effects on soil communities remains very limited, and almost nothing is known about the response of soil protists (Szelecz et al., 2014).
In this study, we focused on euglyphid testate amoe-bae (Rhizaria: Cercozoa), a highly diverse and abun-dant group of protists that reacts rapidly to environmen-tal changes by shifts in community structure and abun-dance (Foissner, 1999b). Euglyphids include about one quarter of the ca. 300 testate amoeba morphospecies known to occur in soils (Foissner, 1999b). These amoe-boid unicellular protists range mostly between 20 and 150 µm in length, and their densities typically range between ca. 106 and 108 individuals per square me-tre (Foissner, 1987). They build a shell (test) rein-forced with ornamented self-secreted siliceous plates, and these shells allow species identification even after the death of the organism (Meisterfeld, 2000a,b). Most eug-lyphids are heterotrophs and feed mainly on bacteria and fungi (Gilbert et al., 2000). The distribution patterns of soil testate amoebae along environmental gradients and their response to environmental changes have been well studied, including soil humidity (Bobrov et al., 1999; Booth, 2008; Swindles and Ruffell, 2009); temperature (Beyens et al., 2009; Tsyganov et al., 2011); pH (Booth, 2001; Charman, 2001; Mitchell et al., 1999, 2008); and pesticide (Petz and Foissner, 1989), nitrogen, phospho-rus and sulphate concentration (Gilbert et al., 1998a,b; Mitchell, 2004; Payne et al., 2010). They can thus be expected to also respond to the presence of decompos-ing cadavers. The generation time of euglyphids, which ranges from ca. 2 days to 1 week under natural con-ditions (Heal, 1964), is considerably longer than that of bacteria or smaller protozoa such as nanoflagellates, and this represents an advantage regarding their use as bioindicators. It is indeed short enough to allow them to (re)colonise rapidly suitable habitats (Wanner et al.,
2008; Wanner and Elmer, 2009) and respond to environ-mental change over a period of weeks. However, as eu-glyphids are highly sensitive to environmental conditions, the effects on communities can be expected to be long lasting under continuous environmental stress. So espe-cially for estimating longer PMIs, euglyphids might be a group to consider for forensic applications.
However, a current limitation to the development of euglyphid analysis (or that of other soil protists) as a stan-dard tool for PMI estimates is taxonomy. Sound taxon-omy is indeed a prerequisite for the use of a group of organisms as bioindicators. Up to now, all ecological stud-ies on testate amoebae were based on morphology-based species identifications. The morphological identification of testate amoebae requires taxonomic expertise and is time-consuming. Furthermore, recent molecular taxon-omy studies on euglyphids have revealed the existence of a substantial higher diversity than estimated based only on morphology (Chatelain et al., 2013; Heger et al., 2011), and this hidden/unknown diversity may prove to have bioindication value. The molecular approach pre-sented in this study overcomes the current limitation of morphology- based taxonomy and is also faster (i.e. weeks instead of months for the number of samples analysed here).
Analysis of environmental samples (e.g. soil, water, faeces) targeting a specific DNA barcode gene and aim-ing at characterisaim-ing the entire community is referred to as metabarcoding (Taberlet et al., 2012). The V9 region of the 18S rRNA gene has sufficient variabil-ity for obtaining reasonably high taxonomic resolution (Amaral-Zettler et al., 2009; Adl et al., 2013) and two main advantages for biodiversity surveys as follows: (1) it is short and thus likely to be well preserved in environmen-tal DNA samples and (2) it contains highly conserved sites allowing to designing primers for virtually all eukaryotes (Valentini et al., 2009). The advent of high-throughput sequencing (HTS) now allows using the metabarcoding approach in ecological studies with high sample numbers (e.g. spatial and/or temporal sampling).
In this study, we used a DNA metabarcoding approach applied to the V9 region of the 18S rRNA gene to as-sess the temporal response of soil euglyphid testate amoe-bae to decomposing cadavers over a period of 35 months (1051 days). Given the sensitivity of the technique and the well-documented response of testate amoebae to eco-logical gradients, changes and disturbances, we expected to find (1) a higher diversity of soil Euglyphids than gen-erally inferred from microscopic analyses and (2) a strong generally negative response of communities to decompos-ing cadavers with i) rapid disappearance of the majority of taxa following the massive release of cadaver fluids in the soil and ii) slow recovery after the end of the active decay phase, ca. 1–2 months after the peak of cadaver fluid input in the soil. If such patterns were indeed found, this may lead to the development of new PMI indicators in the future.
1.2
Materials and methods
Sampling site
The experimental site is situated in a beech- (Fagus syl-vatica) and oak- (Quercus robur, Q. petraea) dominated forest near Neuchâtel (Switzerland 47◦ 00’ N; 06◦ 56’ E, elevation 478 m). The overall average temperature mea-sured over the course of the experiment was 10.4◦C (SD 6.09 ◦C). The mean annual precipitation of the nearest meteorological station (Neuchâtel) for 1993 to 2013 was 974 mm per year (MétéoSuisse).
Experimental setup
The experiment included three treatments: control (plots of forest soil left under natural conditions), fake pig (plas-tic bags filled with a volume of soil similar to that of the pigs placed in a cotton cloth) and pig (Sus scrofa). The fake pig treatment was used to differentiate the chemical effect of pig cadaveric liquids from the physical effects (i.e. humidity, soil compaction) due to the presence of a carcass on the soil. The bag volume was kept approxi-mately similar to that of the pigs by removing soil from the bag to mirror the volume loss of the pig cadavers over time. The pigs (20 kg±1 kg) were killed on the farm with captive bolt stunning and the cadavers imme-diately brought to the experimental site. The cadavers were placed in strong metal wire cages (90×100×50 cm) to protect them from scavengers. The cages also allowed moving the cadavers for sampling. Pigs are commonly used in comparable forensic studies due to the similarities with humans, comparable thoracic cage size and almost naked skin (Stokes et al., 2013). Each treatment was run in triplicate. The sampling plots were organised into three randomised blocks (15–34 m apart). Within each block, the plots were at least 4 m apart.
Sampling and chemical analyses
Eight sets of samples were collected from the onset of the study (August 5th, 2009=D0) until June 21st, 2012 (Table 1.1). At the onset of the experiment (D0, before the pigs and fake pigs were placed), ini-tial control samples were collected from all sampling plots and pooled for each block (i.e. three pooled sam-ples in total). Sampling days were scheduled according
Table 1.1: Sampling dates and corresponding decomposition stages of the pig cadavers in a Fagus-Quercus forest above Neuchâtel, Switzerland.
Sample code Sampling date Decomposition stage D0 05/08/2009 Fresh D8 13/08/2009 Active decay D15 20/08/2009 Dry stage D22 27/08/2009 Dry stage D33 07/09/2009 Dry stage D64 08/10/2009 Dry stage D309 10/06/2010 Dry stage D1051 21/06/2012 Dry stage
to decomposition stages (Table 1.1) (Payne, 1965). On each sampling day, ca. 25 g of soil was taken to a depth of 10 cm in each plot and stored at -80◦C. Soil subsamples (3 g) were dehydrated (40 ◦C, 12 h), ground to pow-der and analysed for total organic carbon (Soil_C) and total nitrogen (Soil_N) using combustion infrared spec-troscopy (CHNEA1108-Elemental analyser, Carlo Erba Instrument) after decarbonation with HCl (Harris et al., 2001).
Molecular analyses
DNA was extracted from soil samples using the MoBio PowerSoil DNA Isolation Kit (Carlsbad, CA, USA) fol-lowing the manufacturer instructions. The SSU rRNA V9 region was amplified by PCR using the specific eu-karyotic primers 1380f/1510r (CCCTGCCHTTTGTACACAC / CCTTCYGCAGGTTCACCTAC) (Amaral-Zettler et al., 2009). Forward primers were tagged on the 5’ end with a 10 nu-cleotides strand, specific to each sample. PCR reactions were run in triplicate with a PTC-200 Peltier Thermo Cy-cler (BioConcept, Allswill, Switzerland) with 1 ng of envi-ronmental DNA, 6 µL of 10x PCR buffer, 0.6 µL of each primer, 0.6 µL of each dNTP 400 µM (Promega) and 0.2 µL of 0.05 U/µL Go Taq (Promega). The volume was adjusted to 30 µL with ultra-pure water. Amplification was conducted with the following conditions: denatura-tion at 94 ◦C for 3 min, 30 cycles at 94 ◦C for 30 s, 57 ◦C for 60 s and 72 ◦C for 90 s and final extension at 72 ◦C for 10 min (Amaral-Zettler et al., 2009). PCR products were purified through QIAquick PCR Purifica-tion Kit (Qiagen, Hilden, Germany) and pooled together with a 4 ng DNA of each sample.A DNA library was pre-pared using the New England Biolabs’s kit NEBNext DNA Sample Prep Master Mix Set 1 (http://www.neb.com/ nebecomm/ManualFiles/manualE6040.pdf) except for the size selection step. Sequencing was done by the Ge-nomics Core Facility at Brown University (Providence, USA) with an Illumina® HiSeq 2000 sequencer to ob-tain paired-end reads covering the full length of the V9 region.
Sequence treatment
A database was constructed by selecting 44 complete eu-glyphid V9 sequences from the GenBank database, us-ing sequences derived both from identified organisms and from related environmental sequences retrieved from Gen-Bank. Each environmental V9 read was compared to the database using the BLASTn algorithm (Altschul et al., 1997) in order to select euglyphid sequences. Before the BLASTn, each nucleotide with a Phred score below 28 was changed to an unknown nucleotide ‘N’ in order to avoid unreliable nucleotides. The BLASTn algorithm was setup with a match/mismatch ratio of 1:-1, gap open and extend penalty, respectively, of 0 and 2 and a word size of 32 nucleotides. We used an empirically deter-mined e-value threshold as the criterion for classifying a read as belonging to the euglyphids. To determine the appropriate e-value threshold, a subset of eukaryotic V9
12 Chapter1 sequences (sample D309, block 2, pig treatment) was
compared by BLASTn to the previously established eug-lyphid V9 sequence database with a permissive e-value (i.e. 10). The hit results were sorted by increasing e-value and compared to the GenBank database by BLASTn, using the previous setup, until sequences corresponding to taxa other than euglyphids were found. Once the e-value threshold was found (i.e. 8e-29), each environ-mental sequence was compared against the V9 euglyphid database using BLASTn. Only sequences over 130 nu-cleotides long and occurring at least five times in the 66 samples were retained, in order to remove possible false-positive sequences. As our database showed that some closely related but nevertheless morphologically and ge-netically (e.g. COI gene or full SSU) distinct euglyphid morphospecies shared exactly the same V9 sequence (e.g. Euglypha penardi (EF456753) and Euglypha cf. ciliata (EF456754); Lara et al., 2007b), we considered each un-ambiguous difference in the nucleotide sequence as suffi-cient for discriminating two OTUs. Conversely, when two sequences differed only in ambiguous nucleotides, they were considered as belonging to the same OTU. The re-sulting OTU sequences were then counted in each sample.
Numerical analyses
We assessed the response of the 51 OTUs found in the 66 samples to the different treatments using partial re-dundancy analysis (RDA) on Hellinger-transformed data (Legendre and Gallagher, 2001) with the blocks used as conditional variable. Rare OTUs (present less than three times in a minimum of ten samples) were removed to reduce noise in the model and optimise the adjusted R2 (Borcard et al., 2011). These thresholds were se-lected after testing several options (presence threshold 1, 3, 5, 7; minimum number of presence 7, 10, 12, 14). The significance of variables (Soil_C, Soil_N, treatment) and ordination axes (first, second and third) were assessed using Monte Carlo tests (999 permuta-tions, p value threshold=0.05). We assessed the ef-fect of the treatments, relative to control, on the OTU responses over time using a principal response curve (PRC) (van den Brink and Ter Braak, 1999). The model was also tested using a Monte Carlo procedure (999 permutation, p value threshold=0.05). All statistical analyses were performed with R-2.13.1 (R_Core_Team, 2013) using package vegan (Oksanen et al., 2013) for the Hellinger transformation, RDA and PRC analyses.
Retrieval of full-length SSU rRNA gene
se-quences of selected taxa and phylogenetic
analysis
Because sequences of the V9 variable region of the SSU rRNA gene are short (i.e. generally less than 200 bp), they are not suited for inferring the position of OTUs in phylogenetic trees. This is especially problematic if the considered sequences are suspected not to cover a large part of the diversity of the group of interest (Dunthorn et al., 2014). In order to place the OTUs of
interest (i.e. showing a strong response to cadavers) in a phylogenetic tree, we used the sequence information in-cluded in the V9 region to design specific reverse primers and amplified the rest of the SSU rRNA gene. We de-signed specific primers to amplify specifically two phy-lotypes that responded positively to the pig treatment: eugly_13R (CACGAACTGAAGGCAAGCCCA) and eugly_666R (TTCACTTCCAATCACAGGAG). The newly designed primers were used in combination with the euglyphid-specific for-ward primer Eugly1SSUF (GCGTACAGCTCATTATATCAGCA (Chatelain et al., 2013)) located at the beginning of the SSU rRNA gene. DNA extractions, where the OTU was most abundant, were selected for specific amplification of the SSU rRNA gene of interest. Cycling profile was the same as described above (with 40 cycles). PCR products were cloned into pCR2.1 Topo TA cloning vec-tor (Invitrogen) and used to transform E. coli TOP10’ OneShot cells (Invitrogen) according to the manufac-turer’s instructions. Up to five clones per PCR prod-uct were chosen for sequencing. Sequencing was per-formed with an ABI-3130xl DNA Sequencer (Applied Biosystems). The new sequences obtained were placed into an alignment that comprised all euglyphid sequences retrieved from GenBank, which included both environ-mental clones and sequences derived from identified or-ganisms. The alignment was performed using MUSCLE (Edgar, 2004). A maximum likelihood tree was built using the RAxML v7.2.8 algorithm (Stamatakis, 2006) as pro-posed on the portal (http://phylobench.vital-it. ch/raxml-bb/) using a general time-reversible model. Rate heterogeneity was estimated using a CAT model. The two sequences can be found on GenBank with the accession numbers KX999711.1 (eugly_666) and KX999712.1 (eugly_13).
1.3
Results
Diversity and structure of euglyphid OTU
assemblages
Of the 247,366,905 raw Eukaryote reads, 187,566 were identified as euglyphids and 57,533 of these were found at least five times overall (Table 1.2). These 57,533 reads were divided into 198 OTUs. Of these, 51 OTUs
Table 1.2: Summary of the sequence filtering of euglyphid testate amoebae from the control, fake pig and pig cadaver plots in a Fagus-Quercusforest above Neuchâtel, Switzerland.
Analysis step Total reads Euglyphid sequences Euglyphid dereplicated reads Euglyphid OTUs Raw fastq 247’366’905 — — — Blast selection 187’566 187’566 — — Reads >= 5 times 57’533 57’533 2’621 — OTUs building 52’860 57’724 2’624 198 OTUs selection 52’860 52’860 — 51 Triplication D0 57’640 57’640 — 51
Table 1.3: Summary of total euglyphid testate amoeba OTU abun-dance in the control, fake pig and pig cadaver plots in a Fagus-Quercusforest above Neuchâtel, Switzerland.
Euglyphid OTUs Total abundance eugly_59 4234 eugly_13 4205 eugly_2 4149 eugly_12 3873 eugly_666 3161 Euglypha rotunda AJ418783.1 3056 Euglypha filifera AJ418786.1 2583 eugly_66 2530 Uncultured eukaryote EF025028.1 2279 eugly_81 2048 eugly_151 1949 eugly_156 1933 eugly_5 1916 eugly_136 1630 eugly_183 1451 eugly_322 1400 eugly_38 1227 eugly_307 1199 eugly_54 1186 Assulina muscorum AJ418791.1 1162 eugly_113 1086 eugly_234 946 Cercomonadida env sample EF024983.1 858
Euglyphid OTUs Total abundance eugly_79 675 eugly_33 594 eugly_41 514 eugly_60 417 eugly_290 411 eugly_991 402 eugly_98 382 eugly_320 367 eugly_992 349 eugly_16 314 eugly_473 273 eugly_862 253 eugly_82 238 eugly_76 211 eugly_80 203 eugly_973 195 eugly_233 182 eugly_1245 177 eugly_854 176 Tracheleuglypha dentata X77698.1 176 eugly_282 172 eugly_885 170 eugly_371 165 eugly_250 141 eugly_120 134 eugly_1777 105 eugly_1716 96 eugly_1890 87
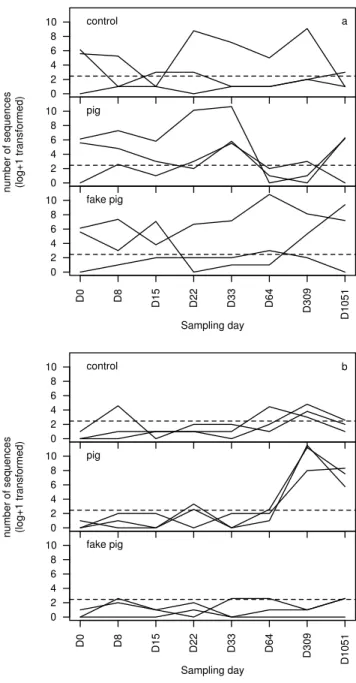
respected the thresholds and were thus retained for fur-ther analyses. Six of these OTUs matched exactly with sequences from our database. Total OTU abundance data are summarised in Table 1.3, and OTU richness and num-ber of euglyphid reads along time for the three treatments are shown in Figure 1.1.
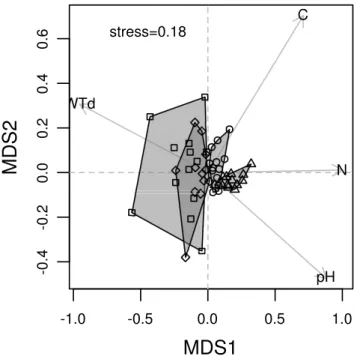
The partial redundancy analysis (RDA, Figure 1.2) with the blocks used as conditional variable revealed a sig-nificant correlation between euglyphid communities and Soil_N and Soil_C (Monte Carlo test, 999 permutations, both p=0.01). Axes 1 and 2 were significant (p=0.005 for both). The RDA ordination showed that the pig treat-ment samples diverged from the control and fake pigs along the soil nitrogen content gradient until day 309 af-ter which they converged again with the samples of the other two treatments. The RDA also showed that most OTUs responded negatively to the pig treatment. How-ever, some OTUs responded positively to the pig treat-ment (e.g. eugly_13, eugly_666).
The principal response curve (Figure 1.3) sum-marises the treatment effects on OTUs over time and shows the average responses of individual OTUs. The first PRC axis explained significantly (p<0.03) 42 %
Figure 1.1: Temporal patterns of euglyphid OTU richness (a) and number of reads log +1 transformed (b) in soil samples from con-trol, fake pig and pig cadaver plots in a Fagus-Quercus forest above Neuchâtel, Switzerland. Treatments are represented by line type (plain: control, dashed: pig, dotted: fake pig). The vertical lines show the standard deviation of the richness and number of reads for each treatment and sampling date. The lines for the three treat-ments are slightly offset to improve readability.
of the model variance, while time and treatments ex-plained, respectively, 10 and 27 % of the variance. Qual-itatively, the PRC diagram showed an overall negative effect of the pig treatment (D8 to D1051) on the major-ity of euglyphid OTUs and the positive response of a few OTUs, especially eugly_666 and eugly_13, which were therefore further studied.
Retrieval of full-length SSU rRNA gene
se-quences of eugly_13 and eugly_666
All clone sequences obtained were identical (n=5 and 8, respectively). Phylogenetic analyses confirmed the position of the two phylotypes within euglyphid testate amoebae (supported with 100 % bootstrap value) and showed that they did not belong to any barcoded fam-ily (Figure 1.4) (Heger et al., 2010). They were basal to all known euglyphid families.Eugly_13 branched robustly (80 % bootstrap) with an environmental sequence from freshwater sediments (freshwater 13_2.2 AY620297). By contrast, eugly_666 did not branch robustly with any se-quence—be it from environmental samples, cultures, or isolated cells.1.4
Discussion
Euglyphid community responses to
decom-posing pigs
This study showed that the presence of decomposing pig cadavers significantly affected the community structure of
14 Chapter1
Figure 1.2: Partial redundancy analysis (RDA) ordination diagram showing the temporal patterns of soil euglyphid testate amoeba communities (OTUs) in control, fake pig and pig cadaver plots in a Fagus-Quercus forest above Neuchâtel, Switzerland. Diamonds represent treatment centroids and arrows represent weight percent-age of total organic carbon (Soil C) and total nitrogen (Soil N). Percentages of variance explained by axes are shown in brackets. In Figure 2a, successive sampling dates for each treatment (Day 0, 8, 15, 22, 33, 64, 309, 1051) are connected by lines. The lines corners correspond to the centroid (average for RDA1 and RDA2 coordi-nates) of three samples of the same treatment and same sampling day. Treatments are indicated by line type (plain: control, dashed: pig, dotted: fake pig), fonts of the sample labels (plain: control, bold: pig, italic: fake pig) and symbols ("+": control, triangle: fake pig, star: pig). Empty circles represent Day 0 for each block. In Figure 2b, OTUs responses are represented by dots. The two OTUs for which full SSU sequences were obtained are represented in bold. The OTUs with a peffect match with a data base sequence are represented with their names.
euglyphid testate amoebae, showing a drastic decrease in sequence abundance and in OTU richness (Figure 1.1). This result is in agreement with our general working hypothesis. The negative effect of a cadaver on eu-glyphid communities was correlated to the large input of nitrogen and organic carbon in the soil. This re-sult was consistent with previous studies, which show that inputs of nitrogen strongly and negatively influenced
Figure 1.3: Principal Response Curve (PRC) diagram showing the effects of pig (dashed line) and fake pig (dotted line) treatments relative to control treatment over time on soil euglyphid testate amoeba communities in a Fagus-Quercus forest above Neuchâtel, Switzerland. The average response of individual OTUs is shown on the right axis. The two OTUs for which full SSU sequences were obtained are framed. GenBank accession numbers represent sequences that matched perfectly with the database.
testate amoeba communities (Gilbert et al., 1998a,b; Mitchell, 2004). It is probable that most euglyphids died because of anoxic conditions, but a direct or indirect effect of high nitrogen content is also possible.
However, two well-represented OTUs, namely eu-gly_13 and eugly_666 (eugly_991 also responded pos-itively but was less abundant), responded pospos-itively to the presence of cadavers, but only in the late decom-position stage (i.e. after 1 month to 1 year). These OTUs were present but rare at the beginning of the de-composition process as well as in the control and fake pig treatment, but their abundance peaked, respectively, at D33 and D309 in the pig treatments only and in the three replicates simultaneously (Figure 1.5). This suggests that they did not benefit from the initial perturbation brought by the release of cadaveric fluids but rather found opti-mal conditions (i.e. abiotic, e.g. soil water chemistry, and biotic, e.g. prey and/or low level of competition or pre-dation) for their growth in later stages. These organisms probably benefited from changes in the bacterial com-munities, as these are supposed to change deeply and progressively underneath a cadaver (Allison and Martiny, 2008; Fierer et al., 2012; Ramirez et al., 2010). Indeed, previous studies have shown that decomposing carcasses cause an increase in soil bacterial biomass (Barton et al., 2013) but also drastically change bacterial community structure (Howard et al., 2010; Moreno et al., 2011). As
! " # $ % # # & # '$ () # # & # '$ $ * " # $ # # & # $ $ # # & # $ ' # # & # " # $ * " # $ ' ' ' ' ' ' ' '' ' ' ' * ' ' () ' ! + * " # ,-. '' / ' ' & 0 12$ ' 3 '& 3 4 & ,2 $ 12 ' 3 & &( 12$ $ 3 .3 ' 1/ 1/ 1/ 1/ ' 1/ 1/ 1/ 1/ ' 1/ 1/ ' * 1/ 1/ 1/ 1/ ' . ' ' 1) . ' ' # 5 , $ .$ 1) . ' * . ' . ' - * ' 6 1 & ' ' ' ' 4'' 0 # , ' # 5 , $ .$ 1) # 5 , $ .$ 1) 7 8 ' ' . ' . ' ' ' . 9$ $ ' . & $ $ . & $ $ . & $ $ . . 9$ $ . . 9$ $ ' . . 9$ $ . . 9$ $ . . 9$ $ . . 9$ $ . : ; < - & # . 5 = 0= > #5 ? # +
Figure 1.4: Maximum likelihood tree built on full SSU rRNA gene sequences of Euglyphida showing the phylogenetic position of eugly_13 and eugly_666 full length sequences (in bold) obtained from pig cadaver plots in a Fagus-Quercus forest above Neuchâtel, Switzerland. The tree was built using RaxML on 1440 positions and rooted with several cercozoan sequences retrieved from GenBank. Robustness of nodes was evaluated by bootstrapping (1000 replicates).
bacteria constitute a large part of euglyphid food regime (Meisterfeld, 2000b), any change in the abundance or community structure of bacteria is likely to also influence the abundance and community composition of euglyphids. It may also be that these taxa represent nutrient-tolerant organisms that benefit well from high abundance of prey organisms, but with low competitive ability in the nor-mally more oligotrophic conditions. The precise mecha-nism for this response however remains to be elucidated. A possible bias could have been due to the import of euglyphids with the cadavers, either from the farm or dur-ing transport. However, at D8, cadaver samples were less
different from the control than samples from fake cadav-ers (which could not have been contaminated by the new plastic bags and cotton cloth), and we therefore conclude that such contamination was negligible.
The effect of cadavers on euglyphids peaked at D309 (Figure 1.3). This time interval seemed quite long in comparison with the results obtained by Szelecz et al. (2014) from the same field experiment (i.e. com-plete die-out of testate amoebae 22 days post mortem). However, Szelecz et al. (2014) studied litter and not the underlying mineral soil horizon as done here, and they used a direct observation (microscopy) approach,