Confidence Bounds for the Estimation of the Volume
Phase Fraction from a Single Image in a
Nickel Base Superalloy
Rémi Blanc,1 Pierre Baylou,2Christian Germain,2 and Jean-Pierre Da Costa2,*
1Rémi Blanc, Computer Vision Laboratory, ETHZ, Sternwartstrasse 7, ETH-Zentrum, CH-8092 Zürich, Switzerland 2IMS, LAPS Department, CNRS UMR 5218, University of Bordeaux, Université Bordeaux 1, 351 Cours de la Libération,
33405 Talence, France
Abstract: We propose an image-based framework to evaluate the uncertainty in the estimation of the volume fraction of specific microstructures based on the observation of a single section. These microstructures consist of cubes organized on a cubic mesh, such as monocrystalline nickel base superalloys. The framework is twofold: a model-based stereological analysis allows relating two-dimensional image observations to three-dimensional microstructure features, and a spatial statistical analysis allows computing approximate confidence bounds while assessing the representativeness of the image. The reliability of the method is assessed on synthetic models. Volume fraction estimation variances and approximate confidence intervals are computed on real superalloy images in the context of material characterization.
Key words: measurement uncertainty, phase fraction, single section stereology, spatial statistics, nickel base superalloy, scanning electron microscopy
I
NTR ODUCTIONIn quantitative microscopy, the stereological estimation of the volume fraction of a material microstructure on the basis of section images is a recurrent issue. To achieve such an estimation, a common way is to use either multiple random or systematic parallel sections ~Cruz-Orive & Myk-ing, 1981!. However, in an industrial context with drastic time and cost constraints, measurements must often be done using a single section of a sample. The surface fraction can be estimated by image analysis, using appropriate algo-rithms for the segmentation of the phase of interest on the image. Segmentation algorithms, as they depend on the observed microstructure, on the sample preparation, but also on the image acquisition protocol, will not be ad-dressed here. However, even assuming that this segmenta-tion is achieved without any error, it is crucial to tackle the question of the uncertainty of the measures done on a single image. Indeed, establishing confidence intervals for the true volume fraction of a microstructure based on the limited observation of a single section is not a trivial task. This question can be divided into two distinct problems.
First, a careful stereological analysis is a prerequisite for the interpretation of the two-dimensional ~2D! image in the three-dimensional ~3D! context of the microstructure. In particular, this analysis makes possible the detection and the correction of an eventual stereological bias, which may require a specific model of the microstructure ~Russ & Dehoff, 2000!.
Second, the statistical aspects related to the representa-tiveness of the available image sample must be tackled. This involves the analysis of the spatial distribution of the phase of interest and the evaluation of the statistical properties of the phase fraction estimator ~Lantuéjoul, 1991; Blanc et al., 2008!.
In this article, we focus on 3D microstructures showing cubes on a cubic mesh. In particular, we detail the elabora-tion of confidence intervals for the estimaelabora-tion of the g'
volume fraction in a monocrystalline g/g' nickel base
su-peralloy, pointing out the general concepts.
In the Material and Methods section, we propose a brief description of the g/g' superalloy and address the
stereological and inference issues related to the observation of a single section. Three-dimensional models of the mate-rial are proposed, on the basis of which we investigate the statistical properties of two estimators of the g' surface
fraction. In particular, we focus on their reliability, on their mathematical expectation and variance, and on the influ-ence of the section angles. Finally, we propose a method to
Received March 31, 2009; accepted January 14, 2010
calculate the variance of the estimators based on a single image. This method is based on spatial statistics and takes advantage of the stationarity of the microstructure to com-pute the estimation variance.
In the Results section, the method is first validated on synthetic images generated from the 3D models. Second, it is applied to scanning electron microscope ~SEM! images of a g/g' nickel base superalloy in the goal of material
characterization.
M
ATERIAL ANDM
ETHODSThe g/g
'Superalloy and the Phase Fraction
Estimators
The microstructure of the monocrystalline nickel base su-peralloy consists of two phases: a g' phase composed of
quasicubic particles organized on a cubic mesh and a g phase consisting of thin walls separating the g' particles.
The mean side of the g'cubes is about 400 nm, while the g
walls are generally about 50 nm thick.
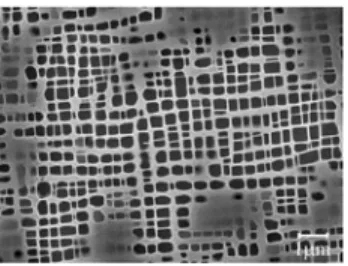
Prior to microscope imaging, a sample preparation is performed that includes sectioning, polishing, and an appro-priate chemical etching. Sectioning is performed approxi-mately along the $100% axis. In practice, possible deviations of up to 158 could occur. The thickness of the sample is about 5 to 10 mm. The mechanical polishing is done using abrasive papers and diamond. Chemical etching involves a 5 s electrochemical attack using a 1% fluorhydric acid solution. Imaging is performed with a SEM in the second-ary electron mode. The SEM was operated at 20 kV, and the image magnification was 5,000⫻. Images such as the one in Figure 1 are produced. The g' phase appears as dark gray
rectangles, while the g phase appears in light gray. Large shapes with intermediate gray levels also appear. They are called hazy areas in the following.
The fractions of g and g'phases are crucial parameters
directly related to the physical properties of the superalloy. These parameters can be estimated by image analysis through the segmentation of the image in two classes, corresponding to each phase. Nonetheless, the hazy areas are difficult to interpret. As stated in Germain et al. ~2005!, they are related to quasi-longitudinal sections of g layers and are sometimes considered as belonging to the g phase. However, as pointed out in Georget and Peyroutou ~1990!, around these regions,
the altitude difference caused by the chemical etching be-tween the g and g' phases is low, inducing a low contrast
on SEM images. This makes the image segmentation into two phases, and thus the fraction estimation, quite unreli-able. Consequently, Georget and Peyroutou ~1990! pro-posed to segment the images into three classes: two classes for the g and g'phases and a third class for the hazy areas
where the membership to one of the two classes is uncer-tain. They proposed to estimate the phase fraction by ignor-ing the pixels belongignor-ing to the hazy areas. Let the number of pixels belonging to the g, g' and hazy area classes be
noted, respectively, as Ng, Ng', and Nhz. The direct g'
phase fraction estimator [t2Dand the estimator proposed by
Georget and Peyroutou ~1990! It2Dcan be expressed,
respec-tively, as [t2D⫽ Ng' Ng⫹ Ng'⫹ Nhz and It2D⫽ Ng' Ng⫹ Ng' . ~1!
As these concurrent estimators are based on 2D mea-surements, their relation to the target parameter, i.e., the true volume fraction t3D, has to be investigated more
thoroughly.
Material Models and Stereological Considerations
An ideal model ~Germain et al., 2005! of the g/g'
super-alloy consists of a regular arrangement of identical cubes of side c organized on a cubic mesh and separated by walls of thickness e, as described in Figure 2a. Let P be the section under study. Its azimuth w and elevation u angles are defined according to the directions of the cubes as shown in Figure 2b. For symmetry reasons, we will only consider ~w, u!僆 @0;p/2@2.
Though not giving a realistic representation of the microstructure—which is stochastic by nature—this model proved to bring valuable insights for the interpretation of Figure 2. ~a! Ideal model of the g/g' superalloy and ~b! section
the real material images in their 3D context. Indeed, based on this simple model, Germain et al. ~2005! proposed to interpret the hazy areas as longitudinal sections of the g phase and validated this hypothesis using two independent methods on real material images. In the following, for a 2D observation with fixed size and resolution similar to Fig-ure 3, we suppose that the main source of error in the estimation of the volume fraction is related to the strong periodicity of the cubic arrangement of the g'phases and is
thus mainly a 2D/3D inference problem. As a consequence, we propose to further investigate this geometric model in order to build a more accurate and more robust estimator of the true volume fraction that explicitly accounts for the 3D structure of the material. The influence of the image size on the estimation is addressed in the Results section.
Under this model, let us consider an “infinite,” un-bounded sample taken on a section parallel to one of the g'
cube faces ~e.g., u⫽ 0, section $100%!. On such a section, considering a uniform distribution of the section altitude, the g' surface fraction is either c2
/~c⫹ e!2with probability
c/~c⫹ e! or 0 with probability e/~c ⫹ e!, depending on the
relative altitude of the section. In the following, the particu-lar value c2
/~c⫹ e!2 will be called t2D. The mathematical
expectation of the g'surface fraction is thus clearly equal to
the true volume fraction t3D⫽ c3/~c⫹ e!3, as expected from basic stereology. Nonetheless, no such single section will provide the true volume fraction. This difficulty illustrates the stereological rule that suggests avoiding sections parallel to the characteristic directions of the microstructure ~Russ & Dehoff, 2000!. Nevertheless, a stereological correction can be applied on such sections as we clearly have:
t3D⫽ t2D 3/2
. ~2!
On the contrary, a single randomly oriented section, as long as the observed surface is large enough, will almost surely ensure the equivalence between the surface and vol-ume fractions. Among all possible sections, the oblique section $111%—investigated in another context in Blanc et al. ~2006!—is of particular interest from a stereological point of view. Indeed, such a section cuts the three main orthogonal directions of the material with the same angle, approximately 558, which allows better—i.e., low variance— estimates of the volume fractions. Beyond statistical
consid-erations, the oblique section also prevents intersecting the g walls between g' cubes with a low angle, thus minimizing
the extent of regions with low g wall thickness that lead to hazy areas after chemical etching ~see The g/g' Superalloy
and the Phase Fraction Estimators subsection!.
In spite of these considerations, section elevation an-gles around $100% are preferred because they enable more robust morphological measurements on the g'cubes
includ-ing cell width and wall thickness, which are also relevant for characterizing the material properties.
To investigate the influence of the hazy areas on the phase fraction estimators, we extended the 3D model de-scribed in Germain et al. ~2005! by introducing random shifts in the position, size, and orientation changes for the g' particles. The “horizontal” g layers were also marked
using a third label corresponding to the hazy areas, which appear in gray on the images of model sections given in Figure 4a,b.
Measurement Accuracy on a Single Section
In practice, because of industrial time and cost constraints, only one single section of a material sample is available, from which one single image is acquired. The estimation It2Dof the volume phase fraction and also its uncertainty
~i.e., its variance or confidence intervals! have thus to be carried out on the basis of this single image, which is, by nature, spatially limited. Though only one realization of It2D
is observed, the computation of the estimation variance is possible by taking advantage of the assumed statistical prop-erties of the microstructure.
Mathematically speaking, we will consider that the mi-crostructure is analogous to a stationary ergodic random process. An image sample is then a spatially bounded real-ization of this random process. A random process is said to be stationary if its statistical properties are invariant by translation. A stationary random process is said to be ergo-dic in mean if the estimation of the mean using a finite sample converges to the mathematical expectation when the sample size tends to infinity. These two properties mean that the material phase fraction can be estimated using only a single image provided that its size is sufficiently large. Figure 3. Original SEM image of a nickel base superalloy.
Figure 4. Images of sections of the model with ~a! ~w⫽ 08, u ⫽ 78! and ~b! ~w⫽ 58, u ⫽108!. The hazy areas are segmented in gray.
The terms stationarity and ergodicity being related to the random process, we prefer to employ the term “homo-geneity” for characterizing images. An image is said to be homogeneous if ~1! it can be considered as a realization of a stationary ergodic random process and ~2! it is large enough to represent its spatial dependence structure. An image can be tested for homogeneity by means of the dispersion variance introduced by Matheron ~1970, 1989! or of block subsampling methods ~Sherman, 1996; Politis & Sherman, 2001!. Wavelet-based methods have also been employed for such a purpose by Sharifi-Salamatian et al. ~2004!. As the microstructure is composed of separate objects, other ap-proaches based on marked point processes ~Ohser & Mück-lich, 2000! or germ-grain processes ~Stoyan et al., 1995! are also available.
Specifically, an image is said to be homogeneous for the mean if the dispersion variance decreases asymptotically as fast as or faster than the inverse of the image size ~Lantué-joul, 1991; Blanc et al., 2008!. In this case, the image can be considered as representative of its generating stochastic pro-cess, and the corresponding estimator is consistent, i.e., with a variance vanishing when the image size grows to infinity.
Briefly, if we denote S as the image observation win-dow, and s as a smaller observation within S, the dispersion variance is estimated by the sample variance of the mean estimator on blocks of size s extracted from the image. If the image homogeneity is confirmed, i.e., if the asymptotic decrease appears to be as fast as s⫺1or faster, the variance of the mean estimator is estimated by extrapolating the
disper-sion variance curve up to window size S. The detailed demonstration is out of the scope of this article, and we direct the interested reader to Blanc et al. ~2008! and refer-ences therein for more details.
In the case of images partially occulted by unreliable areas, e.g., the hazy areas, it has been shown in Blanc ~2007! that the dispersion variance estimation algorithm can be adapted without introducing bias. This adaptation consists in retaining only those blocks that exclusively cover interest-ing parts of the image, i.e., without overlappinterest-ing hazy areas. This leads to the conclusion that the hazy areas do not belong to the image or, in other words, that the image no longer has a regular rectangular support. The interpretation of the resulting dispersion variance function remains the same. In particular, the homogeneity criterion and the esti-mation variance computation are unchanged. Illustrations are given in the following section.
R
ESULTSValidation of the Stereological Properties
of the Estimators
Based on the proposed 3D model, random sections such as those of Figure 4 were produced. On each section, both estimators [t2Dand It2D defined in Eq. ~1! were evaluated,
either considering the hazy areas as belonging to the g phase, or ignoring them. In Figure 5, we plot the median Figure 5. Surface phase fraction estimation with ~lower plots! and without ~upper plots! taking hazy areas into account.
and the 25% and 75% quartiles for both estimators, ob-tained from 500 random sections for each of the specified elevation angle u. For every section, the azimuth angle w was drawn uniformly on @0;2p# .
As shown by these simulations, [t2Destimates the exact
volume fraction t3Dwithout bias but with a large variance,
though decreasing with the elevation angle. In contrast, while It2Dis clearly biased as an estimator of t3D, it appears
to be unbiased for t2D. Compared to [t2D, It2D shows a
remarkably low variance that, in addition, seems to be independent of the section elevation angle.
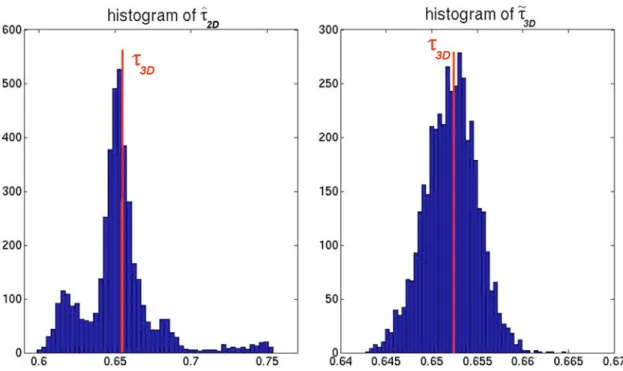
Now consider the corrected estimator It3D⫽ It2D3/2. The
histograms of the values obtained with [t2D and It3D are
given in Figure 6. Both estimators appear to have the same mean value that corresponds to the exact volume fraction t3D. However, as shown on Figure 6, [t2Dpresents a highly
irregular distribution with a large variance ~coefficient of variation: 3.7%!, while It3D looks approximately Gaussian
with a small variance ~coefficient of variation: 0.4%!. The robustness of the properties of It2D regarding the
hazy area model has been validated by dilating the hazy areas on the section images. Using morphological dilations ~Serra, 1982! with structuring elements of various sizes, no significant changes were found in the mean or the variance of the resulting estimated ratios for nonnull elevation an-gles. For the particular 08 section elevation angle, a larger variance was observed, due to hazy areas covering wide parts of some sections. Such a behavior never appears in practice because the sample preparation does not allow exactly 08 section angles, and the real microstructure does not respect perfectly the cubic model.
Let m2D, s2D2 , m3D, and s3D2 denote the mean and
variance of the estimators It2Dand It3D. Despite the
nonlin-ear relationship between them, the distributions of It2Dand
It3D⫽ It2D3/2were both found to be approximately Gaussian,
as can be seen on their quantile-quantile plots displayed on Figure 7.
This is possible as long as the variance s2D2 is small
relative to m2D, and m2Dis not too close to 0. In
particu-lar, these conditions ensure that the probability of a “nega-tive fraction” is almost surely zero under the Gaussian assumption.
Using the Gaussian approximations, we obtain the fol-lowing expression for the mathematical expectation m3D
and variance s3D2 of the distribution of the g' volume
fraction estimator: m3D⫽
冕
⫺` ` t3/2 exp冉
⫺~t⫺ m2D! 2 2s2D2冊
M
2ps2D 2 dt⬇ m2D 3/2 and s3D 2 ⫽ m 2D 3 ⫹ 3m 2Ds2D 2 ⫺ m 3D 2 ⬇ 3m 2Ds2D 2 . ~3!The exact expression of m3D, not reported here, is relatively
complex and implies modified Bessel functions of the sec-ond kind. However, as m2D/s2D2 is close to zero, it can be
approximated as indicated. Figure 6. Histogram of the ~a! [t2Dand ~b! It3Destimators.
On the example illustrated on Figure 6, this approxima-tion introduces a numerical relative difference of about 10⫺4% for the mean and 0.1% for the variance.
Confidence Regions for the Synthetic Data
These theoretical results thus allow estimating approximate confidence bounds for the true volume fraction, using the usual confidence intervals of the normal distribution. How-ever, to do so, m2Dand s2D2 need to be estimated, while the
image allows only a single realization of It2D.
From the theoretical consideration on spatial statistics described previously, the image homogeneity can be assessed. If the image fulfills the homogeneity criteria, then It2Dis an
unbiased estimate of m2D, and an estimate Is2D2 of the
vari-ance s2D2 can be obtained from the dispersion variance.
The volume fraction is then estimated by It3D⫽ It2D3/2,
and its own estimation variance is estimated by replacing the theoretical parameters by their estimations in equation ~3!:
Im3D⫽ It2D 3/2 and Is 3D 2 ⫽ 3 It 2D Is2D 2 . ~4!
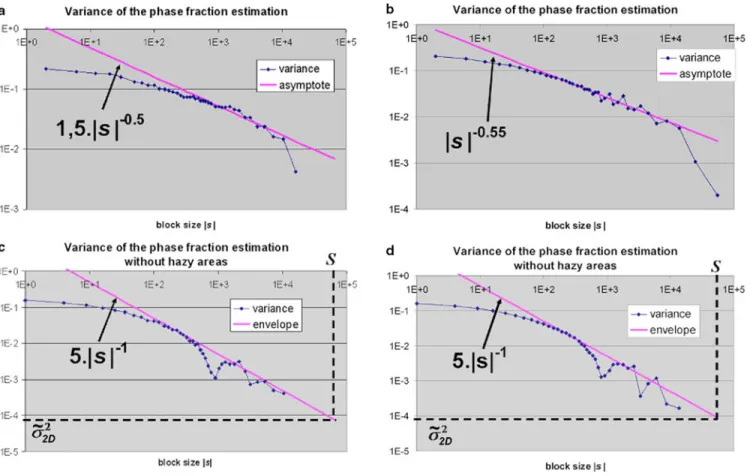
We consider images from the model first shown in the Introduction. Image samples are given in Figure 4a,b, with section angles of ~w⫽ 08, u ⫽ 78! and ~w ⫽ 508, u ⫽ 108!, respectively. For each of these images, the dispersion vari-ance has been estimated with and without taking the hazy areas into account. The results are shown in the log-log plots of Figures 8a,b and 8c,d, respectively, where the disper-sion variance is reported as a function of the block size s. The homogeneity criterion, i.e., asymptotic decrease as s⫺1, appears to be fulfilled only when the hazy areas are not taken into account, i.e., when It2Dis used ~the
correspond-ing curve envelope has an asymptotic behavior in s⫺1!. Indeed, the image size is too small to reveal clearly the spatial distribution of the hazy areas.
The fluctuations of the dispersion variance seen on Figure 8c,d are typical of strongly periodic structures ~Blanc et al., 2008! corresponding to the regular disposition of the g' particles and g channels. These fluctuations admit an
upper envelope that can be extrapolated to get the estimate Is2D2 of the variance s2D2 of It2D. Supposing that It2D is
normally distributed, we deduce approximate confidence bounds for the true volume fraction. The results are sum-marized in Table 1. For both images, the true volume fraction lies indeed within the estimated confidence interval established from the observation of a single section. For comparison, an estimate [s2D2 of the variance of [t2Dis also
provided. As it could not be obtained using the graph of the dispersion variance, it was calculated by simulation, over a sample of 500 synthetic image samples, for each angle configuration.
Experimental Results
Let now consider real material images. Images such as shown in Figure 3 have been acquired and segmented. The dispersion variance for the g' phase fraction has been
estimated with and without taking the hazy areas into account. The corresponding results are given in Figure 9a–c. The homogeneity criterion is fulfilled only when the hazy areas are ignored. As explained in the Introduction, though the proposed model is not realistic, it allows the images to be interpreted in their 3D context. The approxi-mations It3D ⫽ It2D3/2, Is3D22 ⫽ 3 It2D Is2D2 , and the Gaussian
assumption being acceptable, the confidence bounds have been computed and reported in the first row of Table 2. The other rows indicate the results obtained on various images from different samples of the same material, with identical preparation and acquisition parameters.
As can be seen from these results, the distribution of the corrected estimator It3Dis much less scattered than the
distribution of the direct estimator [t2D. Indeed, [t2Dpresents
a very high variability across those images, as indicated by the slow decrease of the dispersion variance in Figure 9b, indicating that the images are too small and cannot be considered as homogeneous. On the contrary, the corrected estimator It3Dappears to be much less scattered. Moreover,
the average It3D, which represents the most precise estimate
of the true volume ratio given the available data, lies within each 95% confidence interval estimated for each image. This confirms that the estimated confidence interval esti-mated from a single image is indeed approximately correct.
C
ONCLUSIONSIn this article, we have introduced a method for the estima-tion of approximate confidence bounds for the volume fraction of a material based on the observation of a single image section. This method relies on a stereological correc-tion of the phase fraccorrec-tion measured on selected regions of the image. The key idea is that, because the basic estimator has a very high variance, we rely on a biased estimator with low variance. A model of the microstructure is then employed Figure 8. Dispersion variance of the g'fraction computed on the synthetic samples of Figure 4b: ~a, b! including the
hazy areas and ~c, d! without hazy areas. The plots are in log-log scales.
Table 1. Volume Fraction Estimates and Approximate Confidence Intervals Computed on the Synthetic Data of Figure 4a,d.*
Image t3D t2D [t2D [s2D It2D Is2D It3D Is3D It3D62 Is3D
Figure 4a
65.3% 75.2% 65.8% 1.6% 74.9% 0.48% 64.8% 0.72% @63.4%, 66.2%#
Figure 4d 68.0% 1.2% 75.2% 0.50% 65.2% 0.75% @63.7%, 66.7%#
*t3Dis the true volume fraction. t2D⫽ t3D2/3is the corresponding surface fraction. [t2Dand It2Dare the surface fraction estimates. [s2D
and Is2Dare estimations of their standard deviations. [s2Dis obtained by simulation ~over 500 repetitions!, whereas Is2D2 is obtained by
method proved to proceed satisfactorily, providing confi-dence bounds for the volume phase fractions.
The method proposed in this article can be adapted to different kinds of microstructures. Though the stereological relations developed here are dependent on the particular spatial distribution, such relations between the 2D image and the 3D structure can generally be deduced provided a model can be developed. Then, the statistical analysis for obtaining the estimation variance is readily applicable and free of assumptions about the spatial distribution.
A
CKNOWLEDGMENTSThis work was funded both by the Aquitaine Regional Council and by the Safran Group. It has benefited from the scientific and technical support of Turbomeca Company.
R
EFER ENCESBlanc, R. ~2007!. Apport des statistiques spatiales à l’élaboration de
critères d’homogénéité et à l’inférence en analyse de textures; Application à la caractérisation de matériaux. Ph.D. thesis ~in
French!, Bordeaux University.
Blanc, R., Da Costa, J.-P., Stitou, Y., Baylou, P. & Germain, C. ~2008!. Assessment of texture stationarity using the asymptotic behavior of the empirical mean and variance. IEEE Trans Image
Processing 17~9!, 1481–1490.
Blanc, R., Germain, C., Da Costa, J.-P., Baylou, P. & Cataldi, M. ~2006!. Fiber orientation measurements in composite mate-rials. Composites Part A 37~2!, 197–206.
Figure 9. Segmentation of the experimental sample of Figure 3 into g, g', and hazy area classes. Dispersion variance of the g'
fraction ~b! including the hazy areas and ~c! without the hazy areas. The plots are in log-log scales.
Table 2. Volume Fraction Estimates and Approximate Confidence Intervals Computed on Real SEM Images of g/g'
Nickel Base Superalloys.
Image [t2D It2D Is2D It3D Is3D It3D62 Is3D ~95% confidence interval! 1 35.8% 55.4% 0.71% 41.3% 0.92% @39.4%, 43.1%# 2 47.0% 56.4% 0.80% 42.4% 1.04% @40.3%, 44.4%# 3 43.9% 55.6% 0.64% 41.4% 0.83% @39.8%, 43.1%# 4 34.8% 54.1% 0.67% 39.8% 0.85% @38.1%, 41.5%# 5 33.3% 55.4% 0.73% 41.2% 0.94% @39.4%, 43.1%# 6 39.4% 53.6% 0.67% 39.2% 0.86% @37.5%, 41.0%# Average 39.0% 40.9% Standard deviation 5.45% 1.14%
Liège, Belgium, pp. 1377–1386.
Germain, C., Blanc, R., Donias, M., Lavialle, O., Da Costa, J.-P. & Baylou, P. ~2005!. Estimating the section elevation angle of cubes on a cubic mesh. Application to nickel micro-structure size estimation. Image Analysis and Stereology 24, 127–134.
Lantuéjoul, C. ~1991!. Ergodicity and integral range. J Microsc 161~3!, 387–403.
Matheron, G. ~1970!. La théorie des variables régionalisées et ses applications. In Cahiers du centre de Morphologie
Mathéma-tique de Fontainebleau, Fasc. 5 ~in French!. Paris: Ecole
Nation-ale Supérieure des Mines.
261–275.
Russ, J.C. & Dehoff, R.T. ~2000!. Practical Stereology, 2nd Ed. New York: Plenum Press.
Serra, J. ~1982!. Image Analysis and Mathematical Morphology. London: Academic Press.
Sharifi-Salamatian, V., Pesquet-Popescu, B., Simony-Lafontaine, J. & Rigaut, J.-P. ~2004!. Index for spatial hetero-geneity in breast cancer. J Microsc 216~2!, 110–122.
Sherman, M. ~1996!. Variance estimation for statistics computed from spatial lattice data. J Royal Stat Soc B 58~3!, 509–523. Stoyan, D., Kendall, W.S. & Mecke, J. ~1995!. Stochastic