AGE, MOVEMENTS, AND FEEDING ECOLOGY OF
NORTHWEST ATLANTIC WHITE SHARKS ESTIMATED FROM
ECOGEOCHEMICAL PROFILES IN VERTEBRAE
By
Li Ling Hamady
B.A., University of California, Santa Barbara, 2006
Submitted in partial fulfillment of the requirements for the degree of
Doctor of Philosophy
at the
MASSACHUSETTS INSTITUTE OF TECHNOLOGY
and the
WOODS HOLE OCEANOGRAPHIC INSTITUTION
February 2014
MASSACHUSE TS E
OF TECHNOLOGY
'DRA RIES
©2014 Li Ling Hamady
All rights reserved
The author hereby grants to MIT and WHOI permission to reproduce and
to distribute publicly paper and electronic copies of this thesis document
in whole or in part in any medium now known or hereafter created.
j
I
Signature of Author
Joint Program in Ocean6jjapiy afd Applied 0 a
cience and Engineering
Massachusetts Institute of Technology and Woods
eiQ-ceanographie4i
Certified by
ary 30,
,14
Dr. Simon R. Thorrold
Acc e by Thesis Supervisor
Accepted by
Chair, Joint Committee
Professor Martin F. Polz
for Biological Oceanography
AGE, MOVEMENTS, AND FEEDING ECOLOGY OF NORTHWEST ATLANTIC WHITE SHARKS ESTIMATED FROM
ECOGEOCHEMICAL PROFILES IN VERTEBRAE By
Li Ling Hamady
Submitted to the MIT-WHOI Joint Program in Oceanography/Applied Ocean Science and Engineering on January 30, 2014 in Partial Fulfillment of the Requirements for the
Degree of Doctor of Philosophy in Biological Oceanography
ABSTRACT
White sharks (Carcharodon carcharias) are highly migratory, ecologically important, vulnerable, and understudied marine predators. Ecogeochemistry, which takes advantage of natural variations in chemical signatures recorded in body tissues, can help determine lifetime movement, age, and ontogenetic diet history in difficult to study species. Shark vertebrae are constructed of distinct layers of tissue laid down sequentially over an individual's lifetime and may preserve a chemical record of environmental exposure. In this thesis, I investigate the ecology of the understudied northwest Atlantic (NWA) white shark population by applying several ecogeochemistry techniques to their vertebrae. I generate the first radiocarbon (A14C) age estimates for adult white sharks, dramatically extending the maximum age and longevity
compared to earlier age studies. A14C results also verify a lack of reworking of vertebral material and hint at possible sexual dimorphism in growth rates. Using amino acid and bulk stable isotope analyses, I show that individual sharks have marked variation in feeding and movement, and that pinnipeds do not constitute a large portion of their diet. Finally, I explore the utility of elemental
chemistry to retrospectively infer movement. This work provides an important informational baseline for future NWA white shark ecological studies and conservation and management
efforts.
Thesis Supervisor: Dr. Simon R. Thorrold
ACKNOWLEDGEMENTS
I received support from a National Science Foundation Graduate Research Fellowship and the WHOI Academic Programs Office. The research in this thesis was funded by a National Science Foundation Grant (OCE 0825148) to S. Thorrold. Additional support came from an ITCE (Inter-university Training for Continental-scale Ecology) Research in Residence Fellowship.
My advisor, Dr. Simon Thorrold, has been an absolutely amazing resource during my time as a graduate student and I cannot thank him enough. This work would not have been possible without his encouragement, support, guidance, and mentorship. I would like to thank my committee, Dr. Greg Skomal from MA Department of Marine Fisheries, Dr. Gareth Lawson from WHOI, Dr. Roger Summons from MIT, and my chair, Dr. Julie Kellner from WHOI, all of whom have been supportive and provided constructive critiques throughout the thesis process. Additionally, I would like to thank past and present Fish Ecology Lab members Leah Houghton, Dr. Kelton McMahon, Camrin Braun, Dr. Mike Polito, Dr. Joel Llopiz, and Dr. Michael
Berumen for help in lab and scientific conversations.
Other scientists to whom I owe a great debt of gratitude include Dr. Lisa Natanson at NMFS for teaching me about the age and growth of sharks and, most critically, for the use of all the vertebrae; Mary Lardie at NOSAMS for her unwavering optimism, lab expertise, and friendship; Dr. Ann McNichol at NOSAMS for her guidance; Prof. Brian Popp and his lab at University of Hawaii, Manoa for being such gracious hosts while I learned the 15N amino acid
technique; and Dr. Allen Andrews for many productive conversations and email exchanges regarding A"C.
I have had many amazing people in my life during my time as a student and I am
exceedingly grateful for the support I received and the love and memories that we shared. I could not have done this without my friends and family from both near and far. I especially want to
acknowledge my parents, Joel and Darlene Hamady, who have provided me with unwavering love and encouragement and who have been with me since the earliest stages of my love affair with the ocean. This thesis is dedicated to them.
TABLE OF CONTENTS
TH ESIS A BSTRA CT ... 3
A CK NO W LED G EM ENTS ... 5
TABLE O F CO N TENTS ... 7
CH APTER 1: INTRO DUCTIO N ... 13
1.1 M igratory sharks ... 13
1.2 Traditional shark ecology techniques ... 13
1.2.1 Age... 13
1.2.2 M ovem ents... 14
1.2.3 Feeding... 15
1.3 Com plem entary ecogeochem istry techniques... 16
1.3.1 Bom b radiocarbon for age ... 16
1.3.2 Stable isotopes for m ovem ent and feeding... 17
1.3.3 Elem ental chem istry for m ovem ents ... 18
1.4 Study species... 18
1.5 Thesis objectives... 20
CHAPTER 2: VERTEBRAL BOMB RADIOCARBON SUGGESTS EXTREME LO NG EVITY IN W H ITE SH ARK S ... 21
2.1 Abstract ... 22
2.2 Introduction... 22
2.3 M ethods... 24
2.4 Results... 26
2.5 Discussion... 27
2 .7 T ab les ... 3 3
2.7.1 Collection and sampling information for individual sharks... 33
2 .8 F igu res... 3 4 2.8.1 Photomicrographs of sectioned vertebrae ... 34
2.8.2 White shark A 14C results compared to three A14 C reference chronologies ... . 35
2.8.3 613C values for individual sharks ... 36
2.8.4 Bivariate plot of 61 3C versus A14C for individual sharks ... 37
2.9 Supporting information... 38
2.9.1 Linear trends fit to the A14C rise portion of the reference chronologies ... . 38
2.9.2 Phase lagged A14C shark values ... 39
2.9.3 Calculating the summed squared differences for optimal chronology shifting... 40
2.9.4 A14C and 613C (%o) shark sample data listed by individual... 42
CHAPTER 3: RETROSPECTIVELY INVESTIGATING WHITE SHARK ECOLOGY VIA BULK AND AMINO ACID STABLE ISOTOPE ANALYSIS .... 45
3.1 Introduction ... 4 5 3 .2 M ethod s... . 4 8 3.2.1 Tissue sam pling ... 48
3.2.2 B ulk SIA ... 4 8 3.2.3 Amino Acid 15N SIA ... 48
3.2.4 D ata A nalysis ... 49
3.2.4.1 B ulk SIA data ... 49
3 .3 R e su lts... ... 5 2
3 .4 D iscu ssion ... 5 5
3.4.1 Isotopic trends and niches ... 55
3.4.2 In context: the food web and other white shark studies ... 57
3.5 C onclu sions... 59
3 .6 T ab les ... 6 0 3.6.1 Collection and sampling information for individual sharks... 60
3.6.2 The known extent of the diet of NWA white sharks from stomach content analyses and observations... 61
3.6.3 Stable isotope values for foodweb items from the NWA... 62
3.6.4 Calculating correction factors for shark tissue ... 68
3.6.5 White shark bulk isotopic niche space as measured by Bayesian ellip ses ... . . 69
3.6.6 White shark CSI niche space as measured by Bayesian ellipses ... 70
3 .7 F ig u res... 7 1 3.7.1 Uncorrected bivariate plot of 13C and 15N values from white shark tissue sam ples ... 71
3.7.2 Corrected bivariate plot of 13C and 15N values from white shark tissue sam ples ... 72
3.7.3 Bulk values from white shark tissues plotted by age ... 73
3.7.4 Bulk values from white shark tissues plotted by year ... 74
3.7.5 Lifetime niche width of individuals based on bulk values... 75
3.7.6 Northwest Atlantic foodweb ... 76
3.7.7 Bivariate plot of average bulk 813C and 15N values from white shark tissue samples from around the world ... 77
3.7.8 W hite shark trophic position ... 78
3.7.9 Averages of 8'5N in source am ino acids ... 79
3.7.10 Lifetime isotopic niches of individuals based on CSIA ... 80
CHAPTER 4: INFERRING MOVEMENTS OF WHITE SHARKS BASED ON VERTEBRAL ELEMENTAL CHEMISTRY ... 81
4.1 Introduction... 81
4.2 M ethods... 83
4.2.1 Vertebral sampling and preparation ... 83
4.2.2 Elem ental data collection ... 83
4.2.3 Data analysis... 84
4 .3 R esu lts ... 8 5 4.4 Discussion... 86
4 .5 T ab les ... 9 0 4.5.1 Collection and sampling inform ation... 90
4.5.2 Elem ental correlations... 91
4 .6 F ig u res... 9 2 4.6.1 Example of parallel transects of elem ental ratios... 92
4.6.2 Female pre-parturition white shark elemental transects... 93
4.6.3 Male pre-parturition white shark elemental transects ... 97
4.6.4 Fem ale lifetim e white shark elem ental transects... 101
4.6.5 M ale lifetim e white shark elem ental transects ... 105
CHAPTER 5: CONCLUSIONS ... 109
5.1 Thesis summ ary ... 109
REFEREN CES ... 113 APPENDIX 1: A REVIEW OF ECOGEOCHEMISTRY APPROACHES TO
ESTIMATING MOVEMENTS OF MARINE ANIMALS... 129 APPENDIX 2: OCEAN ECOGEOCHEMISTRY: A REVIEW... 149 APPENDIX 3: VALIDATED AGE AND GROWTH ESTIMATES FOR
CARCHARHINUS OBSCURUS IN THE NWA OCEAN, WITH PRE- AND POST
CHAPTER ONE
Introduction
1.1 Migratory sharks
Migratory sharks are some of the largest, most iconic, but paradoxically least understood of marine organisms. In recent decades, shark populations have experienced sharp declines due to overfishing (Baum 2003, Baum & Myers 2004, Ferretti et al. 2008), which has, in some cases, caused unexpected consequences for the broader ecosystem (Myers et al. 2007). Many of these apex predators are vulnerable to even light fishing pressure (Dulvy et al. 2008, Ferretti et al. 2010) due to life history traits that typically include low fecundities and high age at first maturity (Smith et al. 1998, Rogers et al. 2013). Moreover, migratory sharks often pass through the jurisdictional zones of multiple countries, and are thus exposed to different levels of direct and indirect impacts of fishing. In international waters, outside the 200 nautical mile exclusive economic zone (EEZ) around countries, large international fleets are free to exploit many stocks without limit or regard to the management strategies undertaken inside nearby EEZs (Maguire et al. 2006). Unregulated fishing activity in international waters is problematic for conservation efforts because management in one area can be undermined by overexploitation in other
locations.
1.2 Traditional shark ecology techniques
In order to develop feasible conservation plans for highly migratory species, it is first necessary to know when, where, and why individuals of a particular species move (Rubenstein &
Hobson 2004). Yet, for many sharks, even basic ecological information such as age, nursery grounds, and mating sites remains unknown. The following are several categories of fundamental importance to understanding shark ecology, the most commonly employed techniques used to study them, and some of the challenges with those techniques:
1.2.1 Age
Accurate aging of fish is fundamental to population assessment and management as it allows for the calculation of important demographic information such as longevity, growth rate, and age at sexual maturity. Knowledge of this demographic information is critical from a
fisheries management perspective for general monitoring, as well as to develop plans for population recovery in the case of overfished species.
The primary method of aging fish relies on counting growth patterns in internally generated, accretionary material. In bony fish, otoliths, dorsal spines, vertebrae, and scales all show distinct rings which mark annual growth increments, similar to tree rings. These patterns, reflecting seasonal growth, have been observed for several centuries; Leeuwenhoek observed annual banding in fish scales in 1685, followed by Hederstr6m in 1759 with fish vertebrae, and Reibisch in 1899 with otoliths (Jackson 2007). Elasmobranches lack many of the calcified parts that allow for aging in bony fish; instead, aging in sharks has been typically conducted by counting band pairs in vertebrae. Shark vertebrae are constructed of distinct layers of tissue, laid down sequentially over an individual's lifetime in an alternating light/dark banding pattern. One translucent and opaque pair makes up a band pair and is generally assumed to represent one year of growth (Goldman et al. 2012).
Counting and interpreting growth patterns in any accretionary material can be difficult. Age validation, whereby the observed banding pattern is confirmed by an outside method, is often necessary. In sharks, the boundaries between band pairs can blur, especially as sharks age, leading to possible underestimation of age. Additionally, while it has been assumed that most sharks show annual vertebral banding, Pacific angel sharks lay down band pairs based on the need for body structural support as girth increases (Natanson & Cailliet 1990). Some sharks slow down their growth length-wise and substantially increase their girth as they get older and band counts can change from vertebra to vertebra along a vertebral column, with the highest counts corresponding to areas of widest body girth (L. Natanson, pers. comm). These observations call into question the validity of assuming annual banding in shark vertebrae and emphasize the need for age validation, which has yet to be done for most shark species.
1.2.2 Movements
Animal migrations are some of the most fascinating and impressive phenomena on the planet. While these movements are indeed often spectacular, migration patterns also have
important demographic, ecological, and evolutionary implications for population and community structure in ocean ecosystems. For instance, movement rates determine colonization rates of new habitats, the resiliency of populations to natural and anthropogenic disturbances, and the likely effectiveness of marine protected areas and other spatial strategies for managing fisheries and
preserving biodiversity. In contrast, a lack of gene flow among geographically separated sub-populations may allow for adaptation to local environmental conditions over evolutionary time
scales.
Most studies of movement in marine organisms have been conducted using a variety of extrinsic tagging methods. Sharks are considerably more challenging to find and track than air-breathing marine species such as mammals and sea turtles because they may spend their entire lives without breaking the surface. A variety of tagging techniques including conventional, electronic transmitting, and electronic datalogging tags, have revealed ocean basin scale
migrations (e.g. Kohler & Turner 2001, Weng et al. 2005, Bonfil 2005, Skomal et al. 2009) as
well as finer scale movements (e.g. Nelson et al. 1997, Weng et al. 2007a, Heupel et al. 2009) in numerous shark species. However, tagging has its limitations as some ontogentic stages are either unavailable or not amenable to tagging. Many electronic tags are routinely deployed for no more than 12 months and therefore provide only a small snapshot of lifetime movement of adult
sharks that may live over 50 years. It has, therefore, proved very difficult to generate lifetime movement patterns of any shark species using tagging alone. This, in turn, makes it difficult to identify key habitats for conservation and protection of vulnerable shark populations.
1.2.3 Feeding
Typical investigations of diet and feeding rely on stomach content analysis (SCA), and opportunistic viewing of feeding events. SCA involves dissection of caught or stranded fish and
identification and enumeration of the stomach contents and only captures the most recent meals of an individual. For migratory sharks that range into the open ocean for extensive time periods away from places where fishermen might catch them, this method biases their SCA data towards nearshore feeding events. Individuals are likely to feed on different prey items when migrating through oceanic waters compared to when they are close to shore. SCA can overestimate the
contribution of organisms with hard parts that persist in the digestive tract (e.g. squid beaks, fish otoliths) over other more easily digestible food (Bowen and Iverson 2012), cause bias via the prevalence of unrecognized dietary items (Pinnegar et al. 2001) and regurgitation during capture
(Renones et al. 2002). Additionally, SCA provides only a point sample in the lifetime of an organism and is impractical when species of interest are rare (Cortes 1997). Opportunistic viewing may similarly bias dietary analysis by overestimating the importance of nearshore,
1.3 Complementary ecogeochemistry techniques
Ecogeochemistry is the use of natural geochemical markers to reconstruct the ecological life history of animals. The method relies upon isotopic or trace element abundance differences across space or time that are recorded in the chemical composition of body tissues. The approach overcomes several significant difficulties with more traditional techniques. Geochemical markers are induced by the environment, rather than administered by the researcher, and therefore all animals within a specified location or time period are labeled without having to be captured and tagged. Similarly, because every individual is marked there is no need to "recapture" tagged animals. These approaches are therefore ideal for rare species that may be unavailable to researchers for some period of their life. The following are several ecogeochemical approaches that complement traditional shark ecology investigations:
1.3.1 Bomb radiocarbon for age
One method of age validation takes advantage of the large atmospheric I4C spike that happened in the late 1950's and early 1960's due to atmospheric testing of thermonuclear weapons. The radiocarbon mixed into the ocean and became incorporated into the tissues of marine creatures through foodweb transmission. Tissues deposited before, during, and after the bomb testing initially incorporated the low natural levels of radiocarbon, followed by the peak and subsequent slow "decay" that continues to the present day as the enriched surface waters are diluted due to mixing. Metabolically inert accretionary tissues record the full magnitude of the bomb radiocarbon spike pattern. When collection date is known, it is possible to age the organism and determine the periodicity of band deposition in the tissue by matching the 14C measurements from each band to a reference chronology (Kalish 1993). It is important to use a reference chronology for the specific habitat of interest, as radiocarbon is mixed into the various ocean basins differently, and 14C values in deep water and shallow water differ as the signal in
the deep sea is delayed (Appendix 2: McMahon et al. 2013). The method is generally considered to be the best age validation approach for long-lived fish (Campana 2001).
The radiocarbon validation technique has been used successfully on otoliths of a variety of fish species (e.g. Kalish 1993, Campana 1997, Andrews et al. 2013) and its application to elasmobranch vertebrae has raised some interesting questions. Annual deposition of band pairs has been confirmed in a handful of species (e.g. Campana et al. 2002, Ardizzone et al. 2006, Kneebone et al. 2008, Passerotti et al. 2010), but there is growing evidence for age
underestimation via band counts for older sharks in several species (e.g. Francis et al. 2007, Andrews et al. 2011, Appendix 3: Natanson et al. 2013), making it critical to validate all species of concern. In addition to their usefulness as age indicators, vertebrae record the chemical signature of a shark's environment throughout its lifetime, similar to bony fish otoliths. Otoliths are archival tissues, and by analyzing stable isotopes or trace elements in otolith increments, researchers have been able to determine natal origins and population connectivity for a variety of bony fish (e.g. Thorrold et al. 2001, Rooker et al. 2008). Unlike otoliths, shark vertebrae are not acellular and material deposited at one time may be metabolized and replaced during a shark's lifetime. It is therefore necessary to determine the metabolic stability of shark vertebrae before analyzing individual growth increments, which is also possible through bomb radiocarbon analysis.
1.3.2 Stable isotopes for movement and feeding
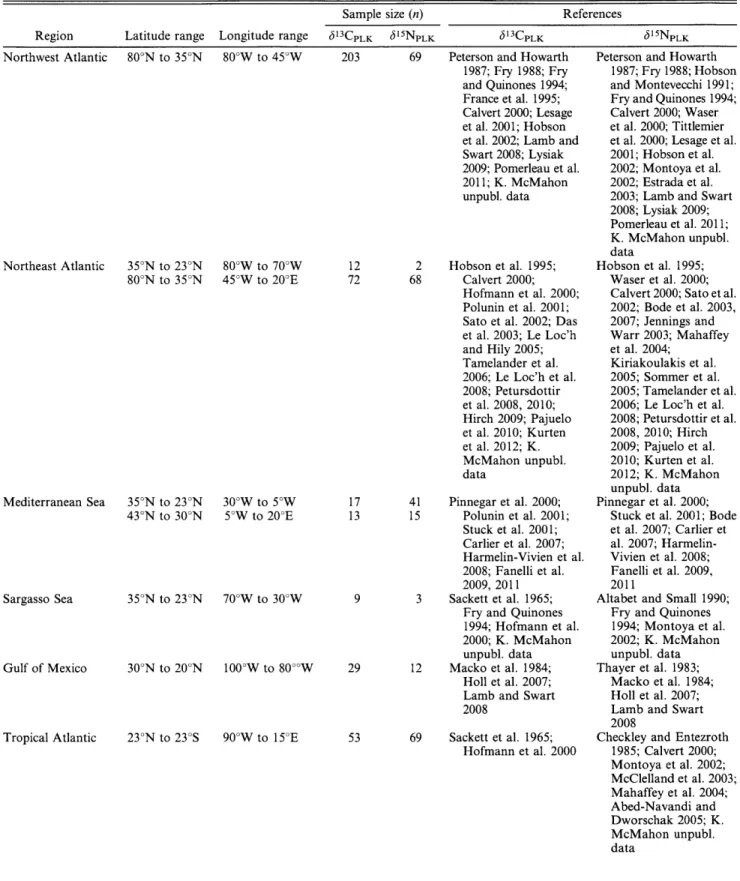
In aquatic systems, habitat-specific differences create variability in baseline isotopic values, which then affect resultant values in the food web (Vander Zanden & Rasmussen 1999). As migratory organisms feed and move through specific areas, their tissues record the isotope values of that location. When overlain on a map, the different baseline isotope values in different
areas form an isotope landscape, or isoscape. Using isoscapes and analyzing two or more isotopes in concert (such as 613C and 615N) allows for a rough triangulation of the position at which the particular tissue was laid down. For food web studies, isotope analysis has the
advantage of representing actually assimilated, not just ingested, prey; potentially covers the entire lifespan of an individual, depending on the tissue analyzed; and has been used on a variety of fish with success, including top predators like tuna (Estrada et al. 2005). Consumers generally
show 0-1%o bulk 13C (Michener and Schell 1994, DeNiro 1978) and -3.4%o bulk 15 N
fractionation per trophic level above the baseline value (DeNiro & Epstein 1981, Minigawa & Wada 1984). Bulk Y3C values have been used to approximate geographical position, such as near shore versus open-ocean (Hobson 1999), as differences in 13C value tend to indicate movement between different habitats (Cherel et al. 2007). Alternatively, 1 5N values have
primarily been used to indicate trophic level, as eating higher up in the foodweb leads to readily measurable fractionation (DeNiro & Epstein 1981). However, it can be difficult to interpret conventional bulk stable isotope data from highly migratory species that move through isotopically distinct food webs and shift diets seasonally and ontogenetically.
Recent advances in compound-specific stable isotope analysis (e.g. individual amino acids [AAs]) have significantly reduced the influence of potentially confounding variables (shifting trophic position and different isotopic baselines) when investigating movement and diet of highly migratory species. Briefly, "trophic" amino acids undergo metabolic transamination processes that cause significant enrichment in 15N between trophic levels, while "source" amino
acids retain the isotopic value of the base of the food web (McClelland and Montoya 2002, Chikaraishi et al. 2007). Recently, compound specific stable 815N has been used to examine the ecology of a variety of organisms (e.g. Hannides et al. 2009, Lorrain et al. 2009, Olson et al. 2010, Miller et al. 2012), including one elasmobranch (Dale et al. 2011), though studies have yet to look at lifetime records of movement and feeding.
1.3.3 Elemental chemistry for movements
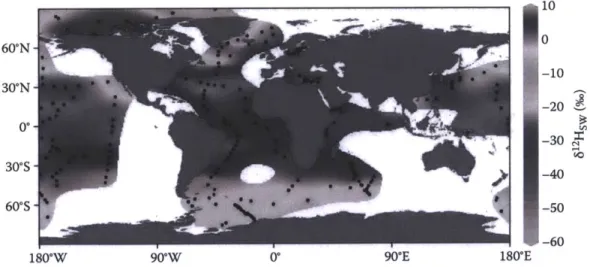
Similar to stable isotopes, trace elements in the ocean can vary based on a variety of biotic and abiotic factors (McMahon et al. 2013). These elements can substitute for calcium in the matrix of actively accreting calcifying structures, creating an elemental fingerprint of an area.
In marine systems, much of the work using trace elements markers as natural tags has been conducted on bony fish otoliths (Elsdon et al. 2008), though the technique holds promise for elasmobranchs (Smith 2013).
1.4 Study Species
White sharks (Carcharodon carcharias) are iconic, apex predators found in temperate and sub-tropical waters around the world, and seasonally in the waters off Cape Cod,
Massachusetts. They are listed as "vulnerable" worldwide by the International Union for the Conservation of Nature (IUCN 2013) Red List of Threatened Species and are protected via international trade agreements including the Convention on International Trade in Endangered
Species (CITES 2004) and the Convention on Migratory Species (CMS 2007). Despite
protection in some locations, by-catch in long line and gillnet fisheries remains a significant threat, and direct fishing pressure includes sport fishing, shark finning, drum lines and nets for beach safety, and directed eradication (Compagno 2001).
Knowledge of white shark life history is surprisingly limited considering they are the third largest fish in the world's oceans. In the Pacific, population assessment based on dorsal fin photo identification estimated about 219 individuals in the population; much lower that
declined by almost 80% in the last 20 years (Baum et al. 2003). They are ovoviviparous, with gestation periods estimated at more than a year (Francis 1996) and pregnant white sharks and young juveniles are rarely seen, implying both rarity and spatial segregation. White sharks are also slow to grow and mature and have low fecundity, making them particularly vulnerable to fishing (Smith et al. 1998). Age validation studies have been attempted in South Africa (Wintner and Cliff 1999) and California (Kerr et al. 2006) but both studies proved inconclusive.
Though apex predators, white sharks are also highly opportunistic, eating everything from carrion to crabs, as well as fish, other elasmobranchs, and marine mammals (Compagno 2001). In areas with high marine mammal populations, like the Farallon Islands in California or Seal Island in South Africa, white sharks undergo an ontogenetic diet switch from feeding primarily on fish when less than 2m in length, to feeding primarily on marine mammals such as seals when larger than 3m (Tricas & McCosker 1984, Compagno 2001). However, this
ontogenetic diet switch is not necessarily characteristic of all white shark populations, and is more likely a function of prey availability and an expanding predatory repertoire with size
(Compagno 2001, Hammerschlag et al. 2012, Kim et al. 2012).
Along the US eastern seaboard prior to the 17th century, gray seals were common and
were likely an important diet of resident white sharks. However, human exploitation decimated populations via subsistence and bounty hunting (Wood Lafond 2009) until the passage of the Marine Mammal Protection Act (MMPA) in 1972 that has since seen gray seal populations rebound (Waring et al. 2011). For several centuries when gray seal populations were low, most
large white sharks in the NWA likely fed at a significantly lower trophic position (TP), eating fish and scavenging cetacean carcasses (Skomal et al. 2012). Circumstantial evidence points to a possible recent diet switch in NWA white sharks, as sightings of sharks and reports of attacks on
seals have increased dramatically in the last decade (Skomal et al. 2012). This type of dietary change has been reported in other locations following a pinniped population rebound (Pyle et al. 1996), but has yet to be demonstrated in NWA white sharks.
The white shark occupies one of the most varied habitat and temperature ranges of any fish, from sub-polar to temperate to tropical seas, and near-shore to open ocean environments worldwide (Compagno 2001). Tagging data from around the world indicates that white sharks undergo complex migrations and movements throughout their lifetime. In the Pacific, juveniles tend to stay in warmer, shallower areas, often distinct from adult habitat (Weng et al. 2007a).
Meanwhile, adults tend to make deeper dives, and may exhibit long distance, cross-ocean basin migrations (Bonfil et al. 2005), but often predictably return to preferred coastal foraging areas via established migratory routes (Weng et al. 2007b, Jorgensen et al. 2010). Data on movements of northwest Atlantic white sharks from archival tags is just beginning to emerge from a study led by Dr. G. Skomal, but unpublished results suggest a diversity of movement patterns. Important life history events of white sharks occur seasonally, geographically, and
ontogenetically, making it challenging to characterize movement and trophic ecology critical for designing effective conservation policies.
1.5 Thesis objectives
The goal of this thesis was to retrospectively investigate the lifetime ecology of white sharks from the northwest Atlantic Ocean using a variety of ecogeochemistry approaches on their vertebrae. Chapter 2 used bomb radiocarbon validation to generate the first ever validated ages for white sharks. Individuals were much older than age estimates from previous studies and band pair counts dramatically underestimated the age of the largest sharks. Validated ages from this study were used in subsequent chapters to put the ecological data into a time and age
framework. Chapter 3 examined trophic ecology and migrations using bulk stable 613C and 615N and amino acid 615N from vertebrae and muscle samples. Finally, Chapter 4 used trace element analysis to investigate white shark movements. Altogether, this thesis presents a glimpse into the lifetime ecology of the understudied northwest Atlantic white shark, and will provide a baseline of observations for ongoing conservation efforts for the species.
CHAPTER TWO
Vertebral Bomb Radiocarbon Suggests Extreme Longevity in White Sharks
Li Ling Hamady
Massachusetts Institute of Technology/Woods Hole Oceanographic Institution Joint Program in Oceanography/Applied Ocean Science and Engineering, Woods Hole, MA, USA
Lisa J. Natanson
Apex Predators Program, National Marine Fisheries Service, National Oceanic and Atmospheric Administration, Narragansett, RI, USA
Gregory B. Skomal
Massachusetts Division of Marine Fisheries, New Bedford, MA, USA Simon R. Thorrold
Biology Department, Woods Hole Oceanographic Institution, Woods Hole, MA, USA
This chapter consists of text and figures (modified to MIT/WHOI thesis standards) from an open-access article, free of all copyright, which may be freely reproduced, distributed,
transmitted, modified, built upon, or otherwise used by anyone for any lawful purpose. The work is made available under the Creative Commons CCO public domain dedication.
Hamady LL, Natanson LJ, Skomal GB, Thorrold SR (2014) Vertebral Bomb Radiocarbon Suggests Extreme Longevity in White Sharks. PLoS ONE 9(1): e84006.
2.1 Abstract
Conservation and management efforts for white sharks (Carcharodon carcharias) remain hampered by a lack of basic demographic information including age and growth rates. Sharks are typically aged by counting growth bands sequentially deposited in their vertebrae, but the
assumption of annual deposition of these band pairs requires testing. We compared radiocarbon (A"C) values in vertebrae from four female and four male white sharks from the northwestern Atlantic Ocean (NWA) with reference chronologies documenting the marine uptake of 1 4
C
produced by atmospheric testing of thermonuclear devices to generate the first radiocarbon age estimates for adult white sharks. Age estimates were up to 40 years old for the largest female (fork length [FL]: 526cm) and 73 years old for the largest male (FL: 493cm). Our results
dramatically extend the maximum age and longevity of white sharks compared to earlier studies, hint at possible sexual dimorphism in growth rates, and raise concerns that white shark
populations are considerably more sensitive to human-induced mortality than previously thought. 2.2 Introduction
White sharks (Carcharodon carcharias) are wide ranging apex predators in coastal and offshore waters throughout the world's oceans. They are considered "vulnerable" worldwide by the International Union for the Conservation of Nature (IUCN 2013) Red List of Threatened Species and are protected via international trade agreements including the Convention on International Trade in Endangered Species (CITES 2004) and the Convention on Migratory Species (CMS 2007). Despite this attention, remarkably little demographic information is available for white shark populations. Age estimation is particularly important to the development of conservation and sustainable management strategies as most demographic variables required for adequate population assessments, such as longevity, growth rate, and age at sexual maturity, include an age component. The primary method of age estimation in fishes relies on counting growth increments in mineralized tissues, including otoliths, vertebrae, and fin rays (Campana 2001, Goldman et al. 2012). However, accurate interpretation of growth
increments in these tissues is often difficult and, in the case of a species subjected to fisheries exploitation, misinterpretation may inadvertently lead to mismanagement (Fenton et al. 1991, Andrews et al. 2009). It is, therefore, necessary to validate age and growth estimates that are based on increment counts.
The use of bomb radiocarbon to test the periodicity of increment formation and age is now well established and its use on sharks has increased considerably in recent years (Campana 2001, Goldman et al. 2012). The approach takes advantage of the pulse of radiocarbon above natural levels that was produced as a result of atmospheric testing of thermonuclear devices during the 1950s and '60s. This increase in atmospheric radiocarbon, measured as A'4C (Stuiver and Polach 1977), mixed relatively quickly into the ocean and became incorporated in the tissues of marine organisms through uptake of dissolved inorganic carbon and subsequent dietary transmission through ocean foodwebs. The rapid rise in radiocarbon in the ocean can be used as a time stamp to determine the age of an organism that deposited layers in accretionary structures during this specific time period, and is generally considered the most diagnostic portion for A14 C-based age determination (Campana 2001, though see Andrews et al. 2013). Estimated ages C-based on band pair counts can then be independently confirmed by comparing A4C values from specific increments in the structure to a A14C reference chronology of known age material, typically from the same or nearby geographic area. First applied to bony fishes by comparing otolith A14
C to a coral reference chronology (Kalish 1993), its use has since been extended to elasmobranch vertebrae (Campana et al. 2002, Ardizzone et al. 2006, Francis et al. 2007, Kneebone et al. 2008, Passerotti et al. 2010, Andrews et al. 2011, Appendix 3: Natanson et al.
2013).
Several studies have used vertebral band pairs to describe the age and growth of white sharks. Assuming annual deposition of growth bands, the oldest individuals identified to date from the northeastern Pacific (Cailliet et al. 1985, Kerr et al. 2006), western Indian (Wintner and Cliff 1999), and northwestern Pacific (Tanaka et al. 2011) oceans, were 18 (4.61 m total length, TL), 13 (3.73 m pre-caudal length, PCL), and 12 years (4.42 m TL), respectively. Two other papers described counts of 22 and 23 band pairs from the vertebrae of two large females, both over 5 m in total length, from the southwestern Pacific Ocean (Francis 1996) and western Indian Ocean (Mollet et al. 1996), respectively. None of the studies were, however, able to document annual periodicity of the band pairs used to assign age. Two of the studies (Wintner and Cliff
1999, Kerr et al. 2006) attempted to confirm annual periodicity of growth bands in white shark vertebrae, but results were inconclusive.
Our goal in the present study was to determine periodicity of band pair deposition in the vertebrae of white sharks from the northwest Atlantic Ocean (NWA) using the bomb radiocarbon
signal. Once validated, band pair counts provide a method for providing minimum estimates of longevity in white shark populations.
2.3 Methods
Vertebrae were sampled from four female and four male white sharks caught in the NWA from 1967 to 2010 and archived at the National Marine Fisheries Service in Narragansett, RI. Vertebrae were loaned with permission to sample. With the exception of one individual (WS8 1), all vertebrae were taken from the abdominal section of the vertebral column. Abdominal
vertebrae were unavailable from WS81 necessitating the use of a tail vertebra. The vertebrae were sectioned using a Ray Tech Gem Saw to approximately 0.6 mm in thickness. Larger vertebrae were sectioned through the corpus calcareum with a diamond blade using a Diamond Pacific Model TC-6 trim saw. Each section was digitally photographed with an MTI CCD 72 video camera attached to a SZX9 Olympus stereomicroscope using reflected light. Reference to trade names does not imply endorsement by NMFS. Two experienced readers (LJN and GBS) independently counted the growth bands. An opaque band through the intermedialia that
continued to the corpus calcareum as a translucent band constituted a growth band. Definition of a band pair was similar to those used in earlier studies that confirmed the annual periodicity of band pairs in the porbeagle, Lamna nasus, and the shortfin mako, Isurus oxyrinchus (Campana et al. 2002, Natanson et al. 2002) which are closely related phylogenetically to the white shark.
The white shark vertebrae were characterized by narrow banding patterns that made it problematic to extract enough material from individual band pairs for A C analysis. Therefore, sections were measured down the middle of the intermedialia from the central focus to the outer margin. Samples were cut along measured increments using a razor blade (n = 3 to 23 per vertebra) and were aligned with their respective band pairs using annotated photographs of each section. Band pair deposition was initially assumed to be annual in periodicity and ages were assigned to sample sections based on back calculation from collection date. For WS105, the year of collection (1986) sample was thinly shaved from the outer vertebral surface, representing the material most recently deposited prior to the individual's death.
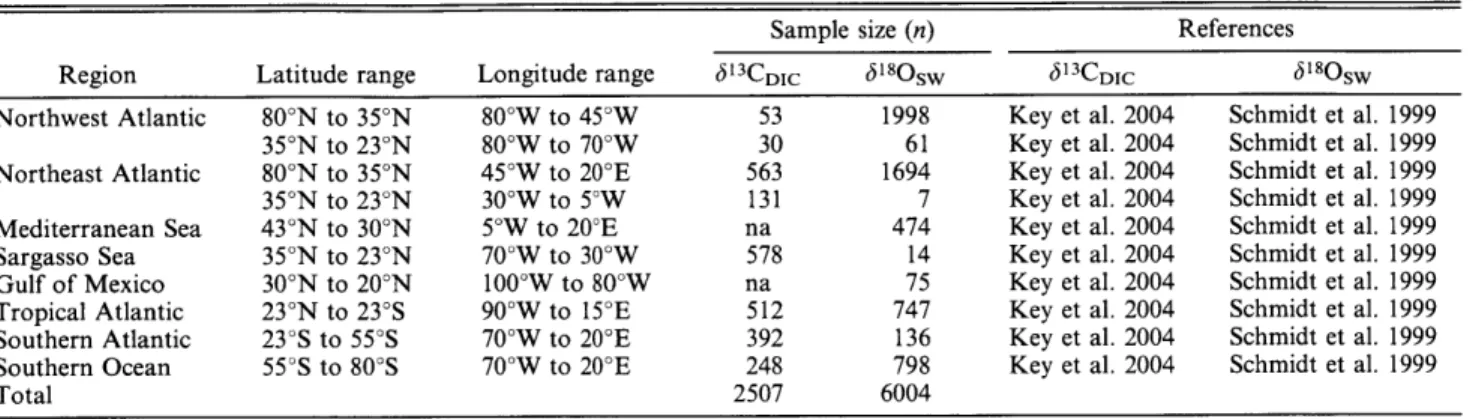
Radiocarbon analyses (n = 82) were conducted on collagen in the white shark vertebrae. Carbon isotope values in collagen reflect those of protein whereas the calcified inorganic component of vertebrae (hydroxyapatite) is composed of dietary carbon and dissolved inorganic carbon (DIC) (Ambrose and Norr 1993, Tieszen and Fagre 1993). Dietary and DIC pools have
distinctive isotope values in ocean environments (Newsome et al. 2010, Appendix 1: McMahon et al. 2013a), which can cause problems when conducting bulk isotope analyses of vertebral material. Varying degrees of mineralization along a vertebra may lead to unequal carbon
contributions from organic and inorganic pools to different material sampled longitudinally from a vertebra. Finally, A14C values in de-mineralized samples from white shark vertebrae have been shown to be lower than paired bulk samples (Kerr et al. 2006), presumably due to the presence of carbon sourced from DIC in the bulk samples. Taken together, these observations provide a strong argument for performing collagen extraction before A14C analysis of vertebral samples.
Collagen extraction from vertebral samples was conducted following Tuross et al. (1988). Each sample consisted initially of approximately 0.5 g of tissue. Treatment was a series of steps: 1) overnight soak in a 3:1 chloroform methanol solution to remove lipids; 2) demineralization at room temperature with EDTA (pH 8) for 7-20 days until soft; 3) rinsing 10 times with Milli-Q water and at least one overnight soak; 4) dissolution in Milli-Q water at 1 10 C; and 5) filtration through muffled fritted glass filters. The filtrate from this process was frozen and lypholized. The purified collagen samples were then submitted as 'ready to burn' for 8' 3C and A!4C analyses at the National Ocean Sciences Accelerator Mass Spectrometry Facility (NOSAMS) at the Woods Hole Oceanographic Institution (WHOI).
White sharks are highly migratory (Bonfil et al. 2005, Weng et al. 2007) with variable feeding habits (Compagno 2001, Kim et al. 2012). As a result, three reference chronologies from the NWA were considered to represent the ocean A14C rise profile for the region. A coral
carbonate chronology from Florida (Druffel and Linick 1978) showed a more immediate uptake of bomb radiocarbon compared to the NWA otolith curve (Campana et al. 2008). The reference record from validated porbeagle shark data provided a reference for a potential phase lag between ocean radiocarbon curves and vertebral profiles (Campana et al. 2002). Radiocarbon values from white shark samples were plotted against the reference chronologies under the assumption of annual band pair deposition.
Where the A!4C rise portion of the vertebral data was displaced to either the right or the left of the reference curves, we shifted the points to bring the entire white shark chronology into alignment. To optimize the alignment, we first fit a linear trend line to the A4C rise portion of the appropriate reference curve (Florida coral for WS 134, and NWA otolith for WS81 and WS105) (Figure 2.9.1). Using the resulting equation, we entered each
A
14C data point from thevertebral A14
C rise section and located the year corresponding to that point on the reference chronology (Table 2.9.2). We found the optimal alignment for each AS4
C data point by summing the squared differences between the reference A14
C value for each year and the measured vertebral A14C from that same year. This calculation was repeated after moving the vertebral years step-wise one year closer each time to the reference years. We identified the optimal shift for each white shark chronology by minimizing the summed squared differences for all the points (Table 2.9.3). See supporting information for data and calculations.
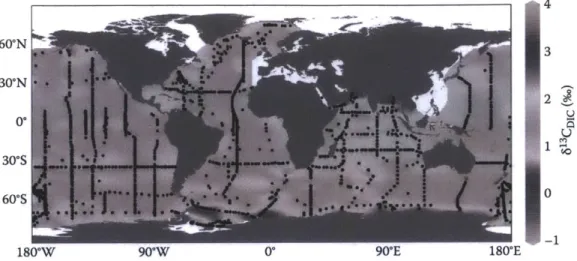
Finally, 3C values were also assayed in the collagen samples during the radiocarbon analysis. While 6"C values in the ocean did not increase along with radiocarbon values, carbon isoscapes do vary as a function of latitude and distance from the coast and can be a useful tracer of large scale movement patterns (Appendices 1 and 2: McMahon et al. 2013a,b). We therefore plotted 8'3C values by radiocarbon adjusted age and radiocarbon value.
2.4 Results
Band pair counts in vertebral thin sections provided age estimates of 6-35 years for female white sharks and 9-52 years for male white sharks (Figure 2.8.1, Table 2.7.1). Radiocarbon values in vertebral samples from before the bomb A14
C rise were generally
consistent with regional A14C reference chronologies (mean=-62.5 ±8.44%o (SD)) (Figure 2.8.2A, B, D). Post-peak radiocarbon values ranged from below the NWA otolith curve to nearly the same amplitude as the coral reference curve from Florida. Female white sharks displayed a broader range in both the absolute magnitude of the A14C rise and in A14
C post-peak trajectories compared to males (Figure 2.8.2A, B, C, D).
We found good agreement between the reference curves and band pair counts in three sharks (WS57, WS100, WS28) with nominal ages of 44, 9, and 6 years, respectively. The two youngest white sharks (WS 100 and WS28) aligned closely with the coral curve. An older shark (WS57) also aligned with the coral curve up to almost 30 years of age, with a good
representation of pre- A14
C rise levels, after which it matched well with the porbeagle reference curve, indicating that vertebral band pairs were indeed deposited on an annual basis (Figure 2.8.2A, C). Two other individuals (WS143, WS 117) recorded radiocarbon values solely from the enriched post-A14
C rise period with values bracketed by the A14
C reference chronologies (Figure 2.8.2A, C). The original A14C time series of one female (WS 134) was plotted with a birth year three years prior to the most rapid increase in A14C documented, indicating a slight
over-estimation of age by the band pair counting, based on the assumption that the coral record provided the best age calibration for this individual (Figure 2.8.2D). This assumption was likely appropriate given the similarity of the vertebral A'4C values to the coral chronology, both of which were considerably higher than the other two reference chronologies. In the remaining two
sharks - the largest female and male that we examined (WS81, WS105) - the original age estimates led to an offset A14C chronology for each of these individuals relative to the reference
A4
C data. Based on the limits provided by the NWA otolith A14C reference chronology, each was adjusted (by 7 and 21 years respectively) to a greater age than could be accounted for with the band pair counting. (Figure 2.8.2B, D). We kept the terminal data point of WS105 at the year of collection (1986) because it reflected the most recently deposited material in the vertebra. Moving the vertebral values back to the reference curves led to an increase of estimated age to 40 and 73 years for the female and male, respectively (Figure 2.8.2B, D).
Examining 13
C values as a function of estimated age, all pre-birth 813C values, except for WS28, were clustered with a difference of -0.8%c. However, post-birth, V'3C values diverged with a tendency towards decline with age but no obvious trend (R=0.33) (Figure 3).
Interestingly, 813C values were positively correlated with A4C values after (R=0.80) but not before (R=0.42) the bomb radiocarbon rise (Figure 2.8.4). The maximum difference in o13C values across a single vertebra ranged from 0.33 to 1.84%o (Table 2.9.4). Individual white shark A4C and 813C (%o) sample values and deposition years are available online (Table 2.9.4). 2.5 Discussion
A!4
C profiles in vertebrae provided compelling evidence that white sharks are likely to live up to approximately 70 years in the NWA and may live longer. These data stand in contrast to earlier studies in the Pacific and Indian Oceans which suggested that the individual white sharks examined were no older than 23 years (Cailliet et al. 1985, Francis 1996, Mollet et al. 1996, Wintner and Cliff 1999) with concomitantly faster growth rates. Therefore, either white sharks are living significantly longer and growing slower in the NWA than either the Pacific or Indian Oceans or longevity has been underestimated in previous studies.
The only other study to attempt age validation in white shark vertebrae using A4C was conducted on samples from the northeastern Pacific Ocean (Kerr et al. 2006). Results from this earlier study were generally inconclusive for several reasons. The authors used known-age (1 year-old) samples to construct a species-specific A'4C reference that they suggested showed a
significant time lag with an otolith reference time series from the Pacific Ocean. However, this interpretation is questionable because no samples were analyzed from the time period between 1959 and 1977 when the A14C rise occured in the otolith reference chronologies. Kerr et al. (2006) did document a phase lag between otolith reference chronologies and samples from assays at the edge of the vertebrae that were assigned chronologically to the year of capture. The phase lag between year-of-capture samples and the A4C reference chronologies led the authors to suggest that white sharks were consuming some prey with depleted A4C values from deeper waters in the Pacific. However, the concept of missing growth in the outer margin was not considered because the idea had not yet been described (Francis et al. 2007).
Our results were substantively different from those derived from the Pacific samples. The NWA white sharks in our study with nominal ages up to 44 years aligned well with reference chronologies, confirming that these sharks deposited one band pair per year up to this age. Moreover, the prey base for NWA white sharks reflected A4C values commonly found in coastal
and epipelagic zones (Appendix 2: McMahon et al. 2013b). This observation is consistent with results from the eastern Pacific that found juvenile white sharks tend to stay in shallow water close to the coast (Weng et al. 2007). Similar results have also been recently reported for great hammerhead (Passerotti et al. 2010), young tiger (Kneebone et al. 2008), and young sandbar
(Andrews et al. 2011) sharks in the NWA, indicating that these sharks are also using shallow, well-mixed habitats in coastal or oceanic waters.
We found a significant phase lag in larger white sharks that, based on the alignment of young sharks with reference chronologies, was evidence for significant underestimation of age based on band pair counts in these individuals. The A!4
C chronologies from these individuals showed that the vertebrae are effectively missing time, on the order of one to two decades. This result is not necessarily surprising as band pair counts appear to also underestimate age in older individuals in other shark species (Kalish and Johnston 2001, Francis et al. 2007, Andrews et al.
2011, Appendix 3: Natanson et al. 2013). Given that band pairs are apparently laid down on an annual basis in small to medium sized NWA white sharks, we suggest that the largest individuals may experience a change in the rate of deposition of vertebral material at some point after maturity, or that the band pairs becomes so thin as to be unreadable. This second hypothesis was
supported by the shaved terminal sample that we were able to extract from WS 105 that was clearly post-bomb and close to the NWA reference value for the year of capture. Andrews et al.
(2011) and Natanson et al. (2013, Appendix 3) came to a similar conclusion for sandbar and dusky sharks respectively, in the NWA. Kerr et al. (2006) found a similar phase lag in older northeastern Pacific white shark vertebrae that they argued could not be explained by age under-estimation (though variable vertebral growth was mentioned as a possible factor), but rather by assimilation of A'4C-depleted carbon from dietary sources. An alternative interpretation of these data based on the fact that their results showed a phase shift as opposed to a lack of a A14C rise in the vertebrae suggests that ages may have been underestimated in these individuals. If the sharks were feeding on a significant amount of A14C-depleted prey, we would expect a noticeably
slowed and dampened response to the rise of A14C in the Pacific, which did not appear to be the case (Figure 1 in Kerr et al. 2006). We would also note that it is difficult to constrain the
deposition date of material at the terminal edge of large white shark vertebrae even with the fine-scale sampling that we used here. Based on the available data, we cannot determine if the results of our study are applicable to white sharks in other locations as age and growth can vary between different shark populations (Campana et al. 2002, Francis et al. 2007), but further studies are clearly warranted.
While fish otoliths obtain most of their carbon through uptake from DIC (Kalish 1993, Thorrold et al. 1997) diet is likely the primary source of carbon in vertebral collagen of elasmobranchs (Kalish and Johnston 2001, Campana et al. 2002). This difference in carbon source may lead to problems when comparing radiocarbon curves between inorganic carbonate structures and organic cartilaginous tissues. Equilibration of carbon isotopes incorporated through trophic transfer is likely to be slower than uptake from DIC and this would, in turn, act to reduce the rate of increase and perhaps the amplitude of the radiocarbon rise depending on the variability of tissue turnover rates in food sources. This effect is likely to increase with the trophic level or age of the prey (Campana et al. 2002), at least to the degree that either variable correlates with carbon turnover rates in muscle tissue of individual prey species. However, NWA white shark records did not show any obvious reduction in the slope of the radiocarbon rise compared to carbonate reference chronologies (though attenuation may be possible and unresolvable in the post-SA4C rise period). The synchronization between the coral reference
chronology and WS28 and WS100 demonstrates that white sharks must quickly reach carbon isotopic equilibrium with their diet, or feed on prey that is isotopically equilibrated with ambient DIC. Vertebral samples from other shark species that lag carbonate reference chronologies
(Campana et al. 2002) presumably reach isotopic equilibrium with their environment
considerably more slowly than white sharks. Nonetheless, this observation further supports our contention that age under-estimation is the most likely cause of the phase lag between the reference chronologies and the vertebral profiles.
Atlantic white sharks are poorly studied in terms of diet and movement when compared to their Pacific, Australian, and South African counterparts. Post-A4C rise periods of the white shark profiles revealed some interesting differences among individuals and potentially between sexes that may be related to movement or diet shifts. The post-SA4
C rise signal of a location depends on oceanic conditions affecting the diffusion of atmospheric radiocarbon into the sea surface coupled with mixing rates and radiocarbon depth gradients and, therefore, varies significantly both within and across ocean basins (Appendix 2: McMahon et al. 2013b). These oceanic conditions as well as biotic factors also impact the 613C signal of a location (Appendix 2: McMahon et al. 2013b). We found that male sharks aligned more closely with the NWA otolith reference record than the Florida coral record, suggesting that these individuals spent a
significant amount of time in northern shelf waters. However, a similar pattern would also be observed if the sharks shifted to a diet of animals with A4
C-depleted values. Post-A 4C rise radiocarbon values for two females (WS 117 and WS 134) sat anywhere from 10-70%o above the NWA otolith curve, suggesting residency in more southerly and tropical waters than the males in our study.
Our interpretation of habitat differences between sexes and among individuals in this study is reinforced by the post-A14C rise correlation between 8"C and A14
C in the white shark vertebrae; less depleted 613C values are indicative of lower latitudes in the Atlantic and more depleted 613C values are indicative of more northern waters (Fig. 4) (Appendix 1: McMahon et al. 2013a). Sex-specific differences in habitat use have been documented for Pacific white sharks (Domeier and Nasby-Lucas 2012), as has individual diversity in feeding strategy. Using stable C and N isotopes in vertebrae, Kim et al. (2012) found a surprising degree of within and among individual variation attributable to a combination of both differences in diet and movement. Our 6i3C data also hint at this, with general agreement in early growth, followed by individual
differences (Fig 3). Kerr et al. (2006) noted a trend of lower 1 3
C values with increasing age and attributed this to differences in juvenile and adult habitat. While we did not consistently find this pattern, the two oldest individuals, both males (WS57, WS 105), exhibited lower 8'3
they aged. Changes in diet also affect 613C values; an increase in trophic level generally
corresponds to an enrichment of approximately 1%c (Michener and Schell 1994). Based on bulk
5
"N, which tends to be more sensitive to diet change than V"C, Estrada et al. (2006) found apparent size-based trophic shifts in NWA white sharks. It's likely that the variation in both A 4C
and o1 3C in our study results from a combination of diet and movement differences; more work on the ecology of NWA white sharks is needed to understand and explain the observed
variability.
White sharks in our study also displayed marked sexual dimorphism in size at age, assuming our age interpretations are correct. The largest male and female (WS 105 and WS8 1) in this study were similar in size (FLs: 493 cm and 526 cm respectively), yet their ages, as
estimated by radiocarbon analyses, differed by up to thirty-three years. WS8 1, the largest female, is almost a meter longer and yet still four years younger than the second largest male in our study
(WS57). The smallest sharks in our study (males: WS100, WS143; female: WS28) are also very
similar in size, yet the two males are 3 and 8 years older than the female, respectively. Sexual dimorphism in growth rates is common in lamnids (Francis et al. 2007), although it is usually thought that larger females are also older. While our sample is limited, the NWA white sharks in this study appear to show the opposite trend. Since the lifetimes and sampling dates of these sharks span several decades, changes in habitat quality may also have influenced this trend.
Assuming a lifespan estimate of 70 years or more, white sharks may be among the longest-lived chondrichthyan fishes (Cailliet and Goldman 2004). Population projections for white sharks based on earlier age and growth data will, therefore, need to be revisited in the NWA. Modeling of elasmobranch populations has found that age at maturity accounts for most of the variance in population growth rates; sharks that mature late, have long lifespans, and small
litters have the lowest population growth rates and longest generation times (Smith et al. 1998, Cortes 2002). While increased overall longevity implies that each individual has greater potential lifetime productivity, modeling studies suggest that the ability of a shark species to recover from fishing pressure is little affected by overall longevity (Smith et al. 1998), and changes in juvenile survival actually have the greatest effect on population growth rates (Cort6s 2002). We predict that age at maturity for NWA white sharks will be substantially higher than estimates from other areas, using our age data. Earlier work concluded that white sharks have low rebound potential when exposed to fishing pressure (Smith et al. 1998) and high intrinsic vulnerability to extinction
(Rogers et al. 2013). Thus an increase in age at maturity would make white sharks even more sensitive to fishing pressure than previously thought. While already protected in many nations, even low levels of bycatch mortality are likely to have significant impacts (Dulvy et al. 2008) on attempts to rebuild white shark populations from historical over-fishing in the NWA (Baum et al. 2003 but see Burgess et al. 2005) and potentially other populations in the Pacific and Indian Oceans.
2.6 Acknowledgements
We thank M. Lardie Gaylord, A. McNichol, and other staff members at NOSAMS for help with sample preparation and processing. Thanks to the fishermen that allowed us to sample their catches and tournament officials that gave us the opportunity to sample at their events. We are grateful for discussions with A.H. Andrews and G. Cailliet; A.H. Andrews additionally provided valuable assistance with data interpretation and manuscript edits. We appreciate the helpful comments and suggestions provided by the editor and two anonymous reviewers.
2.7.1 Collection and sampling information for individual sharks'
Shark Year FL Sex Maturity".' Band Estimated Estimated years
collected (cm)" pairs Bomb sampled"v
A14C Age
WS100 1968 223.5 M N/A 9 9 1958.5 - 1965
WS143 2010 222.2 M I 14 14 1995.5 - 2007
WS81 1983 526 F N/A 33 40 1943-1973
WS134 1996 495.3 F N/A 35 32 1964.5 - 1995
Discrepancies between band pair counts and bomb A!4C age indicate instances where a shift was necessary to align sample A!4C values to reference curves.
"FL, fork length.
M: mature, I: immature, N/A: information not available.
v Estimates based on band pair counts, and ages estimated from A14C values when shark trajectories required adjusting.
2.8.1 Photomicrographs of sectioned vertebrae
A) Upper section of vertebra taken from WS 105. B) WS 100 vertebra; first dot is the birth band. Visible band pairs are marked by dots on the corpus calcareum. The lines indicate the vertebral radius (16.6 mm). Vertebral radius is measured at the angle of the vertebra where the
intermedialia meets the corpus calcareum.
2.8.2 White shark A14
C results compared to three A14
C reference chronologies (Druffel and Linick 1978, Campana et al. 2002, Campana et al. 2008). Results from male (A, B) and female (C, D) white shark vertebrae. Dotted line is porbeagle data smoothed with a Loess curve. For panels B and D, the arrows indicates the vertebral A1 4C curves that had to be shifted to line up with the reference
chronologies (white open symbols are initial data, black symbols are data shifted to align with the references).
PA A a coral otolith gle 0 0 3 0 160 120 80 S40 -40 -80 1950 1970 Deposition year 1990 160 120 80 40 0 -40 -80 -120 )10 191 B) Mal" mA --- Florida coral - -NWA otolith 0 Porbeagle -0-WS105 +*WS105 adjusted 0 1930 1950 1970 Deposition year /AA coral bolith gle 1\ -160 120 80 40 <0 -40 40 -120 D) Females --- Florida coral - -NWA otolith 0 Porbeagle twS810 -*-WS81 adjusted -WS134 -WS134 adjusted 0 0 A) Males --- Florid -- NWA 0 Porbe +WWS14 0 1910 1930 C) Females --- Florida - -NWAo o Porbea *WS28 -*WS117 160. 120 80 -40 40 -40 1990 2010 I . . . -2( -121 I -12n 1
2.8.3 813C values for individual sharks
Plotted by age as corrected to fit the A14C reference curves. -12 *WS28 --WS81 -*-WS117 WS134 -- WS57 13 -- WS100 0WS105 -brWS143 -14 -15 . . . . . . 0 10 20 30 40 50 60 70 Age
2.8.4 Bivariate plot of 613C versus A14C for individual sharks -12 -13 -14 --15 -9 +N-WS218 -A-WS81 -*-WS117 -WS134 -+-WS57 -uWS100 -O-WS105 -WS143 0 -30 30 A14C (%o) 90 150
2.9.1 Linear trends fit to the A 4C rise portion of the reference chronologies
A) Florida coral reference chronology, used to correct WS 134. B) NWA otolith reference chronology, used to correct WS81 and WS105.
165 A -- Florida coral Linear (Florida ol Y22.365X-43848 oral) 0.95551 _4 -- NWA otolith -Linear (NWA otolith) 1960 1965 Deposition year y = 14.726x - 28892 R2 = 0.95169 1970 115 '65 15 -35 -85 165 B 115 65 15 -35 -85 1955