HAL Id: hal-01234460
https://hal.archives-ouvertes.fr/hal-01234460
Submitted on 1 Dec 2015HAL is a multi-disciplinary open access
archive for the deposit and dissemination of sci-entific research documents, whether they are pub-lished or not. The documents may come from teaching and research institutions in France or abroad, or from public or private research centers.
L’archive ouverte pluridisciplinaire HAL, est destinée au dépôt et à la diffusion de documents scientifiques de niveau recherche, publiés ou non, émanant des établissements d’enseignement et de recherche français ou étrangers, des laboratoires publics ou privés.
Peixiang Ma, Paul Schanda
To cite this version:
Peixiang Ma, Paul Schanda. Conformational Exchange Processes in Biological Systems: Detection by Solid-State NMR. eMagRes, Wiley, 2015, �10.1002/9780470034590.emrstm1418�. �hal-01234460�
Conformational Exchange Processes in Biological
Systems: Detection by Solid-State NMR
Peixiang Ma1,2,3,4 and Paul Schanda1,2,3
1 Université Grenoble Alpes, IBS, F-38044 Grenoble, France 2 CEA, Institut de Biologie Structurale, F-38044 Grenoble, France 3 CNRS, Institut de Biologie Structurale, F-38044 Grenoble, France
4 Shanghai Institute for Advanced Immunochemical Studies (SIAIS), ShanghaiTech University, Shanghai,
201210, China Abstract
We review recent advances in methodologies to study microseconds-to-milliseconds exchange processes in biological molecules using magic-angle spinning solid-state NMR (MAS ssNMR) spectroscopy. The particularities of MAS ssNMR, as compared to solution-state NMR, are elucidated using numerical simulations and experimental data. These simulations reveal the potential of MAS NMR to provide detailed insight into short-lived conformations of biological molecules. Recent studies of conformational exchange dynamics in microcrystalline ubiquitin are discussed.
1. INTRODUCTION
The three-dimensional structure of a biomolecule is dictated by a subtle balance of numerous interactions within the molecule and with its surrounding. These interactions are all individually weak, and at physiologically relevant temperatures they are continuously rearranged. As a consequence, biomolecules populate a multitude of different conformations, differing in their structural and thermodynamic properties, constantly exchanging in a dynamic equilibrium. Molecular functions, such as enzymatic activity, allosteric regulation, or transport across membranes, often critically depend on the relative populations of these states, as well as the rates of the interconversion.1,2 In order to
understand biomolecular function, it is therefore crucial to determine not only a single, three-dimensional structure, that may be considered as the “lowest-energy” conformation, but also to understand what alternative conformations are sampled, and at which rates they interconvert. Many biomolecular functional processes take place within microseconds to seconds, and this time scale is therefore of particular interest when relating protein motion to activity. An increasing number of studies reveal a direct link between the functional turnover of the activity of a protein and the dynamic interconversion between conformational substates; this link has been exemplified for cases of enzyme catalysis,
membrane transport and allostery.3-7
Solution-state NMR spectroscopy is among the most powerful techniques for elucidating microsecond-to-millisecond (µs-ms) dynamics in proteins and nucleic acids. In solution-state NMR, the interconversion between different conformers on µs-ms time scales can be probed through the difference of the isotropic chemical shifts of different conformers. The fluctuation of the chemical shift results in line broadening or, equivalently, increased apparent transverse relaxation rate constants, which can be quantitatively probed. In
particular, so-called relaxation dispersion (RD) techniques and chemical-exchange saturation transfer (CEST) have proven extremely powerful for visualizing conformational exchange dynamics and thus provide insight into short-lived conformations, even if they
are populated to only a few percent.8-12 The methodology in solution-state NMR has been
continuously refined over the last two decades. Nowadays, the available techniques provide a wealth of information about the kinetics of dynamic processes, the relative
populations of states as well as dynamics13, hydrogen-exchange rates14 and even
atomic-resolution structures of the short-lived states.15-17
Magic-angle spinning solid-state NMR (MAS ssNMR) rapidly emerges as a tool in structural biology. Its particular power lies in the fact that it does not rely on the molecular tumbling – that is the basis of high-resolution solution-state NMR – for achieving highly-resolved spectra. This opens possibilities to study proteins that are insoluble (aggregates, fibers, membrane proteins in lipid bilayers etc), or which are very large and slowly-tumbling molecular systems (large molecular machines, entire cells or cell walls etc) and thus have unfavorable relaxation properties in solution-state NMR. Currently the methodologies for studying µs-ms dynamics by solid-state NMR are less developed and less widespread than their solution-state NMR counterparts. Yet, for theoretical reasons outlined below, ssNMR offers in principle a greater variety of observables that can report on such motion. In this article, we want to review some of the theory related to measurements of µs-ms dynamics by magic-angle spinning ssNMR. For reasons of space we focus here exclusively on spin-1/2 nuclei, thus leaving out the large body of work
performed with spin >1/2 nuclei (in particular deuterium).18-23 We also refer the reader to
reviews10,24 for a more general treatment of biomolecular dynamics measurements by
2. NMR OBSERVABLES OF MICROSECOND-TO-MILLISECOND DYNAMICS
When a molecule undergoes exchange between different conformations, this dynamic process leads to changes of several NMR-relevant parameters in the molecule, namely the dihedral angles and electronic environment around the involved nuclei, and the relative orientations and distances between nuclei. These structural changes lead to (i) fluctuations of the chemical shift tensors of the involved nuclei, both in terms of the isotropic component and the orientation and magnitude of the anisotropic chemical shift, (ii) fluctuations of the magnitudes and orientations of the dipolar coupling tensors, and (iii) the scalar couplings (although the latter are generally less important). It is through these fluctuations of NMR observables that one can obtain information about molecular dynamics. Figure 1 schematically represents such exchange dynamics between two differently populated protein conformations.
In solution-state NMR, molecules undergo rapid overall reorientation (“tumbling”, typically on a time scale of < 10-100 ns). This overall motion averages the anisotropic (i.e. orientation-dependent) interactions, chemical-shift anisotropy (CSA) and dipolar-coupling tensors, to zero. Consequently, if we consider an exchange process taking place on a time scale of microseconds or longer, then all the chemical-shift anisotropies and dipolar couplings are zero in all the involved states. Therefore, as these anisotropic interactions are equal (zero) in the exchanging states, these quantities cannot be exploited for probing motion. Consequently, only the orientation-independent, i.e. isotropic quantities can provide information about the presence of exchange dynamics in solution-state NMR.
Thus, all available techniques in solution-state NMR for detecting µs-s exchange processes
require that the exchanging states differ in their isotropic chemical shifts.‡
The situation is different in MAS ssNMR, where molecules do not undergo overall rotational motion. In order to achieve high resolution in MAS NMR, the sample is spun at a constant frequency along the magic angle, which averages anisotropic interactions over an entire sample rotation period. The resulting averaging is different to the situation in solution-state NMR: while in solution the tumbling is fast (nanoseconds), spatially isotropic and stochastic, magic-angle spinning occurs on a time scale of tens microseconds and it is a periodic and deterministic process, rather than a stochastic one. This has important consequences in the present context. First, MAS does not perfectly average out the anisotropic interactions, notably in the case of multiple (non-commuting) interactions, in contrast to solution-state NMR. This latter feature means that the effect of these interactions is only scaled down, proportional to the inverse spinning speed, and spin coherences evolve still under the remaining action of anisotropic interactions. In practice, this evolution, in particular the evolution due to dipolar couplings (termed dipolar dephasing), appears as a decay of spin coherence, similar to relaxation (i.e. stochastic fluctuations due to dynamics). This situation creates problems when attempting to access exclusively the dynamics-related part, as shown below. Second, the periodic nature of the sample rotation can possibly lead to interference effects, namely when the sample rotation (tens of microseconds) is on a similar time scale as the dynamic process and/or a radio-frequency (RF) irradiation applied to the sample. These features of MAS ssNMR bring a
‡ This requirement for isotropic-chemical shift differences between exchanging states is
released when partially aligned (liquid-crystalline) solutions are used, where anisotropic
interactions are re-introduced as residual dipolar couplings and residual CSAs.25,26 This
number of experimental challenges, but also new opportunities with respect to the measurement of µs-ms dynamics, as compared to the more established solution-state NMR techniques.
In this section, we want to investigate the properties of some selected ssNMR experiments that were recently proposed to measure µs-ms exchange dynamics in proteins. We first outline the challenges that one faces when attempting to extract dynamic information from relaxation-type observables. Then we use numerical simulations of a spin system undergoing stochastic conformational exchange and magic-angle spinning to highlight how ssNMR can probe µs-ms motions, and how the experimental observables differ from more widespread solution-state counterparts.
2.1. Transverse relaxation parameters in solid-state NMR
The fluctuation of isotropic chemical shifts arising from a dynamic process leads to line
broadening, whenever the rate of the dynamic process (in units of s-1) is comparable to the
fluctuation of the chemical shift (in units of Hz), i.e. in the µs-ms regime.10,25 Quantifying
line broadening induced by conformational exchange, or equivalently transverse relaxation parameters (R2, R1ρ), is the primary technique to study µs-ms motion in solution-state
NMR. Relaxation-dispersion experiments measure line broadening as a function of a variable RF irradiation. Before investigating how dynamic information may be extracted from such measurements in MAS ssNMR, we need to consider whether one is able to extract such parameters in ssNMR without systematic errors. Indeed, in solid-state NMR it is challenging to interpret line widths in terms of dynamics, due to the fact that line widths contain two contributions, (i) a contribution arising from the stochastic (“incoherent”) molecular motion that alters the local fields – this is the interesting part in the present context –, and (ii) a contribution from “coherent” dephasing processes, that arises primarily
from the evolution of spin coherence under the action of dipolar couplings. This “dipolar dephasing” is a consequence of the fact that MAS cannot simultaneously average out multiple (non-commuting) interactions, and it is thus particularly pronounced in proton-rich environments (i.e. nuclei with large gyromagnetic ratio γ), such as a protein. Line widths (or coherence decay rate constants) are therefore generally unsuitable to study dynamics by solid-state NMR. This being said, an obvious solution to alleviate this problem of dipolar dephasing is (i) to observe heteronuclei (15N, 13C) rather than 1H spins,
(ii) to use deuterated proteins in order to dilute the proton coupling network,26 and (iii) to
employ high magic-angle spinning frequencies (as anisotropic interactions are scaled down with the inverse of the MAS frequency).
Figure 2 investigates the coherence decay rate constants of 15N nuclei along the backbone
of the protein ubiquitin under MAS. The red curve shows the expected R2, which was
calculated based on the backbone dynamics that have been determined through an
extensive set of NMR observables (but not R2).27,28 Average rates are approximately 3-5 s
-1, and site-to-site variations reflect differences in local motion. Black data points show
experimentally measured R2’ decay rate constants§, i.e. the decay under a Hahn echo
sequence, obtained in a highly deuterated protein at high MAS frequency (νMAS=57 kHz).29
These data clearly show that even under these favorable conditions (fast MAS and deuteration), 15N R2’ rates are significantly above their expected values. This finding
immediately shows that by measuring 15N R2’ rate constants one cannot unambiguously
extract information about dynamics, as dipolar dephasing contributes to these rates. The pattern of the black data in Figure 2 shows that some information about dynamics is
§ The term R
2’ is used for the observed decay rate in a simple coherence echo experiment –
containing thus coherent and incoherent contributions, to distinguish it from R2, which is
nonetheless encoded in R2’. For example residues 23 and 55 have much
larger-than-average R2’, and as we will show below they undergo µs motions. It is noteworthy that
deuteration still helps reducing the apparent line widths, as R2’ rate constants in protonated
proteins are generally significantly higher, and require high-power 1H decoupling.30
The situation is greatly improved when 15N R1ρ is measured, i.e. the decay under a 15N
spin-lock RF field. 15N R1ρ data shown in blue are obtained on the same deuterated protein
at a MAS frequency of 39.5 kHz. In this case the observed rate constants closely match the
expected ones. Two groups have independently proposed to use 15N R1ρ rate constants,31,32
and have advocated deuteration or fast-MAS (above ~40 kHz) to suppress dipolar
dephasing in such experiments. Of course, these approaches can be combined,28 as shown
here on a deuterated protein at 39.5 kHz MAS.
To summarize, dipolar dephasing represents an experimental challenge that hampers the extraction of dynamic information from coherence life times/line widths. The solutions are either to find a parameters which is not sensitive to dipolar – the 15N R1ρ is such a
parameter –, or to measure several observables, which individually are not “clean”, but of which the difference reflects only the dynamics. As we will show below, differential decay of zero- and double quantum coherence is such a case; furthermore, measurements of the
differences of R2’ rates, obtained under different CPMG frequencies also can be
interpreted in terms of dynamics to some reasonable approximation. We next consider how these parameters, R1ρ relaxation dispersion, CPMG relaxation dispersion and differential
ZQ/DQ decay, can provide insight into dynamics.
We first consider dynamics measurements through 15N R1ρ relaxation dispersion
experiments. In this approach, widely used in solution-state NMR, the decay of 15N
coherence is measured under a 15N spin-lock RF field; the dependence of the R1ρ rate
constant on the RF field strength reflects µs dynamics. To analyze the properties of this experiment, we perform numerical simulations of a spin system exchanging between two discrete states, as depicted in Figure 1. The two-state exchange model was chosen due to its simplicity and tractability in numerical simulations, but it also seems to reflect µs-ms dynamics in proteins rather realistically: numerous studies indeed showed that few (two or three) conformational substates (and fast local motion within these basins), suffice to
model NMR-derived µs-ms dynamics data.5,6,16,17,33,34 For simplicity we consider only a
two-spin system, neglecting remote proton spins; similar simulations with a remote spin
are shown elsewhere,35 and the difference to the present calculations are inconsequential
for the present discussion.
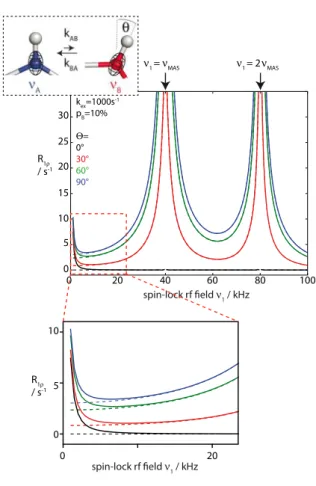
Figure 3 shows the simulated R1ρ rate constant for a 15N spin undergoing a two-site
exchange process between two states populated to 10% and 90%, respectively. We assume here different cases, in which this exchange process alters the isotropic chemical shift of the 15N spin, the orientation of the 15N CSA and HN bond orientation, or both. We investigate the dependence of R1ρ on the strength of the spin-lock RF field, i.e. the
relaxation dispersion of R1ρ. In the case shown by black curves, only the 15N isotropic
chemical shift is altered, while the two conformations have identical CSA and bond
orientations. The resulting relaxation dispersion curve in this case shows a decrease of R1ρ
when the RF field increases up to about 10 kHz (a zoom of this part is shown in the bottom of the figure), and is flat for larger RF fields. This dispersion is exactly identical to the case in solution-state NMR, i.e. it can be exactly described by the Bloch-McConnell formalism.10,36 Of course, when the isotropic chemical-shift difference between the two
states becomes zero (dashed line), then no dispersion is observed, as expected because the two states are then exactly identical.
In the more general case that the exchange process also involves a change of the anisotropic interactions, i.e. the HN bond orientation (and possibly length) and CSA tensor orientation (or magnitude), the situation gets more complex. Red, green and blue curves in Figure 3 exemplify such cases, assuming different jump angles. From these curves it becomes evident that the isotropic chemical-shift difference still gives rise to a dispersion
of R1ρ, according to the Bloch-McConnell formalism (see zoom region in Figure 3).
However, there is overall an increase of the R1ρ rate constants, which comes from the fact
that the fluctuating anisotropic interactions induce relaxation. This increase of R1ρ is,
however, not uniform, but it is particularly pronounced when the spin-lock RF field strength approaches the sample rotation frequency or twice this frequency, i.e. close to the so-called rotary resonance conditions (ν1=νMAS or ν1=2νMAS). At these conditions the
anisotropic interactions, which are averaged by MAS, become re-introduced, as the spin-lock RF frequency and the MAS frequency match. This so-called recoupling occurs even without dynamics. However, the range of RF fields over which this rotary resonance match occurs is significantly broadened by the exchange process, and this broadening depends on
the dynamics35,37,38. That the exchange process impacts the R
1ρ dispersions around these
rotary-resonance conditions is readily seen by comparing the red, green and blue curves in Figure 3 (different jump angles). In addition to the jump angle, these curves furthermore depend on the population of the involved states and the exchange rate constant (shown
elsewhere35,37). Taken together, in the general case of a R
1ρ relaxation dispersion
experiment under MAS, the dispersion profile is the sum of a dispersion arising from the isotropic chemical-shift difference between the states, and a dispersion arising from interference between MAS, RF and the reorientation of the anisotropic interactions
(orientations and magnitudes of dipolar couplings and CSAs). The former part (isotropic chemical-shift difference) can generally be found at RF field strengths of a few kHz, while the latter part (broadened rotary resonance recoupling) is found in the vicinity of the rotary
resonance conditions ν1=νMAS or ν1=2νMAS; when the MAS frequency is sufficiently fast,
these regimes are well separated.
It is also important to remember that the isotropic chemical-shift difference is irrelevant for the relaxation dispersion profile close to these conditions. Even in case the states have identical chemical shifts, there would still be a large R1ρ dispersion observable, which
would be informative of the geometric rearrangement of the dynamic process (dashed lines in Figure 3).37 This possibility to obtain geometrical information about the exchange
process – which would be impossible in isotropic solution-state NMR – can be of great advantage to structurally characterize the exchanging states.
The possibility to extract information from R1ρ relaxation dispersion has been discussed by
Krushelnitsky et al32, Lewandowski et al31, and more recently in a more systematic
manner, including the behavior close to the recouping conditions, by Ma et al.35
2.3. Differential decay of ZQ/DQ coherences
As we have shown above, R1ρ relaxation dispersion experiments provide rich information
about µs-ms dynamics. The particular advantage is that dipolar dephasing seems to be
sufficiently suppressed by deuteration and MAS (≥ 20 kHz seem to suffice35,39), such that
experimentally observed data can be considered as “clean”, reporting only on dynamics. Other parameters may also provide insight into dynamics, but in MAS ssNMR they are “polluted” by contributions other than dynamics. An example of such an observable is the
R2’ rate, which, as we have shown above, contains a significant contribution from dipolar
which are equally impacted by dipolar dephasing, such that the in their difference the unwanted part cancels.
An example of such an approach is the difference between relaxation rates of the two
doublet components of a 15N coupled to 1H. As shown by Reif, Chevelkov and
Skrynnikov, even though the line widths of each of the doublet components are not by themselves reporting on dynamics alone, the difference of the relaxation rates probes the cross-correlated relaxation, which is sensitive to the fluctuation of dipolar coupling and
CSA tensor on time scales of nanoseconds to microseconds.40-42 We focus here on another
parameter, namely the differential relaxation of double- and zero-quantum coherences. The presence of dynamics that involve fluctuations of the chemical shifts of both involved nuclei alters the rates at which double-quantum (such as H+N+, H-N-) and zero-quantum (H+N-, H-N+) coherences relax.43-45 Figure 4 shows the differential relaxation rate of DQ
and ZQ coherences (ΔRMQ=RDQ-RZQ) in a 1H-15N spin pair in MAS ssNMR. In these
simulations, which are done very similarly to the above simulations of R1ρ, it is assumed
that the 1H and 15N chemical shift undergo a simultaneous change due to the dynamic
exchange process. Fluctuation of both isotropic chemical shifts (blue line) leads to differential relaxation whenever the dynamic process occurs on a time scale of microseconds. Fluctuation of the CSA tensors, either in terms of their magnitude or (shown here in green) their orientation, gives rise to differential relaxation whenever the process occurs within tens of nanoseconds to hundreds of microseconds. In the general case both the isotropic and anisotropic component are likely subject to fluctuation upon a dynamic exchange event (red curve). As long as this process occurs on a time scale between tens of nanoseconds to milliseconds, the differential MQ decay will sense such motions through either the isotropic or the anisotropic chemical-shift fluctuations.
It is interesting to note here again, that in solution-state NMR the CSA fluctuation does not sense this time window. Instead, the differential relaxation occurring due to simultaneous CSA/CSA modulation reflects primarily the tumbling and fast internal motion on picoseconds to nanoseconds time scales, but not slower motional processes. This is because any motion beyond the tumbling correlation time cannot be detected through anisotropic interactions.
2.4. CPMG relaxation dispersion in MAS ssNMR
CPMG relaxation dispersion NMR is a widespread approach to quantify µs-ms motion by solution-state NMR. It quantifies the R2 rate constant (most often of 15N or 13C) as a
function of the repetition rate at which 180° refocusing pulses are applied during the
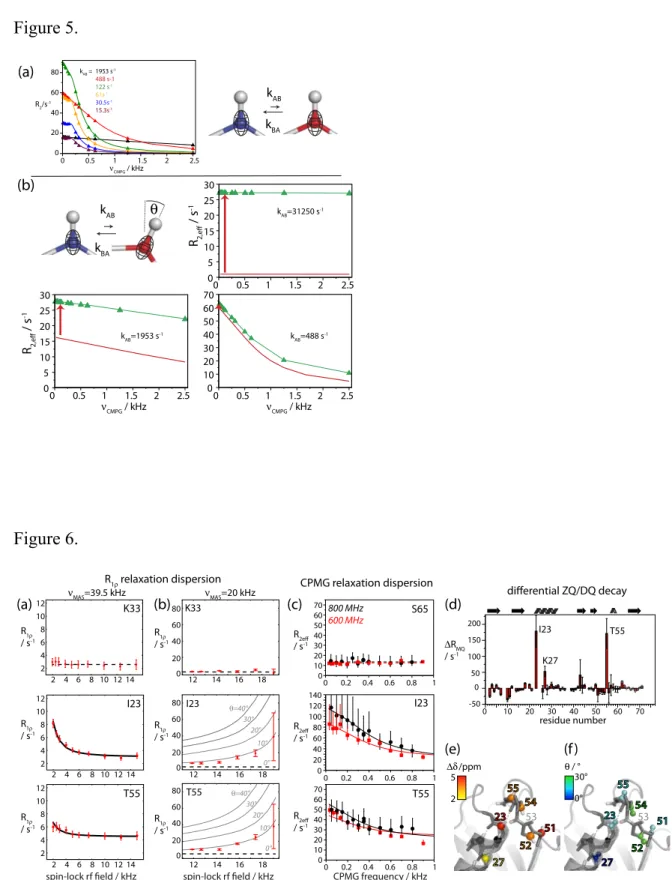
relaxation delay. Figure 5a shows the dependence of R2 on the CPMG frequency,
simulated for the case where the two exchanging states differ only in their 15N isotropic chemical shift, but not their anisotropic interactions (which means that the behavior is exactly like in solution state). Several factors complicate the situation in MAS ssNMR, as compared to solution.
First, as shown by the data in Figure 2, R2’ rate constants in solids are generally not
directly exploitable, i.e. the absolute value of R2’ is to a large portion reflecting factors not
related to motion (dipolar dephasing). This by itself is not necessarily a problem for CPMG
relaxation dispersion, where the absolute level of R2 rate constants is not relevant, but only
the differences of R2 at different CPMG frequencies matter. Second, in the general case
where the exchange process also involves fluctuation of anisotropic interactions (bond orientations, CSA tensors), this fluctuation may interfere with the CPMG pulse train and
MAS, adding an additional dependence of R2’ on the CPMG frequency, on top of the
elsewhere,46 reveal that these factors alter the Bloch-McConnell type of CPMG RD
profile. Under realistic assumptions, the change in the CPMG RD profiles are R2 rate
constants of about <3 s-1. This means that rather small relaxation-dispersion profiles arising from isotropic chemical-shift fluctuations may be masked by this effect. Third, in a solid sample the volume is not entirely uniformly filled, due to inhomogeneous packing of protein (crystals, liposomes, etc) and solvent. This leads to an anisotropic bulk magnetic
susceptibility, which may also give rise to CPMG relaxation dispersion.47
Taken together, the situation of CPMG MAS ssNMR is more complex than its solution-state counterpart, and the analysis may be complicated by the fluctuation of anisotropic interactions. As long as the dispersions due to the isotropic chemical-shift fluctuations are large, it is nonetheless possible to extract information about conformational exchange, as shown below.
3. DETECTION OF CONFORMATIONAL EXCHANGE IN UBIQUITIN
In this last section we show how the above methods can be used to gain insight into conformational dynamics in proteins, using microcrystalline ubiquitin (8 kDa) as an example. Figure 6 shows experimental data from different approaches that provide
evidence for conformational exchange; panels (a) and (b) show R1ρ relaxation dispersion,
and panel (c) shows CPMG relaxation-dispersion data. As a first important finding, the majority of residues, here exemplified in the uppermost panels, show flat dispersion profiles. This is expected for residues that do not exhibit conformational exchange, and is a good indication that artefactual factors, such as the dipolar dephasing discussed above, do not lead to erroneous dispersion profiles under the chosen conditions (highly deuterated samples, fast MAS). A subset of residues, clustering in a well-defined part of the protein including the N-terminal part of the α-helix and the adjacent loop, show non-flat relaxation
dispersion profiles. Panels (a) and (c) focus on the part of the relaxation dispersion profiles that are sensitive to isotropic chemical-shift fluctuations, i.e. rather low spin-lock RF fields at fast MAS (cf the box highlighted in Figure 3). The residues that show exchange in this
regime also display a strong R1ρ relaxation dispersion under conditions where the RF field
strength comes close to the MAS frequency (cf. Figure 3). This latter observation is
indicative of a fluctuation of the orientations of the involved bond (and 15N CSA tensors).
Lines in panels (a)-(c) indicate numerical fits of the cluster of exchanging residues to a
global two-site exchange model.35,46 Such fits reveal that this part of the protein exchanges
with a minor conformer, populated to about 10%, at a rate of about 3000 s-1, and also provides site-specific chemical-shift changes between the major and minor conformers (plotted onto the structure in panel e). Panel (b) shows that it is possible to estimate the angle by which the NH bonds fluctuate through the exchange process (plotted onto the structure in panel f). Finally, Figure 6d shows differential ZQ/DQ decay data, obtained on
the same crystals.46 This experiment shows large differential decay for residues located in
the same part of the protein, and the three residues that have increased differential ZQ/DQ
decay data set also reveal relaxation dispersion (in both CPMG and R1ρ experiments).
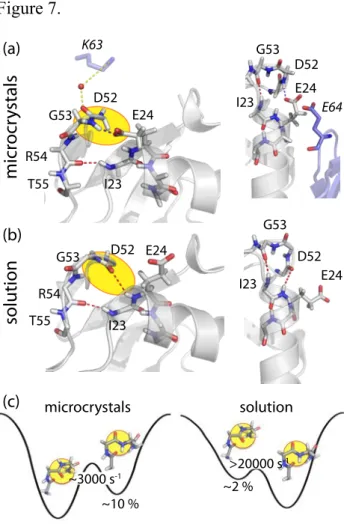
Taken together, three different methods all point to an exchange process in a well-defined part of ubiquitin’s structure (Figure 6 e,f). What is this exchange process mechanistically, i.e. what does the minor conformational state look like? Answers come from both comparison of different ubiquitin structures and from the structure-related parameters obtained from the above experiments, as well as from solution-state NMR experiments detecting exchange dynamics. The available structure of ubiquitin, determined by NMR in solution or X-ray crystallography, fall in two classes, which differ in the conformation of the peptide plane D52/G53 (Figure 7). In the microcrystals used in the presented solid-state NMR experiments, the carbonyl of D52 points outward, while the NH of G53 points
towards the helix and forms a hydrogen bond with the side chain of E24, i.e. the loop forms a so-called type-II β-turn (Figure 7a). In solution, by contrast, as well as in many other crystal structures, the D52/G53 peptide plane is rotated by roughly half a turn, forming a type-I β-turn with a different hydrogen-bonding arrangement (Figure 7b). There
is evidence from mutation studies,48 and solution-state relaxation-dispersion
experiments49-51 that the exchange observed corresponds to the transition between these
two structures, i.e. between type-I and type-II β-turn conformations. This is also our interpretation of the ssNMR dynamics data. If the flip of D52/G53 is occurring along the exchange, then the bond orientations of this region should change most when the molecules undergoes its exchange process. Figure 6f shows that this is indeed the case, i.e. the largest angle changes occur for the peptide planes neighboring D52/G53.
The exchange process in solution therefore seems to be present also in microcrystals. Interestingly, however, the exchange process in solution-state occurs more than one order of magnitude faster than in microcrystals. This can be understood by contacts with neighboring molecules in the crystal lattice (Figure 7a), which constitute additional free-energy barriers to be overcome in the exchange process. It is also interesting to note that the minor state in solution is the major conformer in microcrystals and vice versa, as seen by inspection of the respective structures determined on microcrystals by X-ray diffraction and solution-state NMR, respectively. Thus, the relative order of the states is inverted in microcrystals as compared to solution, and the energy barriers are altered by the crystal contacts (Figure 7c).
4. CONCLUSIONS
We have briefly shown in this review some of the approaches developed recently to study µs-ms exchange processes using MAS ssNMR. Using experimental data on ubiquitin and
numerical simulations of an exchanging spin system under MAS, we have highlighted the particularities of MAS NMR approaches. The primary challenge resides in the difficulty of accessing “clean” transverse relaxation parameters that solely reflect dynamics.
Deuteration, fast MAS and the use of appropriate observables (R1ρ or differences of
coherence decay parameters rather than these parameters themselves) are the key to determining motion. Besides these challenges, the possibility to create interferences between the rates of MAS, RF fields and the dynamic process hold promise for obtaining a wealth of data of exchanging systems, including structural insights into the short-lived transient conformations that may be important for function. Solid-state NMR’s potential to provide structural information about such short-lived states even in very large or insoluble proteins will be very valuable for understanding the function of membrane proteins or
large functional assemblies. The available studies have so far focused on amide 15N sites,
but it can be foreseen that very similar approaches will become available for other sites, such as additional probes along the backbone (Cα, carbonyl), or side chains (e.g. methyl
groups). Advances in isotope labeling approaches will facilitate such developments. We believe that methods such as those reviewed herein will help shed light on short-lived states of protein which are currently out of reach for atomic-resolution studies of dynamics.
REFERENCES
(1) Henzler-Wildman, K.; Kern, D. Nature 2007, 450, 964.
(2) Karplus, M.; Kuriyan, J. P Natl Acad Sci Usa 2005, 102, 6679.
(3) Boehr, D.; McElheny, D.; Dyson, H.; Wright, P. Science 2006, 313, 1638.
(4) Wolf-Watz, M.; Thai, V.; Henzler-Wildman, K.; Hadjipavlou, G.; Eisenmesser, E.
Z.; Kern, D. Nat Struct Mol Biol 2004, 11, 945.
(5) Bruschweiler, S.; Schanda, P.; Kloiber, K.; Brutscher, B.; Kontaxis, G.; Konrat,
R.; Tollinger, M. J Am Chem Soc 2009, 131, 3063.
(6) Morrison, E. A.; DeKoster, G. T.; Dutta, S.; Vafabakhsh, R.; Clarkson, M. W.;
Bahl, A.; Kern, D.; Ha, T.; Henzler-Wildman, K. A. Nature 2011, 1.
(7) Tzeng, S.-R.; Kalodimos, C. G. Curr Opin Struct Biol 2010.
(8) Baldwin, A.; Kay, L. Nat. Chem. Biol. 2009, 5, 808.
(9) Sekhar, A.; Kay, L. E. P Natl Acad Sci U.S.A. 2013, 110, 12867.
(10) Palmer, A. G.; Massi, F. Chem Rev 2006, 106, 1700.
(11) Fawzi, N. L.; Ying, J.; Ghirlando, R.; Torchia, D. A.; Clore, G. M. Nature 2011,
480, 268.
(12) Vallurupalli, P.; Bouvignies, G.; Kay, L. E. J Am Chem Soc 2012.
(13) Hansen, D. F.; Vallurupalli, P.; Kay, L. E. J Am Chem Soc 2009, 131, 12745.
(14) Long, D.; Bouvignies, G.; Kay, L. E. P Natl Acad Sci Usa 2014, 111, 8820.
(15) Bouvignies, G.; Vallurupalli, P.; Hansen, D. F.; Correia, B. E.; Lange, O.; Bah, A.;
Vernon, R. M.; Dahlquist, F. W.; Baker, D.; Kay, L. E. Nature 2011, 477, 111.
(16) Korzhnev, D.; Religa, T.; Banachewicz, W.; Fersht, A.; Kay, L. Science 2010,
329, 1312.
(17) Neudecker, P.; Robustelli, P.; Cavalli, A.; Walsh, P.; Lundstrom, P.;
Zarrine-Afsar, A.; Sharpe, S.; Vendruscolo, M.; Kay, L. E. Science 2012, 336, 362.
(18) Krushelnitsky, A.; Reichert, D. Prog Nucl Mag Res Sp 2005, 47, 1.
(19) Meirovitch, E.; Liang, Z.; Freed, J. H. J. Phys. Chem. B 2015.
(20) Olsen, G. L.; Bardaro, M. F.; Echodu, D. C.; Drobny, G. P.; Varani, G. J Am Chem
Soc 2010, 132, 303.
(21) Vugmeyster, L.; Ostrovsky, D.; Ford, J. J.; Burton, S. D.; Lipton, A. S.; Hoatson,
G. L.; Vold, R. L. J Am Chem Soc 2009, 131, 13651.
(22) Siminovitch, D. J. Biochem. Cell Biol. 1998, 76, 411.
(23) Hologne, M.; Chen, Z.; Reif, B. J Magn Reson 2006, 179, 20.
(24) Palmer, A. G. Chem Rev 2004, 104, 3623.
(25) Cavanagh, J.; Fairbrother, W. J.; Arthur G Palmer, I.; Skelton, N. J.; Rance, M.
Protein NMR Spectroscopy; Academic Press, 2010.
(26) Reif, B. J Magn Reson 2012, 216, 1.
(27) Schanda, P.; Meier, B. H.; Ernst, M. J Am Chem Soc 2010, 132, 15957.
(28) Haller, J. D.; Schanda, P. J Biomol NMR 2013, 57, 263.
(29) Schanda, P.; Huber, M.; Verel, R.; Ernst, M.; Meier, B. H. Angew Chem Int. Ed.
Engl. 2009, 48, 9322.
(30) Chen, L.; Kaiser, J. M.; Lai, J.; Polenova, T.; Yang, J.; Rienstra, C. M.; Mueller,
L. J. Magn Reson Chem 2008, 45, S84.
(31) Lewandowski, J. R.; Sass, H. J.; Grzesiek, S.; Blackledge, M.; Emsley, L. J Am
Chem Soc 2011, 133, 16762.
(32) Krushelnitsky, A.; Zinkevich, T.; Reichert, D.; Chevelkov, V.; Reif, B. J Am Chem
Soc 2010, 132, 11850.
(33) Schanda, P.; Brutscher, B.; Konrat, R.; Tollinger, M. J Mol Biol 2008, 380, 726.
(35) Ma, P.; Haller, J. D.; Zajakala, J.; Macek, P.; Sivertsen, A. C.; Willbold, D.; Boisbouvier, J.; Schanda, P. Angewandte Chemie (International ed in English)
2014, 53, 4312.
(36) McConnell, H. M. J Chem Phys 1958, 28, 430.
(37) Quinn, C.; McDermott, A. J Biomol NMR 2009, 45, 5.
(38) Quinn, C. M.; McDermott, A. E. J Magn Reson 2012, 222, 1.
(39) Krushelnitsky, A.; Zinkevich, T.; Reif, B.; Saalwächter, K. J Magn Reson 2014, 1.
(40) Skrynnikov, N. Magn Reson Chem 2007, 45, S161.
(41) Chevelkov, V.; Diehl, A.; Reif, B. Magn Reson Chem 2007, 45, S156.
(42) Chevelkov, V.; Faelber, K.; Schrey, A.; Rehbein, K.; Diehl, A.; Reif, B. J Am
Chem Soc 2007, 129, 10195.
(43) Früh, D.; Tolman, J. R.; Bodenhausen, G.; Zwahlen, C. J Am Chem Soc 2001, 123,
4810.
(44) Kloiber, K.; Konrat, R. J Biomol NMR 2000, 18, 33.
(45) Wang, C.; Palmer, A. J Biomol NMR 2002, 24, 263.
(46) Tollinger, M.; Sivertsen, A. C.; Meier, B. H.; Ernst, M.; Schanda, P. J Am Chem
Soc 2012, 134, 14800.
(47) Linser, R.; Sarkar, R.; Krushelnitzky, A.; Mainz, A.; Reif, B. J Biomol NMR 2014,
59, 1.
(48) Sidhu, A.; Surolia, A.; Robertson, A. D.; Sundd, M. J Mol Biol 2011, 411, 1037.
(49) Hansen, D. F.; Feng, H.; Zhou, Z.; Bai, Y.; Kay, L. E. J Am Chem Soc 2009, 131,
16257.
(50) Salvi, N.; Ulzega, S.; Ferrage, F.; Bodenhausen, G. J Am Chem Soc 2012, 134,
2481.
FIGURE CAPTIONS
Figure 1.
Schematic representation of a protein undergoing exchange between two conformations. The exchange process alters in general the isotropic chemical shifts of the involved nuclei (shown here for H and N nuclei by different colors), the magnitudes and orientations of the CSA tensors, as well as bond orientations and thus orientations of the associated dipolar-coupling tensors.
Figure 2.
15N transverse relaxation parameters obtained in microcrystalline ubiquitin. Red:
Back-calculated 15N R2 rate constants, based on a detailed analysis of backbone dynamics using
HN dipolar order parameters, 15N R1 rates at multiple fields and 1H-15N dipolar/15N CSA
cross-correlated relaxation rates.27,28 Black: measured 15N R
2’ rate constants with a
perdeuterated sample back-protonated at amide sites to 20%, at a MAS frequency of 57
kHz.29 Blue: 15N R1ρ relaxation rates obtained with a perdeuterated, 50% amide-protonated
sample at 39.5 kHz MAS.28 Note the strongly increase R
2’ rates of residues 23 and 55,
which in part point to exchange dynamics (see main text).
Figure 3.
Numerical simulations of the 15N decay under a continuous-wave spin-lock of variable
amplitude, in a spin system undergoing conformational exchange. The 15N isotropic
chemical-shift difference was assumed to be ΔνAB=300 Hz (solid lines) or ΔνAB=0 (dashed
lines). The MAS frequency was set to 40 kHz, and the population of the minor state and
symmetric with Δσ=-170 ppm. Different colors correspond different angles by which the HN bond and 15N CSA are rotated upon the exchange. In all simulations shown in this article, the HN bond length is set to 1.02 Å.
Figure 4.
Simulated differential decay of 1H-15N ZQ and DQ coherences in a system undergoing
exchange (relative populations of 90%/10%, respectively), as a function of the exchange rate kex=kAB+kBA. Upon exchange, both the 1H and 15N nuclei undergo simultaneous
change of their chemical shifts; if only one nucleus undergoes a change, no differential
decay arises. The isotropic chemical-shift difference of 15N (1H) was set to 160 Hz (800
Hz); details of the CSA tensors are reported elsewhere.46 Figure reproduced from reference
46.
Figure 5.
Simulated CPMG relaxation-dispersion profiles for an exchanging system between two states differing in their 15N isotropic chemical shift by 300 Hz. In (a) only the isotropic chemical shift fluctuates, and the behavior can be exactly described by the
Bloch-McConnell formalism.36 In (b) the HN bond (and associated 15N CSA orientation) is also
modulated. This leads to an additional contribution to the R2 decay rate, which is slightly
different for different CPMG frequencies (visible in particular in the lower right panel).
Figure 6.
Experimental evidence for µs dynamics in microcrystalline ubiquitin. Shown are R1ρ
relaxation-dispersion profiles (a,b), CPMG relaxation-dispersion (c), and differential ZQ/DQ decay rates (d). Panel (e) shows the extracted chemical-shift differences obtained
on a per-residue basis in a global two-state exchange model.35 The top panels in a-c show
residues without conformational exchange, K33 and S65, which have flat dispersion curves
in both CPMG and R1ρ experiments. Panel (f) plots the angle by which the HN bond
fluctuates, as obtained from R1ρ data close to the rotary-resonance condition (see panel
(b)).35 In panel (b), dashed lines show the R
1ρ rate constant obtained at 39.5 kHz MAS and
15 kHz RF field strength; the similarity of this rate at fast MAS with the rates at 20 kHz MAS suggests that 20 kHz MAS and high deuteration levels suffice to suppress dipolar dephasing. All samples were uniformly deuterated and 15N labeled, and reprotonated at
exchangeable sites to 20% (CPMG and differential MQ decay experiments) or to 50% (R1ρ
experiments).
Figure 7.
Structural differences between ubiquitin in microcrystal used in these ssNMR studies (a), and in solution (b). In (a), neighboring molecules in the crystal lattice are shown in blue, and a water molecule mediating a contact to K63 of the neighbor is shown as a red sphere. Panel (c) depicts the differences in the relative stabilities of the two states, their populations and exchange kinetics.
FIGURES
Figure 1.
Figure 2.
free ener
gy
major state minor state
15N isotropic chemical shift 1H isotropic chemical shift
dipolar-coupling and chemical-shift
Figure 3. Figure 4. kex=1000s-1 pB=10% = 0° 30° 60° 90° spin-lock rf field 1 / kHz R1 / s-1 100 80 60 40 20 0 35 30 25 20 15 10 5 0 1 = MAS 1 = 2 MAS 10 5 0 0 20 R1 / s-1 spin-lock rf field 1 / kHz
exchange rate constant kex / s-1
R MQ / s -1 109 102 103 104 105 106 107 108 0 20 40 60 80 100 120 140 fluctuation of 1H,15N isotropic CS only 1H,15N CSA/CSA only both
Figure 5. Figure 6. 0 0.5 1 1.5 2 2.5 0 20 40 60 80 kAB = 1953 s-1 488 s-1 122 s-1 61s-1 30.5s-1 15.3s-1 kAB kBA R2/s-1 CMPG / kHz 0 0.5 1 1.5 2 2.5 0 5 10 15 20 25 30 kAB=31250 s-1 0 0.5 1 1.5 2 2.5 0 5 10 15 20 25 30 kAB=1953 s-1 0 0.5 1 1.5 2 2.5 0 10 20 30 40 50 60 70 kAB=488 s-1 kAB kBA R2,e ff / s -1 CMPG / kHz CMPG / kHz (a) (b) R2,eff / s -1 0 50 100 150 200 -50 0 10 20 30 40 50 60 70 I23 K27 T55 RMQ / s-1 residue number S65 0 0.2 0.4 0.6 0.8 1 R2eff / s-1 0 20 40 60 80 100 120 140 I23 0 10 20 30 40 50 60 70 T55 0 10 20 30 40 50 60 70 0° 30° 2 5/ppm / ° 27 23 51 55 54 52 53 53 23 27 54 51 52 55 CPMG relaxation dispersion (c) I23 800 MHz 600 MHz 2 4 6 8 10 12 14 T55 0 0.2 0.4 0.6 0.8 1 0 0.2 0.4 0.6 0.8 1 2 4 6 8 10 12 2 4 6 8 10 12 K33 0 20 40 60 80K33 I23 10° 0° 20° 30° 40° 14 16 18 12 T55 10° 0° 20° 30° 40° R1 relaxation dispersion
MAS=39.5 kHz MAS=20 kHz differential ZQ/DQ decay
(d) (a) (b) (e) (f) R1 / s-1 2 4 6 8 10 12 2 4 6 8 10 12 14 12 14 16 18 2 4 6 8 10 12 14 12 14 16 18 0 20 40 60 80 0 20 40 60 80 R2eff / s-1 R2eff / s-1 R1 / s-1 R1 / s-1 R1 / s-1 R1 / s-1 R1 / s-1
Figure 7. E24 K63 D52 R54 T55 I23 E64 G53 E24 I23 G53 E24 I23 G53 D52 D52 T55 D52 I23 R54 G53 E24 micr ocr ystals solution (a) (b) (c) microcrystals solution ~10 % ~2 % ~3000 s-1 >20000 s -1