HAL Id: cea-02380864
https://hal-cea.archives-ouvertes.fr/cea-02380864
Submitted on 26 Nov 2019HAL is a multi-disciplinary open access archive for the deposit and dissemination of sci-entific research documents, whether they are pub-lished or not. The documents may come from teaching and research institutions in France or abroad, or from public or private research centers.
L’archive ouverte pluridisciplinaire HAL, est destinée au dépôt et à la diffusion de documents scientifiques de niveau recherche, publiés ou non, émanant des établissements d’enseignement et de recherche français ou étrangers, des laboratoires publics ou privés.
Fission products and nuclear fuel behavior under severe
accident conditions Part 3: Fission Products speciation
in the VERDON-1 Sample
C. Le Gall, E. Geiger, A. Gallais-During, Yves Pontillon, J. Lamontagne, E.
Hanus, G. Ducros
To cite this version:
C. Le Gall, E. Geiger, A. Gallais-During, Yves Pontillon, J. Lamontagne, et al.. Fission prod-ucts and nuclear fuel behavior under severe accident conditions Part 3: Fission Prodprod-ucts speci-ation in the VERDON-1 Sample. Journal of Nuclear Materials, Elsevier, 2017, 495, pp.291-298. �10.1016/j.jnucmat.2017.08.001�. �cea-02380864�
1
Fission products and nuclear fuel behavior under severe accident
conditions
Part 3: Fission Products speciation in the VERDON-1 Sample
C. Le Gall*, E. Geiger, A. Gallais-During, Y. Pontillon, J. Lamontagne, E. Hanus, G. Ducros CEA, DEN, DEC, F-13108 Saint-Paul-lez-Durance, France
Within the frame of the International Source Term Program, VERDON program aims at quantifying the source term of radioactive materials in case of a hypothetical severe accident in a pressurized water reactor. Four VERDON tests were performed in a new experimental laboratory built at the LECA-STAR facility (CEA Cadarache). The VERDON-1 test was devoted to the study of high burn-up UO2 fuel and fission
products release at very high temperature (≈ 2600°C) under reducing atmosphere. Qualitative and quantitative analyses on the VERDON-1 sample enabled obtaining precious information on fission products behavior into the fuel during the test. A promising methodology based on the quantitative results of post-test characterizations has been implemented in order to assess the release fraction of non γ-emitter fission products. The order of magnitude of the estimated release fractions for each fission products was consistent with their class of volatility.
1 INTRODUCTION
During irradiation cycles of nuclear fuel in a Pressurized Water Reactor (PWR), Fission Products (FP) are created and retained into the fuel, modifying its microstructure and properties (thermal conductivity, creep behavior…). In case the three containment barriers would fail, as it is the case during a severe accident, FP can be released from the fuel into the environment. Their nature and the quantity released define the source term.
The chemical nature under which FP are released from the fuel strongly depends on the scenario and the accidental conditions involved (temperature, type of fuel, burn-up, oxygen potential…). Moreover, it greatly impacts FP behavior during their transport in the reactor and hence the source term. A deep understanding of FP release mechanisms from the fuel is thus essential to get a realistic estimation of the source term and hence to be able to better predict the consequences of a severe accident.
Therefore, many research programs have started worldwide to this end [1]–[5]. Integral and analytical tests have thus been carried out in order to reproduce and study the phenomena involved in a severe accident. This led to a better understanding of FP behavior during temperature transients under a controlled atmosphere. A classification of FP according to their volatility has also been proposed largely thanks to the HEVA/VERCORS programs, launched at the CEA in 1989 [1], [6]–[9]: volatile (Xe, Kr, I, Cs, Sb, Te, Cd, Rb, Ag), semi-volatile (Mo, Rh, Ba, Pd, Tc), low-volatile (Ru, Ce, Sr, Y, Eu, Nb, La) and non-volatile FP (Zr, Nd, Pr). Nevertheless, some major uncertainties still remain as far as the assessment of risks for the population and the environment is concerned.
2 Thus, a co-operative research program, the International Source Term Program (ISTP), involving international teams working on severe accidents has started [10]. Four main R&D research axes are addressed in this program, through separate effect experiments:
• Iodine behavior in the reactor coolant system and containment, • Boron effect on the fuel degradation and FP release,
• Air effect on the fuel and FP behavior,
• FP release from high burn-up UO2 and MOX fuels.
In particular, within the frame of the ISTP, four VERDON tests were performed at the LECA-STAR facility (CEA Cadarache). Their objective was to quantify the source term of LWR in case of a hypothetical severe accident. More precisely, the VERDON-1 test was devoted to high burn-up UO2 fuel behavior and FP release under reducing conditions at very
high temperature (up to 2610°C).
The VERDON-1 sample was made of two irradiated fuel pellets in their original M5 cladding selected from the former UO2 father rod. The local burn-up of the fuel section was
calculated to be 72 GWd.tU-1. Before the test, the sample has been re-irradiated at low linear
power (10 W.cm-1) in OSIRIS material testing reactor (CEA Saclay) for about ten days. The objective was to recreate the short half-life FP such as 99Mo, 132Te, 133I, 131I, 140Ba, etc. before the test. The VERDON-1 experimental circuit, the progress of the accidental thermal-hydraulic sequence and the results in terms of FP release and fuel behavior are briefly summarized as it has been extensively discussed in two previous article [11], [12].
In the third part of this series of articles focusing on the VERDON-1 test, a special focus is made on FP behavior into the fuel during the test. A promising methodology based on the quantitative results of post-test characterizations has been implemented in order to assess the release fraction of non γ-emitter fission products. The order of magnitude of the estimated release fractions for each fission products was consistent with their class of volatility.
2 EXPERIMENTAL METHOD
2.1 Fission products release
The main characteristics of the VERDON-1 tests have been extensively described in [13]–[15] and in the second part of this paper so only the main results in term of FP behavior during the test are recalled in this section.
FP behavior during the VERDON-1 test was consistent with that of the VERCORS tests series. In this paper, only a brief overview of the useful results for further analysis is presented. A detailed analysis is proposed in the first part of the paper. The FP release kinetics representative of each category (volatile, semi-volatile, low-volatile and non-volatile) is given on Figure 1.
3 Figure 1: FP release kinetics during the VERDON-1 test
Volatile FP such as Cs or I were totally released by the end of the test.
Regarding semi-volatile FP, their release can be very high but was sensitive to the oxygen potential. For example, Mo release is enhanced in oxidizing conditions whereas Ba release is enhanced in reducing conditions [16]. VERDON-1 results confirmed this phenomenon with a very fast and high Mo release in the first part of the test: up to 40% Mo released by the end of the oxidation plateau. Around 65-70% was released at the end of the test. On the other hand, Ba started to release at around 2000°C. At the end of the test, a significant Ba release of 80% was obtained both due to the high final temperature reached and the reducing atmosphere.
Low and non-volatile FP such as Ru and Zr did not release in high enough quantity to be detectable during the VERDON-1 test.
2.2 Characterizations setup
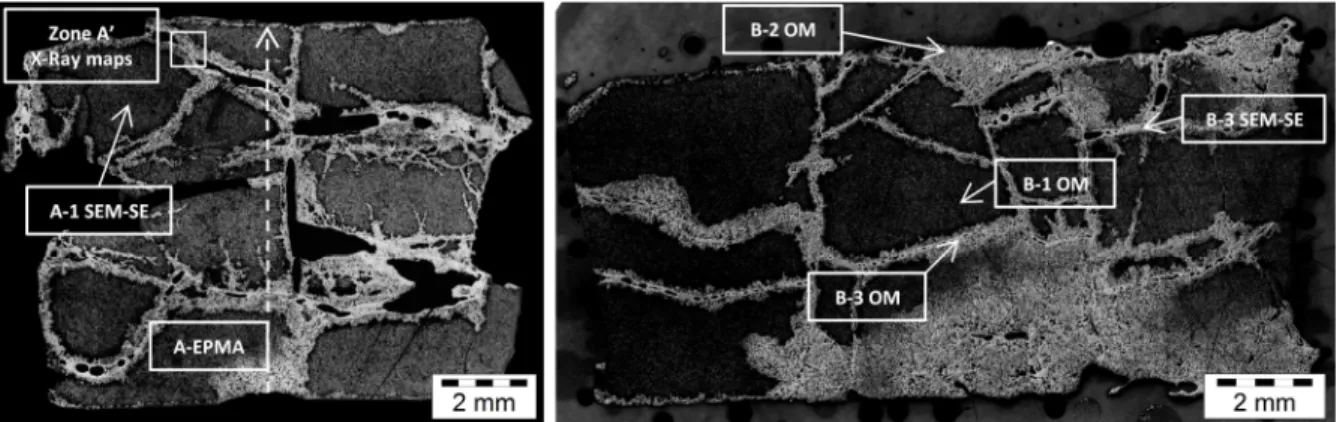
After the test, the two irradiated fuel pellets were separated. Each pellet was prepared in a different way: sample A was embedded in a Wood metallic alloy (Bi/Sn) and sample B in Epoxy resin. The samples in their respective embedding were polished up to the half of their diameter. In order to perform Scanning Electron Microscopy (SEM) analyses on sample B, a carbon coating was required to improve its electric conductivity. Though given their brittleness half a pellet was destroyed during the cutting process. Samples A and B were submitted to post-test examinations in the LECA-STAR facility (CEA Cadarache). SEM and EPMA were performed on sample A and a complete metallographic analysis (optical microscope) was made on sample B, as well as SEM analyses. Only the most representative images obtained by each technique are presented below. Their localization in the samples is
4 presented on the macrographs of samples A and B (Figure 2). On these macrographs, an advanced state of degradation of the samples can be observed. This means that the relocation of the fuel was imminent at the end of the VERDON-1 test [12].
Figure 2: Microraph of the VERDON-1 fuel pellets after the test: Sample A (left) and Sample B (right) after preparation
Optical Microscopy (OM) observations were performed using a LEICA DM RXA2 device adapted for hot cell work. Image acquisition was done with a LEICA DFC 320 camera on the SIS acquisition system.
SEM observations were performed using a Philips XL30 device. Large field acquisitions were performed using the ADDA SIS system and the AnalySIS software was used for images analyses.
Concerning EPMA, a shielded CAMECA SX100R device was used for acquisition and exploitation of the measurements. Incident electron beam characteristics were set at 20 kV and 200 nA.
Secondary Ion Mass Spectroscopy (SIMS) analyses were performed on a CAMECA IMS 6f secondary ion mass spectrometer, also installed inside a shielded glove-box cell was used. The beam acceleration tension was set to 10 keV with an intensity of 100 nA.
3 RESULTS
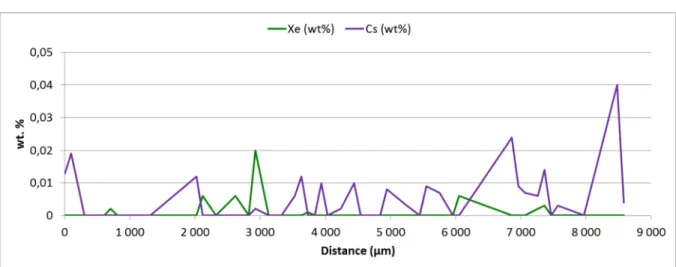
EPMA were performed on Sample A, as indicated on Figure 2 (radial dashed lines). No Xe and Cs were detected in the sample (Figure 3). Indeed, the measured values are below the detection limit of the EPMA equipment which is 0.1 wt%.
As shown on Figure 6, Mo, Ru, Rh and Pd were found to precipitate together as it was the case in the father rod. All the precipitates seem to present similar ratios of these four FP: Ru is the main constituent (51% in average1), followed by Mo (39% in average), Rh (7% in average) and finally Pd (3% in average) (Figure 4). These concentration profiles tend to indicate that none of these FP are present in the fuel matrix. Still, maybe the measured concentrations could be below the detection limit.
1 These values have been calculated considering that the sum of Ru, Mo, Rh and Pd in the three
5
Figure 5 shows that there was no particular association between Ba and Zr.
Figure 3: Xe and Cs transversal EPMA quantitative profiles, Sample A-EPMA
Figure 4 : Mo, Ru, Rh, Pd transversal EPMA quantitative profiles, sample A-EPMA
Figure 5 : Zr and Ba transversal EPMA quantitative profiles, sample A-EPMA In addition, EPMA were performed on the precipitate observed in the reduced-porosity region, along line scan 2 (Figure 6). A quantitative analysis was also performed on another important metallic precipitate located in the moderated porosity region in the center of the
0,00 0,05 0,10 0,15 0,20 0,25 0,30 0,35 0 2 4 6 8 10 12 14 16 18 20 0 1 000 2 000 3 000 4 000 5 000 6 000 7 000 8 000 B a (w t% ) Z r (w t% ) Distance (µm) Zr (wt%) Ba (wt%)
6 pellet. The results are presented on Figure 7. The composition in each FP in the centre is uniform in the whole precipitate and equal to 45.4 wt% for Ru, 23.6 wt% for Mo, 5.5 wt% for Rh, 1.8 wt% for Pd and 23.7 wt% for Tc. These values are consistent with the ones calculated from Figure 4. However, the precipitate in the periphery exhibits a different composition: 52.8 wt% for Ru, 10.5 wt% for Mo, 2.5 wt% for Rh, 1.1 wt% for Pd and 30 wt% for Tc.
Figure 6: SEM-SE and Zr, Ba, Ru, Mo, and Tc X-ray maps, Zone A’ Sample A Zr
Ba Ru
7 Figure 7: Mo, Ru, Rh, Pd and Tc quantitative analyses at the periphery (left) and in the
center (right) of Sample A
4 DISCUSSION
The results presented above are discussed in this section according to three main axes: (1) metallic precipitates evolution, (2) oxide phase evolution and (3) comparison with the first part of the article in terms of FP released fractions [11]. Again, the intermediate state sample composed of an irradiated fuel pellet in its original M5 cladding selected from the same UO2
father rod as the VERDON-1 sample was used to complete the analysis of the results [12]. It was submitted to an annealing treatment consisting in two temperature plateaus at 300 and 1200°C during 15 minutes and a third one at 1500°C during 25 minutes under reducing atmosphere (Ar + 4% H2). The test was carried out in the MERARG experiment loop [17].
After the annealing test, the sample was embedded in an epoxy resin and polished down to half his diameter.
4.1 Metallic FP
Many metallic precipitates have been observed in both samples (father rod and VERDON-1), composed of Ru, Mo, Tc, Pd, and Rh. This kind of precipitates, known as the white inclusions, is common in irradiated fuels [18].
The precipitates sizes (ECD) varied from of 0.8 µm in the elevated porosity region to 1.1 µm in the moderated porosity one. Big-size metallic precipitates were observed in the reduced porosity region, some of which presented ECD above 160 µm. This difference in ECD could be due to an improved diffusivity of the FP in a liquid medium, composed of melted ZrO2 or a solution of (U-Zr)O2 [12]. This would have allowed the precipitates to move
and coalesce forming the big precipitates. The concentrations of Ru, Mo, Tc, Pd and Rh were uniform in the whole precipitate but differed from one precipitate to another, depending on their location in the sample. The highest concentration of Mo and Pd was found in precipitates located close to the center of the pellet. This could be attributed to its location which would have hindered FP to diffuse until the surface of the pellet and to release.
The composition ratios observed in these precipitates are consistent with the releases measured during the VERDON-1 test. Ru and Mo released fractions were 2% and 65%
0 10 20 30 40 50 60 0 5 10 15 20 25 C o m p o si ti o n ( w t% ) Distance (μm) Mo Ru Rh Pd Tc 0 10 20 30 40 50 0 1 2 3 4 5 6 C o m p o si ti o n ( w t% ) Distance (μm) Mo Ru Rh Pd Tc
8 respectively, which agrees with the low Mo/Ru mass ratio measured in the periphery of the sample. Moreover, Pd is known to be extensively released at high temperatures whatever the atmosphere conditions are [7]. This also justifies its low concentration. Regarding Rh, its release was generally low but it also presented a low fission yield so its concentration in the precipitates cannot be directly linked to its behavior during the test. Tc concentration was elevated considering that it is a semi-volatile FP which should have been released in the VERDON-1 conditions. Given that the composition of Tc was calculated by subtraction, the high values observed could be related to the embedding components like Bi or to the presence of other FP not studied here.
4.2 Oxide Phase
The oxide phase, generally referred to as the perovskite or grey phase, is commonly described as (Cs, Ba, Sr)(Zr, U, Mo, RE)O3 (RE = Rare Earth). This phase has been observed
in irradiated Fast Breeder Reactor (FBR) fuel pins [18]. Nevertheless, this was not the configuration observed in the father rod sample. Indeed, there was no association between Zr and Ba even in the HBS zone though many precipitates containing Ba or Cs were observed. This could be explained by the operating fuel temperatures which are lower in a LWR (between 350 at the periphery and 1100°C in the center of the pellet) than in a FBR fuel (from 600 to 2000°C).
To verify this hypothesis, SIMS observations were made on the intermediate state sample. X-ray maps of Ba (green) and Zr (red) on Figure 8 indicate a clear association between these two FP (yellow), in particular in the fuel cladding. However some precipitates containing either Ba or Zr are also found.
Figure 8: Ba (green) and Zr (red) X-ray maps of the intermediate state sample periphery (left) and center (right), the association between Zr and Ba is in yellow
Regarding the VERDON-1 post-test analyses, only a few precipitates containing Ba were found. This is not surprising since 80% of Ba was released during the VERDON-1 test. Again, no association between Ba and Zr was observed, nor between Ba and Cs, the latter being completely released during the test. Thus, Ba has another chemical form than BaZrO3, possibly BaO. However, the absence of oxide precipitates in the X-ray maps does not allow the confirmation of its chemical form. These results would tend to indicate that a dissociation
9 of BaZrO3 took place between 1500°C and 2600°C. These observations are consistent with
what was observed in simulated fuel-FP systems [19].
Regarding Ce and Sr which are considered as low-volatile FP, the lack of precipitates could be due to their dissolution in the UO2 matrix. Indeed, according to [20], CeO2, Ce2O3
and SrO are highly miscible in UO2, contrary to BaO. The first results of X-ray diffraction
seem to be consistent with this assumption since it was observed that the lattice parameter of UO2 generally decreases as FP are dissolved in the matrix [21]. Indeed, the mean lattice
parameter of fluorite in the VERDON-1 sample has been calculated to be 5.4683 ± 0.0003 Å which is a little smaller than the theoretical value for stoichiometric UO2 (5.4705 Å [22]).
4.3 Fission products release
Until now, the released fractions measured for one γ-emitter isotope was assumed to be representative of the behavior of the element. The main idea of the following methodology is to extend the database to non γ-emitter FP behavior. To this end, a systematic comparison between FP releases given by γ-spectrometry and by post-test analyses has to be done.
Calculations based on quantitative analyses have been done in order to give an order of magnitude of FP released fractions after the VERDON-1 test (Eq. 1). First the quantities of FP found in the different regions (i, j) of the fuel have been assessed before and after the VERDON-1 test (mean values from EPMA results). The different regions contribution to the total surface has then been determined thanks to image analyses. The quantity of each FP remaining after the VERDON-1 test has finally been compared to the initial one, giving an approximate released fraction.
% = 100 − ∑ (% ! %"#$ % )
'( ) * ∑ (%,+ + ! %"#$ % +) - 100. Eq. 1
Three zones of interest have been determined in the father rod corresponding to the periphery of the fuel pellet (HBS structure), the central area and the metallic precipitates. The quantity of each FP has been determined thanks to EPMA and integrated over two wreaths corresponding to the periphery and the central area of the pellet.
The quantities of Mo, Ru and Pd in the metallic precipitates have been taken directly through EPMA measurements. The contribution of metallic precipitates to the total surface of the pellet has been determined through image analyses. Their density was approximated to be equal to the one of the fuel (95%dth). This is consistent with the value of the density of Mo-Ru-Rh-Pd alloy given in [23].
All the information needed for the calculation of the released fraction of each FP is presented in Table 1 for the father rod and in Table 2 for the VERDON-1 sample.
10 Table 1: Summary of the input data needed to calculate the released fraction of each FP,
father rod Stot = 112 mm² Periphery (0-800 µm) Central area (800-4085 µm) Metallic precipitates %Stot 20 77 3 Pu (wt%) 1.60 1.04 - Nd (wt%) 0.85 0.69 - Zr (wt%) 0.71 0.59 - Xe (wt%) 0.74 0.7 - Cs (wt%) 0.46 0.35 - Ba (wt%) 0.29 0.20 - Mo (wt%) 0.67 0.56 1.75 Ru (wt%) 0.55 0.41 1.25 Pd (wt%) 0.42 0.28 0.75
Table 2: Summary of the input data needed to calculate the released fraction of each FP and calculated released fractions, VERDON-1 sample
Stot =107 mm² Elevated porosity region Moderated + reduced porosity regions Metallic precipitates Calculated released fraction (%) %Stot 57 33 0.6 - Pu (wt%) 1.4 1 - 4 Nd (wt%) 0.85 0.7 - 3 Zr (wt%) 18 0.5 - - Xe (wt%) 0 0 - 100 Cs (wt%) 0 0 - 100 Ba (wt%) 0 0.15 - 78 Mo (wt%) 0 0 16.5 85 Ru (wt%) 0 0 48.5 40 Pd (wt%) 0 0 1.25 98
At this step, different approximations have to be made on the VERDON-1 sample in order to perform these calculations:
• The reduced and moderated porosity regions were gathered leading to an overestimated amount of Pu and Nd in the VERDON-1 sample;
• The quantitative results obtained on sample A were extended to sample B; • An image analysis was used to determine the surface contribution of each
11 • The quantities of each FP taken for the calculation are averaged on each zone
of interest.
As an example, Pu is found in two areas of the father rod and the VERDON-1 samples, in different concentrations. The following calculations enable the determination of the released fraction:
/012= 3100 -20 100 +1.6 100 -77 1.04100: - 112 = 1.26
/0;<= 3100 -33 100 +1 100 -57 100: - 107 = 1.21 1.4
% = 100 − 3/0/0;<
12 - 100: ≈ 4 %
Released fractions of 4% and 3% were obtained respectively for Pu and Nd. The released fractions measured by γ-spectrometry for these two FP were inferior to 1%, which is not aberrant compared to the calculated values.
Concerning Zr, it was not possible to obtain a consistent result given that the cladding diffused into the fuel during the test.
Xe and Cs quantitative analyses clearly demonstrate that these FP were completely released during the test. This is in agreement with the measured released fractions of 100% for these two FP. Nevertheless, EPMA gives only results concerning FP dissolved in the matrix so maybe a very small quantity of Xe and Cs is still present in pores.
A released fraction of 78% has been calculated for Ba, which is not far from the one measured during the VERDON-1 test (77%).
Two types of metallic precipitates containing Ru, Mo and Pd were found in the VERDON-1 sample, differing by their composition. Unfortunately, it was not possible to quantify the number of each type. Thus, the calculation has been made with a mean composition of 48.5 wt% of Ru, 16.5 wt% of Mo and 1.25 wt% of Pd. The resulting released fractions are 40% for Ru, 85% for Mo and 98% for Pd. Again, these results seem to be consistent with the measurements for Mo (65-70% for Mo).
The release fractions calculated thanks to post-test analyses are in good agreement with
γ-spectrometry measurements as far as the release trends are respected for each class of volatility. The high release calculated for Mo and Ru could be due to the average composition of the precipitates taken for the calculations. However, the uncertainty on the calculations does not allow a conclusion. Finally, this is a promising methodology which has to be developed further to improve the accuracy of the calculations. To achieve this objective, a statistic study has to be made during the quantitative characterizations, notably concerning metallic precipitates.
12
5 CONCLUSION
The VERDON-1 test was devoted to high burn-up UO2 fuel behavior and FP release
under reducing conditions at very high temperature (up to 2610°C). The sample recovered after the VERDON-1 test was characterized using OM, SEM and EPMA techniques. An intermediate test has been performed under reducing atmosphere up to 1500°C in the MERARG experimental loop. An irradiated fuel sample, obtained from the same father rod as the VERDON-1 sample was used in this test and has been characterized notably thanks to SIMS. This was the first time that these types of analyses were performed at the CEA Cadarache on a sample submitted to severe accidents conditions.
Characterizing the chemical phases in the fuel and their evolution allows understanding both the fuel and FP behavior during a severe accident. These results are very important for the improvement of mechanistic codes (such as the MFPR code developed by the IRSN) [24] which would enable a better assessment of the source term for a severe accident. This third part of the article “Fission Products and nuclear fuel behavior under severe accident conditions” focus on FP speciation into the fuel.
Concerning the white inclusions, the analyses confirmed the presence of Ru, Mo, Tc, Pd, Rh precipitates in the three samples. The different ratios observed in the precipitates located at the periphery and at the center of the VERDON-1 sample were attributed to FP releases. Indeed, the pores interconnection that seems to take place around 1500°C created paths for gaseous FP to diffuse until they are released from the fuel. It is thus assumed that Mo and Pd would have passed to gaseous state and diffused through the interconnected pores [12].
The presence of Ba precipitates in LWR normal operation conditions has been refuted. Indeed, no oxide precipitates as described in the literature were observed, even at very high burn-up (150 GWd.t-1 at the periphery). However, this kind of precipitates appears at higher temperature (between 1100 and 1500°C) as observed in the intermediate state sample and in FBR fuels. At an advanced stage of a severe accident, again no association between Ba and Zr was observed. This could be due to the dissociation of the perovskite phase, Ba being released at high temperature under the reducing atmosphere.
Finally, a methodology to assess the release fractions of each FP thanks to post-test characterization (notably EPMA results) has been implemented. The release fractions obtained have been compared to the ones measured thanks to γ-spectrometry. The release trends are respected for each class of volatility, except in the case of Ru. This way to determine FP release after a sequence representative of a severe accident is thus promising for it could enable extending the database to non γ-emitters FP behavior. Nevertheless, it should be developed further to improve the accuracy on the determination of the release fractions.
13
AKNOWLEDGEMENT
This work was performed in the framework of a collaboration including the CEA, EdF and IRSN. The authors are indebted to P. Bienvenu, I. Roure, T. Blay, L. Brunaud, P. Delion, L. Fayette, K. Hanifi, S. Reboul and I. Zacharie-Aubrun working in the CEA LECA-STAR hot-cells facility at Cadarache, for their huge contribution to this work. We also greatly thank S. Clément, M. Pontillon and G. Volle for their work on the MERARG loop. A special thanks to J. Noirot for his help on image analyses.
REFERENCES
[1] M. Schwarz, G. Hache, and P. von der Hardt, “PHEBUS FP: a severe accident research programme for current and advanced light water reactors,” Nuclear Engineering and Design, vol. 187, no. 1, pp. 47–69, Jan. 1999.
[2] R. A. Lorenz and M. F. Osborne, “A summary of ORNL fission product release tests with recommended release rates and diffusion coefficients,” Nuclear Regulatory Commission, Oak Ridge National Lab., NUREG/CR--6261, 1995.
[3] Z. Lui, D. S. Cox, R. S. Dickson, and P. Elder, “A summary of CRL fission product release measurements from UO2 samples during post-irradiation annealing (1983-1992),” COG-92-377, 1994.
[4] A. Hidaka, “Outcome of VEGA Program on Radionuclide Release from Irradiated Fuel under Severe Accident Conditions,” Journal of Nuclear Science and Technology, vol. 48, no. 1, pp. 85–102, Jan. 2011.
[5] B. J. Lewis, R. Dickson, F. C. Iglesias, G. Ducros, and T. Kudo, “Overview of experimental programs on core melt progression and fission product release behaviour,” Journal of Nuclear Materials, vol. 380, no. 1–3, pp. 126–143, Oct. 2008.
[6] J. P. Leveque, B. Andre, G. Ducros, G. Le Marois, and G. Lhiaubet, “The HEVA experimental program,” Nuclear Technology, vol. 108, no. 1, pp. 33–44, 1994.
[7] Y. Pontillon, G. Ducros, and P. P. Malgouyres, “Behaviour of fission products under severe PWR accident conditions VERCORS experimental programme—Part 1: General description of the programme,” Nuclear Engineering and Design, vol. 240, no. 7, pp. 1843–1852, Jul. 2010.
[8] Y. Pontillon and G. Ducros, “Behaviour of fission products under severe PWR accident conditions: The VERCORS experimental programme—Part 2: Release and transport of fission gases and volatile fission products,” Nuclear Engineering and Design, vol. 240, no. 7, pp. 1853–1866, Jul. 2010.
[9] Y. Pontillon and G. Ducros, “Behaviour of fission products under severe PWR accident conditions. The VERCORS experimental programme—Part 3: Release of low-volatile fission products and actinides,” Nuclear Engineering and Design, vol. 240, no. 7, pp. 1867–1881, Jul. 2010.
[10] B. Clement, “The Phebus Fission Product and Source Term International Programmes,” in Proceedings of the Annual Meeting on Nuclear Technology - Jahrestagung Kerntechnik - Tagungsbericht Proceedings, 2006.
[11] Y. Pontillon, E. Geiger, C. Le Gall, S. Bernard, A. Gallais-During, P. P. Malgouyres, E. Hanus, and G. Ducros, “Fission products and nuclear fuel behavior under severe accident conditions - Part 1: Main lessons learnt from the first VERDON test,” Journal of Nuclear Materials, Submitting.
[12] E. Geiger, C. Le Gall, A. Gallais-During, Y. Pontillon, J. Lamontagne, E. Hanus, and G. Ducros, “Fission products and nuclear fuel behavior under severe accident conditions -
14 Part 2: Fuel behavior in the VERDON-1 sample,” Journal of Nuclear Materials, Submitting.
[13] G. Ducros, S. Bernard, M. P. Ferroud-Plattet, and O. Ichim, “Use of Gamma spectrometry for measuring fission product releases during a simulated PWR severe accident: Application to the VERDON experimental program,” presented at the ANIMA, 2009, pp. 1–7.
[14] A. Gallais-During, J. Bonnin, P.-P. Malgouyres, S. Bernard, Y. Pontillon, E. Hanus, and G. Ducros, “VERDON Laboratory : Performances of the Experimental LWR Severe Accident Device and Fisrt Results of Fission Products Release on High Burn-up UO2 fuel,” presented at the 21st International Conference Nuclear Energy for New Europe, Ljubjana, 2012.
[15] A. Gallais-During, J. Bonnin, P.-P. Malgouyres, S. Morin, S. Bernard, B. Gleizes, Y. Pontillon, E. Hanus, and G. Ducros, “Performance and first results of fission product release and transport provided by the VERDON facility,” Nuclear Engineering and Design, vol. 277, pp. 117–123, Oct. 2014.
[16] G. Ducros, P. P. Malgouyres, M. Kissane, D. Boulaud, and M. Durin, “Fission product release under severe accidental conditions: general presentation of the program and synthesis of VERCORS 1–6 results,” Nuclear Engineering and Design, vol. 208, no. 2, pp. 191–203, Sep. 2001.
[17] Y. Pontillon, J. Bonnin, E. Addes, J. Cochaud, J. Piquemal, M. Pontillon, and C. Roure, “Fission gas release under normal and off-normal conditions: New analytical device implemented at the CEA Cadarache,” presented at the European Working Group “Hot Laboratories and Remote handling” Plenary Meeting, Petten, Netherlands, 2005.
[18] H. Kleykamp, “The chemical state of the fission products in oxide fuels,” Journal of Nuclear Materials, vol. 131, no. 2–3, pp. 221–246, 1985.
[19] K. Masumichi, S. Masakazu, and N. Kenji, “Phase study on solid fission products, Ba, Sr and Zr in oxide fuel,” Journal of Nuclear Materials, vol. 51, no. 1, pp. 90–94, May 1974.
[20] H. Kleykamp, “The solubility of selected fission products in UO2 and (U, Pu)O2,” Journal of Nuclear Materials, vol. 206, no. 1, pp. 82–86, Nov. 1993.
[21] J. Spino and D. Papaioannou, “Lattice parameter changes associated with the rim-structure formation in high burn-up UO2 fuels by micro X-ray diffraction,” Journal of Nuclear Materials, vol. 281, no. 2–3, pp. 146–162, Oct. 2000.
[22] L. Lynds, W. A. Young, J. S. Mohl, and G. G. Libowitz, “X-Ray and Density Study of Nonstoichiometry in Uranium Oxides,” in Nonstoichiometric Compounds, vol. 39, 0 vols., American Chemical Society, 1963, pp. 58–65.
[23] S. Yamanaka and K. Kurosaki, “Thermophysical properties of Mo–Ru–Rh–Pd alloys,” Journal of Alloys and Compounds, vol. 353, no. 1–2, pp. 269–273, Apr. 2003.
[24] M. S. Veshchunov, V. D. Ozrin, V. E. Shestak, V. I. Tarasov, R. Dubourg, and G. Nicaise, “Development of the mechanistic code MFPR for modelling fission-product release from irradiated UO2 fuel,” Nuclear Engineering and Design, vol. 236, no. 2, pp. 179–200, Jan. 2006.