HAL Id: hal-02014399
https://hal.archives-ouvertes.fr/hal-02014399
Submitted on 11 Feb 2019
HAL is a multi-disciplinary open access
archive for the deposit and dissemination of
sci-entific research documents, whether they are
pub-lished or not. The documents may come from
teaching and research institutions in France or
abroad, or from public or private research centers.
L’archive ouverte pluridisciplinaire HAL, est
destinée au dépôt et à la diffusion de documents
scientifiques de niveau recherche, publiés ou non,
émanant des établissements d’enseignement et de
recherche français ou étrangers, des laboratoires
publics ou privés.
Atomic structure of Pt nanoclusters supported by
graphene/Ir(111) and reversible transformation under
CO exposure
Dirk Franz, Nils Blanc, Johann Coraux, Gilles Renaud, Sven Runte, Timm
Gerber, Carsten Busse, Thomas Michely, Peter Feibelman, Uta Hejral, et al.
To cite this version:
Dirk Franz, Nils Blanc, Johann Coraux, Gilles Renaud, Sven Runte, et al.. Atomic structure of Pt
nanoclusters supported by graphene/Ir(111) and reversible transformation under CO exposure.
Phys-ical Review B, American PhysPhys-ical Society, 2016, 93 (4), pp.045426. �10.1103/PhysRevB.93.045426�.
�hal-02014399�
published as:
Atomic structure of Pt nanoclusters supported by
graphene/Ir(111) and reversible transformation under CO
exposure
Dirk Franz, Nils Blanc, Johann Coraux, Gilles Renaud, Sven Runte, Timm Gerber, Carsten
Busse, Thomas Michely, Peter J. Feibelman, Uta Hejral, and Andreas Stierle
Phys. Rev. B 93, 045426 — Published 26 January 2016
Atomic Structure of Pt nanoclusters supported by graphene/Ir(111) and reversible
transformation under CO exposure
Dirk Franz,1, 2, 3 Nils Blanc,4, 5 Johann Coraux,4 Gilles Renaud,5 Sven Runte,6 Timm Gerber,7, 6
Carsten Busse,6 Thomas Michely,6 Peter J. Feibelman,8 Uta Hejral,1, 2 and Andreas Stierle1, 2
1Deutsches Elektronen-Synchrotron DESY, Notkestr. 85, D-22603 Hamburg, Germany
5
2
Fachbereich Physik, Universit¨at Hamburg, Jungiusstraße 9, D-20355 Hamburg, Germany
3Fachbereich Physik, Universit¨at Siegen, Walter-Flex-Str. 3, D-57072 Siegen, Germany
4Institut N ´EEL, CNRS and Universit´e Joseph Fourier, BP166, F-38042 Grenoble Cedex 9, France
5
CEA-UJF, INAC, sp2M, 17 rue des Martyrs, 38054 Grenoble Cedex 9, France
6
II. Physikalisches Institut, Universit¨at zu K¨oln, Z¨ulpicher Str. 77, 50937 K¨oln, Germany
10
7Peter Gr¨unberg Institut, Forschungszentrum J¨ulich, 52425 J¨ulich, Germany
8
Sandia National Laboratories, Albuquerque, New Mexico 87185-1415, USA (Dated: January 4, 2016)
We have investigated the atomic structure of graphene/Ir(111) supported platinum clusters with on average fewer than 40 atoms by means of surface x-ray diffraction (SXRD), grazing incidence 15
small angle x-ray scattering (GISAXS) and normal incidence x-ray standing waves (NIXSW) mea-surements, in comparison with density functional theory calculations (DFT). GISXAS revealed that the clusters with 1.3 nm diameter form a regular array with domain sizes of 90 nm. SXRD shows that the 1-2 monolayer high, (111) oriented Pt nanoparticles grow epitaxially on the graphene sup-port. From the combined analysis of the SXRD and NIXSW data, a 3D structural model of the 20
clusters and the graphene support can be deduced which is in line with the DFT results. For the clusters grown in ultra high vacuum the lattice parameter is reduced by (4.6 ± 0.1) % compared to bulk platinum. The graphene layer undergoes a strong Pt adsorption induced buckling, caused by a re-hybridisation of the carbon atoms below the cluster. In-situ observation of the Pt clusters in
CO and O2 environments revealed a reversible change of the clusters’ strain state while successively
25
dosing CO at room temperature and O2 at 575 K, pointing to a CO oxidation activity of the Pt
I. INTRODUCTION
Platinum is widely used as a catalyst material for exhaust gas cleaning and hydrogen activation, as well as for oxygen reduction in low-temperature proton exchange membrane (PEM) fuel cells [1, 2]. In addition, it is employed
30
in oxygen sensors to optimize the oxygen / fuel composition for combustion engines [3]. In all these applications, Pt is present in the form of finely dispersed, supported nanoparticles, mainly to increase the surface area of the active catalyst. To reduce the amount of precious Pt catalyst material, it is therefore of interest to reduce the catalyst nanoparticle size, while maintaining activity and stability of the catalyst. When reaching the 1-2 nm size regime, a number of fundamental questions arise: 1. How large is the confinement induced compression of the nanoparticles
35
and how does it modify the gas adsorption properties? 2. How does the modified electronic structure influence the adsorption properties? 3. What is the explanation for a maximum of the size dependent activity (typically in the 1-2 nm size regime), which is controversially discussed in literature [1, 4–6]? These questions directly relate to the atomic structure of small nano-objects in the 1-2 nm size regime, which is a challenge for different experimental techniques: In conventional powder x-ray diffraction the finite particle size gives rise to broad overlapping reflections
40
and in transmission electron microscopy small nanoparticles are often found to be unstable in the electron beam [7]. In extended x-ray absorption fine structure measurements (EXAFS), the local structure of nanoparticles is readily accessible; it is however much more challenging to address their surface structure, which is involved in catalytic reactions [8].
As we have demonstrated recently for iridium nanoclusters, supported graphene layers represent a very promising
45
nano-template for the structural investigation of small nanoparticles in the 1-2 nm size regime [9, 10]. Graphene forms a hill and valley moir´e on various metallic substrates, typically with a 2.5 nm periodicity and specific favored sites for metal cluster adsorption [11–17]. As shown by scanning tunneling microscopy (STM), the graphene layer on Ir(111) represents an ideal template to grow regular, high density nanoparticle lattices from catalytically active metals such as Ir and Pt with particle sizes < 2 nm and uniform size distribution [18, 19]. Using surface x-ray diffraction (SXRD)
50
we demonstrated that Ir clusters on graphene / Ir(111) form two-dimensional crystalline lattices, which in turn allow a 3D crystallographic investigation of the clusters themselves [9, 10].
As revealed by STM, [19] platinum cluster formation at room temperature (RT) only occurs in the hcp regions of the graphene moir´e unit cell, wherein carbon atom hexagons are centered above the iridium supports hcp sites. The binding mechanism of the clusters is discussed in terms of re-hybridization; the sp2-like bonding of the carbon atoms
55
at adsorption sites changes to an sp3-like bonding, so that half of the carbon atoms bind to the iridium substrate and half of them bind to the cluster atoms above, resulting in a significant restructuring of the graphene layer [20–22]. This bonding mechanism results in a cluster lattice with a certain robustness, which is beneficial for a broad spectrum of applications, e.g. catalysis. The structure model determined for Ir clusters on graphene / Ir(111) confirms this picture, whereas an experimental verification of such a model by structure-sensitive techniques for Pt / graphene /
60
Ir(111) is still lacking, as well as a rigorous comparison with the DFT results in local density approximation (LDA). For future investigations it is instructive to know if such less costly LDA calculations can correctly describe the atomic structure of systems with such large unit cells containing hundreds of atoms.
Here we present the atomic structure of Pt nanoparticle arrays on graphene / Ir(111) as obtained from surface x-ray diffraction (SXRD), grazing incidence small angle x-ray scattering (GISAXS) and normal incidence x-ray standing
65
waves (NIXSW) in comparison to DFT calculations. We characterized Pt nanoparticles with diameters as small as 1.3 nm after deposition as well as after CO and O2 exposures. The GISAXS data analysis benefits substantially from
the long range order of the Pt clusters and gives direct access to morphology and diameter of the probed particles. Knowing the arrangement of the underlying C atoms is important to obtain an accurate understanding of the cluster structure, because of their non-negligible contribution to the scattering signal. This is particularly true for the small
70
clusters investigated in the study presented here. We employed therefore NIXSW measurements as complementary technique delivering crucial information on the height distribution of the carbon atoms within the graphene layer. Through spatial tuning of the maximum amplitude position of the x-ray standing wave field, the measured intensity of the carbon 1s photoelectrons gives a value for the graphene mean height and its buckling-induced variation [23]. By virtue of chemical sensitivity of NIXSW measurements [24], the height of the Pt clusters with respect to the Ir(111)
75
planes can also be directly determined. In our earlier study of Ir clusters on graphene/Ir(111), we could not extract structural information upon Ir clusters from NIXSW, because XPS signals from the clusters and the Ir(111) substrate overlapped, which is is not an issue for Pt.
Thus, we have found that Pt clusters on graphene / Ir(111) form a 2D periodic crystalline superlattice similar to that known for Ir clusters on graphene / Ir(111). The Pt clusters themselves undergo a significant lateral contraction
80
of the atomic spacings by ∼ 5% and induce a substantial buckling of the graphene layer, both in line with the DFT calculations. Under CO exposure at room temperature, we find that the particles undergo a change of shape and strain state, where the particles get more three dimensional and their average in-plane lattice constant gets further reduced. These structural changes are observed to be reversible by O2exposure at 575 K, pointing to catalytic activity for CO
3 oxidation of the clusters. The paper is organized as follows: In section II the details concerning sample preparation,
85
x-ray measurements and data analysis are given. In section III results are presented on the atomic structure of Pt clusters with 1.3 nm diameter, as deduced from SXRD, GISAXS and NIXSW measurements, and they are compared to DFT calculations. In section IV CO and O2adsorption induced structural changes are discussed based on SXRD
and GISAXS data. Finally, in section V a summary is given and conclusions are drawn.
II. EXPERIMENTAL DETAILS
90
SXRD and GISAXS measurements were performed in the UHV system of the surface diffraction beamline ID03/ESRF (Grenoble, France) [25] with a base pressure below 10−9 mbar. Prior to graphene growth for the
SXRD experiments the Ir(111) single crystal surface was cleaned by means of 650 eV Ar sputtering at p(Ar) = 5 · 10−5 mbar with subsequent annealing to 1275 K in 2 · 10−7 mbar O2 environment. Graphene was grown in two
steps: First ethylene (C2H4) was adsorbed at RT with subsequent flash annealing to 1475 K in UHV leading to well
95
oriented graphene islands [26]. Afterwards the temperature was decreased to 1175 K and a closed graphene layer was grown via decomposition of ethylene for 20 min at p(C2H4) ∼ 2 · 10−7 mbar. Regular cluster arrays were grown
by deposition of 0.2 ML (0.1) monolayer (ML) Pt on top of the graphene/Ir(111) surface at room temperature with an e-beam evaporator. One ML Pt corresponds to one Pt(111) layer. The x-ray diffraction (XRD) experiments were performed at a photon energy of 18 keV. SXRD data were collected in horizontal z-axis geometry with a
max-100
ipix detector. Structure factors were extracted from rocking scans with rotation axis normal to the sample surface with the use of standard correction factors [27]. SXRD data were fitted using a hexagonal surface unit cell with a = b = 24.4323 ˚A, c = 6.6497 ˚A, α = β = 90◦, γ = 120◦ and a structure model containing a Pt cluster on top of
10 × 10 carbon unit cells sitting commensurately on top of 9 × 9 Ir atoms as input for the software rod [28]. The reciprocal lattice is given in Fig. 1. Note that Pt exhibits a slightly expanded room temperature bulk lattice constant
105
of a=3.924 ˚A, as compared to Ir (a=3.839 ˚A). GISAXS data were collected with a frelon two-dimensional camera. To suppress Ir fluorescence background detectors were protected by a 1 mm thick Al filter. The NIXSW [24] experiments were performed at the ESRF beam line ID32 [29]. The standing wave was excited using the Ir(111) reflection at an incident photon energy of 2801 eV. An hemispherical electron analyzer (Phoibos 225) mounted perpendicular to the incoming x-ray beam with an energy resolution better than 15 meV was used to detect photoelectrons. The Ir(111)
110
surface was cleaned and graphene was grown as described above. 0.1 ML Pt were deposited on top of the graphene with an e-beam evaporator.
FIG. 1. (Color online) Map of reciprocal space: The (1,0), (2,0) and (1,1) rods were measured with GISAXS (green circles). The lines at (9,9) and (9,9) indicate the first order crystal truncation rods of Ir(111), graphene rods resulting from carbon -115
carbon spacing are located at (10,0) and (10,-10) (blue circles), grey circles indicate positions of additional cluster lattice rods which were measured.
III. PT CLUSTER ATOMIC STRUCTURE 120
In this section we address the atomic structure of Pt clusters on graphene / Ir(111) after deposition of 0.2 ML Pt at room temperature. From GISAXS measurements we determine the particle morphology and perfection of the nanoparticle lattice independent of its crystalline structure. GISAXS measurements were conducted in three dimensions for freshly deposited Pt clusters, by measuring maps of the scattered intensity along the in-plane and perpendicular components of the scattering vector (Qk, Q⊥), in a large set of azimuthal orientations with rotation
125
axis perpendicular to the surface (varied by azimuthal angle steps of 0.5◦ across a 180◦ range). The in-plane two-dimensional (2D) map of the intensity versus azimuthal angle at small Q⊥ (Fig. 2(a)) reveals a reciprocal lattice
with well-defined peaks. These maps are typical of well-ordered 2D cluster lattices [30, 31]. The radial separation between these peaks translates into a 2.48 nm lattice parameter, which can be approximated by clusters pinned onto a graphene/Ir(111) moir´e with 10 carbon rings on nine Ir atoms. The peaks have constant radial width corresponding
130
to a domain size of ∼90 nm. The quality of the nanoparticle lattice appears to be limited by the graphene/Ir(111) moir´e pattern driving its formation which exhibits a similar domain size [32]. Fig. 2 (b) shows the 2D diffraction pattern for the (1,0) azimuth, where the second order reflection is clearly visible. The slowly decaying intensity along the Q⊥ ((Fig. 2(e,f))) points to flat clusters, no thicker than two atomic layers.
The GISAXS data were fitted using the IsGISAXS program [33], with a hexagonal lattice model limited by the
135
domain size, occupied by cylindrical particles characterized by a 20% Gaussian distribution of radii (as a rough approximation of the Poissonian distribution expected for cluster lattices on graphene/Ir(111)[18]). Good fits to the data were obtained along Qk, Q⊥, and the azimuthal angle (red points in Fig. 2 (c),(e),(f) and lower part in Fig. 2
(a)). The cluster lattice parameter is determined to 2.48 nm. The mean radius of the particles is determined to 6.4 ˚A and the average height to 3.5 ˚A, indicating 1-2 layer high Pt clusters in line with STM results for this coverage [19].
140
The background in Fig. 2 (c), which is not well-reproduced by the fit, arises from a small amount of uncorrelated Pt nanoparticles which do not sit on the regular lattice sites of the graphene / Ir moir´e. Fig. 2 (d) demonstrates the sensitivity of GISAXS to the particle diameter: the curve simulated for a larger nanoparticle diameter exhibits a shift of the single nanoparticle structure factor to lower Q values leading to a corresponding larger decay of the second order satellite intensity.
145
In the next step, SXRD and NIXSW results were combined with the GIXAXS results to obtain the full atomic structure of the Pt nanoparticle superlattice on graphene / Ir(111). NIXSW measurements deliver chemically-resolved structural information, which allows us here to independently determine the distance of the Pt clusters and the graphene layer from the Ir(111) substrate. NIXSW experiments reveal the coherent position P(111) and the coherent
fraction F(111) of graphene and Pt clusters with respect to the Ir surface [23]. P(111) is linked to the average height
150
while F(111) is a quantity associated with the height spread around the determined average height. 0.1 ML Pt was
deposited on a closed graphene layer, which results in single and double layer Pt clusters [19, 34]. Figure 3 summarizes the measured quantities together with the fit of the NIXSW curves. In Figs. 3(a,b) the spectra of the platinum 3d3/2
core level at 2202 eV and the carbon 1s core level at 284 eV are shown. The data were recorded at an x-ray photon energy of 2810 eV and the fit using Gaussians leads to the energy dependent photoelectron yield in Fig. 3(c). The
155
NIXSW parameters of the platinum atoms are determined to P(111) = 0.10 ± 0.02 and F(111) = 0.49 ± 0.05. As
mentioned before there are mainly single and double layer Pt clusters present, so that P(111) translates to an average
cluster distance to the Ir(111) substrate of hpt = (4.65 ± 0.02) ˚A. The coherent position of the graphene layer
is determined to P(111) = 0.52 ± 0.01, which is almost the same value as for bare graphene on Ir(111) [23]. The coherent fraction is F(111) = 0.33 ± 0.04 and reduced compared to the value of bare graphene [23]. The decrease of
160
the coherent fraction can be explained as follows: The carbon atoms below the platinum clusters are pinned to the Ir(111) substrate associated with an increase of the in-plane carbon - carbon distances while the uncovered carbon atoms of the moir´e cell relax strain in a stronger buckling. The conversion of the coherent position to an average height is much more difficult than on bare graphene, because half of the carbon atoms below the platinum clusters are closer to the substrate than the Ir(111) interlayer distance of d = 2.217 ˚A. The majority of the carbon atoms are
165
in between one and two Ir(111) interlayer distances. Depending on the amplitude of the graphene buckling there may also be some carbon atoms residing higher than two Ir(111) interlayer distances. To recapitulate we have to model the graphene layer consistent with the measured P(111) and F(111)and then we can derive the average carbon height.
This refinement was done during analysis of SXRD data as presented in the following section.
In the following we discuss the SXRD data analysis after 0.2 ML Pt deposition, using the GISAXS and NIXSW
170
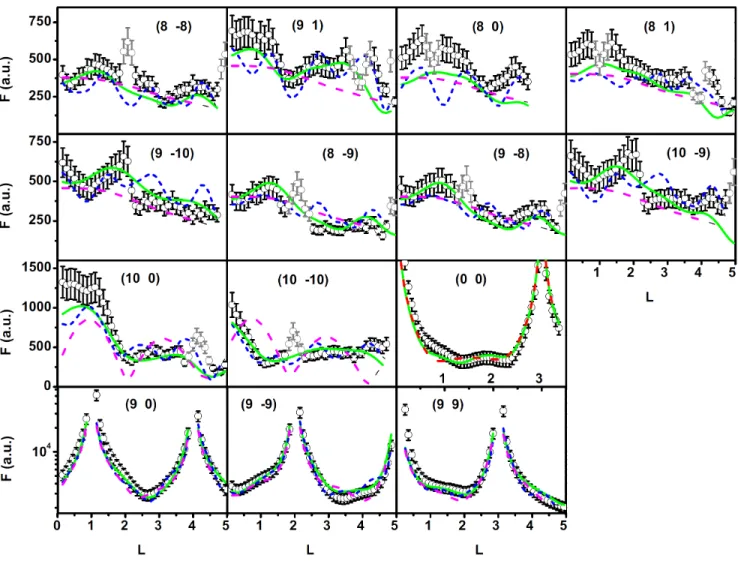
results as an input. The SXRD data can be divided in 4 groups (compare also Figs. 1 and 4), which provide different information: at the fundamental position of the graphene rods ((10,0), (0,10), (10,10)) both graphene and the Pt clusters are probed, at the other superlattice positions the Pt clusters are probed and the increased corrugation of the graphene layer induced by the Pt cluster adsorption, giving rise to higher order Fourier components. Along the crystal truncation rods (9,0), (9, 9) and (9,9) the distance of the Pt clusters and their registry with the Ir substrate is
175
5 -1 Q (nm )x -1 Q (nm )y -1 Q (nm )y -1 Q (nm )y -1 Q (nm ) y -1 Q (nm ) ┴ -1 Q (nm )┴ Q (nm )┴ -1
Intensity (arb. u.)
-8 -6 -4 -2 0 2 4 6 8 1 2 3 4 5 6 0 2 4 6 8 10 1 2 3 4 5 6 1 2 3 4 5 6 =1.5 =1.8 R R H H 2.5 3 3.5 4 4.5 5 5.5 6 8 7 6 6 4 5 2 4 0 3 -2 2 -1 10 0 10 1 10 2 10 -4 1 -6
a)
b)
c)
Intensity (arb. u.)
0 10 0 10 -2 10 1 10 101 -1 10 2 10 102 0 10 3 10 3 10 1 10
d)
e)
f)
FIG. 2. (Color online) GISAXS pattern and relative fits for 0.2 ML Pt on top of graphene. (a) Experimental (top) and
simulated (bottom) in-plane (α = αc, i.e. Q⊥∼ 0) map of reciprocal space showing the self-organization of Pt clusters on top
of graphene on Ir(111). (b) Experimental GISAXS image for the incident beam aligned along the (110) direction. (c) cuts along the in-plane (1,0) direction (data: circles, fits: squares). (d) Parallel cuts along the (100) direction of a simulated GISAXS
pattern and single particle envelop functions showing the effect of a change of the clusters aspect ratio for 5.2 ˚A radius R and
2.8 ˚A height H (blue) and for 4.8 ˚A radius and 3.3 ˚A height (red).(e), (f) cuts along the out-of-plane (1,0,L) and (2,0,L) rods
(data: circles, fits: squares).
perpendicular to the surface.
For the analysis of the SXRD data we started with a very simple model containing a one layer-high Pt cluster on top of a sp2 hybridized graphene layer without any corrugation. The in-plane unit cell vectors of the graphene on
top of the Ir(111) are parallel to the Ir(111) surface unit cell vectors. The model unit cell contains 10 carbon unit
180
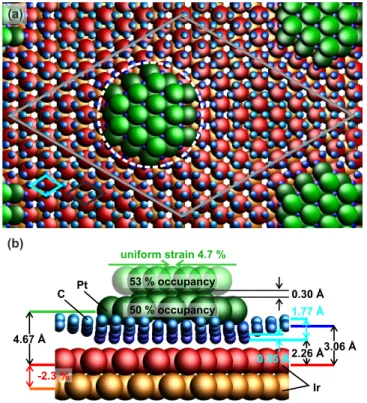
cells commensurate on top of 9 iridium unit cells (see Fig. 5(a)). The initial height of the graphene is chosen to be 3.38 ˚A, which is consistent with NIXSW measurements for bare graphene on Ir(111) [23]. A flat hexagon is chosen as the shape of the Pt clusters. The base layer contains 19 atoms, which is in line with GISAXS results (the white dotted circle in Fig. 5(a) represents the diameter determined by the GISAXS fit). The initial cluster height above the Ir(111) substrate is chosen to be 4.68 ˚A as determined by NIXSW experiments. The second cluster layer has
185
two stacking possibilities [9], which are assumed to have the same probability. In order to fit the measured structure factors we introduced a uniform strain to the cluster and an in-plane and out-of-plane Debye-Waller factor was taken into account for the platinum atoms. The distance of the cluster with respect to the Ir substrate was free to vary, in addition to the occupation value of each cluster layer, the graphene height, and the height of the topmost substrate layer.
190
The fit with the simplified model (long dashed (magenta) lines in Fig. 4) neglects the contribution of the graphene on the cluster lattice rods, because the flat graphene only contributes at the (10, 0) and the (10, 10) rod. On these rods the interference with the Pt clusters leads to the two maxima close to L = 1 and L = 3 (see Fig. 4). On the other superstructure rods, only the 2D Pt clusters are contributing, which leads to a flat structure factor as a function of
(c)
(b) (a)
Pt
C
FIG. 3. (Color online) XSW data from Pt/C/Ir(111): (a) Pt 3d3/2 core level spectrum recorded at a photon energy of 2810
eV. (b) C1s core level spectrum recorded at the same photon energy as (a). (c) Measured integrated photoelectron intensities
(squares) and fits (lines) as a function of x-ray excitation energy. Upper panel: Pt 3d3/2(magenta), middle panel C1s (grey),
lower panel: corresponding reflectivity of the exciting x-ray beam (orange).
L (the decay relates to the Q dependence of the Pt atomic form factor only). The overall shape of the rods is not
195
reproduced by this model, which is therefore ruled out (normalized χ2= 4.83).
A more advanced model with sp3hybridized graphene below the Pt cluster and a buckled sp2structure beside the
cluster is necessary to access the basic properties of the graphene layer as put forward by theory and by our recent SXRD study of Ir clusters on C/Ir(111)[9, 21, 22]. To refine our initial model we tested a structural model obtained by density functional theory (DFT) calculations in LDA approximation, consisting of a 19 atoms Pt cluster on top of
200
the graphene/Ir(111) moir´e [22]. In order to compare the DFT model to the measured data, an occupation parameter and an anisotropic Debye-Waller factor (allowing for thermal vibrations and / or statical disorder) is applied to the Pt atoms. For the best fit of the DFT model to the data we obtain a Pt occupation of (58 ± 3) % and the Debye-Waller parameters are fitted to DW(inplane) = (5.2 ± 0.2), DW(out-of-plane) = (5.5 ± 0.3), leading to a normalized χ2 = 3.1
(blue curves in Fig. 4).
205
There is a large improvement of the fit using the DFT model instead of the simple model with flat graphene (compare Fig. 4). Already a single layer Pt cluster together with a more realistic graphene layer containing sp3 like
structure below the Pt cluster and a buckled sp2 structure beside the Pt cluster reproduces many features of the first 8 cluster lattice rods, see Fig. 4. Also the shape of the (10,0) and (10, 10) rods, where graphene contributes most strongly, is reproduced much better by the DFT model. Only on the (9 9) CTR the DFT model and the data
210
disagree, which is likely due to the known tendency of DFT calculations in local density approximation (LDA) based on a substrate of a stack of a few layers to overestimate the binding force and relaxations of the topmost surface layers.
The model achieved by DFT calculations is too complex for a further refinement of the x-ray data due to the difficulty of introducing systematic fitting parameters. We therefore extracted the main results from the DFT model
215
and extended the simple starting model to a truncated two atomic Pt layers-high hexagonal pyramid (see Fig. 5 (a)). We modified the graphene layer such that below the cluster the carbon atoms are sp3-like hybridized. This structural motif extends until the last group of carbon atoms surrounding the cluster are bonded to the substrate. The sp3-like area is assumed to be flat and only the splitting height of the sp3 carbon atoms and carbon-carbon bond distance is
varied. The uncovered carbon atoms are assumed to have a sp2-like structure. The corrugation of the graphene layer
220
is varied by changing the standard bond length of the sp2-hybridized atoms, while optimizing the atom positions in
respect to energy minimization according to Equation (1).
Ek = X i C1· di+ 1 2 X i6=j C2· αij ; i,j ∈ {1, 2, 3} (1)
The energy of a single carbon atom is calculated by this simple expression taking the distance deviation di from
standard bond lengths to neighboring atom i and the deviation αijfrom the optimum bond angle of 120◦between the
225
carbon atom k and the neighbors i,j into account. In practice, values for C1 C2are chosen to account for the high
7
FIG. 4. (Color online) SXRD dataset taken in UHV after deposition of 0.2 ML Pt on graphene/Ir(111): Black and grey circles with error bars are measured structure factors whereas grey data points contain scattering contributions from a small amount of larger sintered clusters and are excluded from fitting. There are four different fit curves: i) long dashed (magenta) lines
-fit with flat sp2 hybridized graphene ii) short dashed (blue) lines comparison with DFT model iii) long dashed (red) line
-fit with final model with only 10 % occupation in the second cluster layer (only in specular (0,0) rod - third row and column)
iv) solid (green) line - fit with final model including a corrugated graphene model with sp3 hybridized area below cluster. The
first two rows contain cluster lattice rods without any contribution of the Ir(111) bulk. The third row contains rods, where the cluster lattice signal gets a strong coherent contribution from the graphene layer. The bottom row displays crystal truncation rods and the interference between the Ir bulk crystal and the Pt cluster lattice contains information on the position of the cluster in the unit cell.
The DFT model reveals that the edge atoms of the Pt cluster have a stronger bonding to the substrate, which expresses in a reduced height of the Pt edge atoms by 0.1 ˚A and a lifting of the corresponding substrate atoms by 0.1 ˚A. This feature is included to the model by fitting the height of the border atoms of the Pt cluster and also the
230
atoms below from the substrate independent from the rest of the corresponding group.
The best fit (solid (green) line in Fig.4, χ2= 2.3) is obtained for a graphene layer with 0.35 ˚A sp3splitting together
with a 1.49 ˚A sp3 bond length and a maximum corrugation amplitude of 1.77 ˚A in the uncovered sp2 area. The coherent position determined from the model PH= 0.49 translates to an average height of h
c= (3.17 ± 0.05) ˚A and is
close to (PH= 0.52 ± 0.01) determined with NIXSW for 0.1 ML Pt on C/Ir(111). The coherent fraction of the model
235
is FH= 0.26 and deviates from the value of FH= (0.46 ± 0.04) as determined by the NIXSW measurements, which
can be rationalized as follows: The clusters in our experiment are significantly larger than in the NIXSW experiment and therefore they cover a larger area within the graphene unit cell. This introduces higher stress into the graphene layer leading to a stronger buckling of the uncovered area of the graphene. Therefore the coherent fraction of the carbon atoms decreases while the average height is kept at comparable values. The topmost substrate layer distance
is found to be contracted by (2.3 ± 0.1) % similar to the result for Ir nanoparticles on graphene / Ir(111) [9]. (a) (b) 53 % occupancy 50 % occupancy 0.35 Å uniform strain 4.7 % 0.30 Å 1.77 Å 2 26 Å. 3 06 Å. -2.3 % 4 67 Å. Pt C Ir
FIG. 5. (Color online) Model used to fit SXRD data: (a) Top view of moir´e unit cell (grey). 10x10 carbon unit cells (blue)
fit commensurately on top of 9x9 Ir(111) unit cells (black). A two layer high cluster sits on top of the carbon layer where the carbon rings are above fcc sites in respect to the Ir support. The edge atoms of the cluster (bright green) are allowed to vary 245
their height with respect to the rest of the layer. The white circle marks the determined diameter of GISAXS measurements. (b) Side view of the SXRD model with fitted parameters. Cluster (green) on top of the graphene layer (blue) and two layers of the Ir(111) substrate (red, orange).
The occupation of both platinum cluster layers is fitted to Occ1= (50 ± 1) % (bottom layer) and Occ2= (53 ± 11) %
(top layer), while the corresponding Debye-Waller factors are DWip1= (2 ± 3), DWoop1= (1 ± 1) for the first Pt layer
250
bound to the sp3hybridized graphene area, whereas much higher values of DW
ip2= (31 ± 6) and DWoop2= (9 ± 4) are
found for the second layer. The diffraction signal of the non-specular rods (with large in-plane momentum transfer) is dominated by the diffraction contribution of the first Pt layer because of the much higher Debye Waller factors for the second layer. This is different for the specular (0,0) rod, for which the in-plane Debye Waller factor does not diminish the signal of the second layer, because here Qk = 0. All other rods can also be fitted with a much weaker
255
occupation of 10 % of the second cluster layer, but the shape of the specular rod cannot be described by this model. The specular rod (0, 0) in Fig. 4 displays both fits; green: Fit with 53 % occupation of the second cluster layer, red: Fit with only 10 % occupation of the second cluster layer, confirming the presence of the second layer. The occupancy of ∼ 50 % of both cluster layers indicates that only half of the moir´e unit cells are filled with clusters, pointing to a higher stability of double layer clusters under the specific deposition conditions of our experiment. In total each
260
cluster is made up on average from 31 atoms, which results in a coverage of ∼ 0.2 ML, when taking the occupancy of 50 % of the moir´e unit cells into account (1 ML corresponds to ∼ 81 atoms / moir´e unit cell).
The cluster height above the Ir(111) substrate is fitted to hPt= (4.67 ± 0.04) ˚A in good agreement with the value
obtained with NIXSW measurements. The height of the edge atoms of the clusters is determined to be (0.31 ± 0.04) ˚
A lower than all other atoms of the base layer, which is three times the value obtained in the DFT calculations. An
265
average uniform strain of 4.7 ± 0.1 % as compared to the Pt-Pt interatomic distance of 2.775 ˚A is obtained for the whole cluster, which is close to 6% average strain obtained for the one layer DFT model. Such a contraction of small particles is the result of unsaturated bonds of atoms at the particle surface and the interaction with the sp3hybridized
graphene below the cluster, exhibiting a smaller lattice constant. A comparable nanoparticle contraction was reported for Pt nanoparticles of similar diameter on Al2O3/NiAl(110) determined from ex-situ transmission electron microscopy
270
9
IV. GAS ADSORPTION INDUCED SHAPE CHANGES
After deposition of 0.1 ML Pt on the graphene/Ir(111) template we investigated shape changes during CO and subsequent O2 exposure. Due to the low amount of deposited material initially mainly single and double layered Pt
clusters were present, as is known from STM measurements [34]. For this simple shape the in-plane modulation of the
275
cluster superlattice rod intensity is given by the single particle structure factor. The single particle structure factor acts as the envelope function of the cluster lattice Bragg rod intensity, and it can be described in good approximation by a Gaussian [36]. The maximum Qmax of this envelop function is related via dcluster= Q2πmax to the average lateral
lattice parameter dcluster of the clusters [36].
280
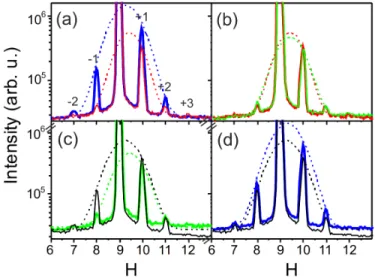
FIG. 6. (Color online) Radial scan in Qk direction (H = −K, L = 0.09) for 0.1 ML Pt on C/Ir(111): (a) blue: scan after
deposition of 0.1 ML Pt in UHV, superlattice reflections at H = (7, 8, 10, 11), CTR at H = 9, the dashed lines indicate Gaussian fits to the envelope functions of the single particle structure factor. For the fit the 0 order reflection was not included, because
here also the CTR signal from the Ir substrate contributes. Red: scan after exposure to 10−8 mbar CO for 20 min at room
temperature. (b) red: the same as in (a), green: scan during exposure to 10−6 mbar O2 at room temperature. (c) green: the
285
same as in (b), black: scan during exposure to 10−6mbar O2 at 575 K. (d) blue: initial scan, same as in (a) black: final scan,
the same as in (c).
Figure 6 displays radial in-plane high Qkscans of the scattered intensity for different experimental conditions. After
growth, the nanoparticles exhibit a radius of (5.2±0.1) ˚A and a height of 2.7 ˚A according to the GISAXS analysis ( see [37]). At high Qksuperlattice peaks up to second order are visible for the clean particles (Fig. 6 (a)), which confirms
290
the registry of the cluster lattice with the moir´e superstructure. The envelope function of the satellite peaks (dashed blue line, Gaussian fit) is shifted to higher Qk values as compared to the Ir crystal truncation rod signal at H=9,
reflecting a cluster compression of ∼ 5 % as compared to the Pt-Pt bulk (111) in-plane nearest neighbor distance. Upon CO exposure at room temperature (10−7 mbar for 20 min), the envelope function of the satellite peaks shifts to a even higher Qk value of H=9.5 (dashed red line, Gaussian fit), indicative for a further, CO adsorption-induced
295
compression of the particles of in total ∼ 7.8 % with respect to the bulk Pt-Pt interatomic distance. The shift of the envelope function leads to a noticeable redistribution of the satellite intensities and the appearance of a new, third order satellite at higher Qk (H=12). In the presence of CO, we deduce a radius decrease to (4.7±0.1) ˚A from the
GISAXS analysis accompanied with a thickness increase, from 2.7 ˚A to 3.3 ˚A(see [37]). This observation may be explained, together with the enhanced compression of the nanoparticles, by an upward bending of the rim Pt atoms,
300
as was proposed based on DFT calculations in [38] for a 7 atom Pt cluster on graphene / Ir(111). The reversibility of the process excludes strong sintering of the clusters, which would in turn give rise to a broad diffraction signal of uncorrelated clusters in the radial H scan [9], which is not observed.
We then attempted CO oxidation with O2 (10−6 mbar) at room temperature. At high Qk no significant change of
the diffraction signal is observed consistent with the high sticking coefficient of CO on Pt surfaces and a CO poisoning
305
(see Fig. 6 (b))[39]. Increasing the sample temperature to 575 K at an O2 pressure of 10−6 mbar seems to activate
CO oxidation, which expresses itself in the recovering of the initially observed satellite peak ratios and a backwards shift of the envelope function to smaller Qk values (see Fig. 6 (c,d)). The temperature of 575 K is probably high
clusters and react with CO to CO2 [40]. The experiments demonstrate that the clusters undergo reversible changes
310
of their strain state under cyclic gas exposure, while they are active as CO oxidation catalyst. The changing strain state of the clusters is expected to have strong influence on the adsorption energetics of gas molecules [4].
V. SUMMARY AND CONCLUSIONS
In summary we have demonstrated that 1-2-atomic layer-high Pt clusters with a diameter of only 1.3 nm form a regular, crystalline superlattice on the graphene moir´e structure on Ir(111), as determined by SXRD, GISAXS,
315
and NIXSW. SXRD delivers further insight into the atomic structure of the clusters, which are found to consist of hexagonal (111) planes with 4.7% in-plane compression. The atomic structure of the graphene layer is found to be strongly altered by the Pt cluster adsorption. It changes from the sinusoidally modulated structure of the clean graphene layer on Ir(111) [41] to an egg box-like structure, where C atoms below the cluster mediate the bonding between the cluster and the substrate. The structural model derived is in line with DFT calculations [22], rendering
320
the LDA approach very promising for the atomic structure prediction of even larger systems. We may generalize from our observations, that a long range ordered cluster arrangement is likely to be driven by the formation of a structurally coherent superlattice. Upon CO adsorption we observe a striking change of the wide angle satellite peak intensities which points to a CO adsorption induced additional compressive strain component. At 575 K this structural change turns out to be reversible under oxygen exposure, for which presumably CO oxidation takes place after partial CO
325
desorption. Our experiments demonstrate the versatility of graphene as a support for ultrasmall metal nanoparticles, opening the possibility of atomic scale structural investigations combined with studies of nanoscale adsorption and chemical reactivity of small clusters.
VI. ACKNOWLEDGEMENTS
The staff of the Surface Diffraction Beamline ID03 and ID32 at the European Synchrotron Radiation Facility (ESRF)
330
in Grenoble is acknowledged for their support during beamtime. DFT Work performed at Sandia was supported by the U. S. Department of Energy, Office of Basic Energy Sciences, Division of Materials Science and Engineering. Sandia National Laboratories is a multi-program laboratory managed and operated by Sandia Corporation, a wholly owned subsidiary of Lockheed Martin Corporation, for the U.S. Department of Energys National Nuclear Security Administration under Contract No. DE-AC04-94AL85000.
335
[1] G. Ertl, H. Kn¨ozinger, F. Sch¨uth, and J. Weitkamp, Handbook of Heterogeneous Catalysis (WILEY-VCH, 2008).
[2] Z. Chen, D. Higgins, A. Yu, L. Zhang, and J. Zhang, Energy Environ. Sci. 4, 3167 (2011). [3] W. C. Maskell, Journal of Physics E: Scientific Instruments 20, 1156 (1987).
[4] M. Mavrikakis, B. Hammer, and J. K. Nørskov, Phys. Rev. Lett. 81, 2819 (1998).
[5] S. Khanna and A. Castleman, Quantum Phenomena in Clusters and Nanostructures, Physics and Astronomy Online 340
Library (Springer, 2003).
[6] U. Heinz and U. Landman, Nanocatalysis, NanoScience and Technology (Springer, 2007). [7] S. Billinge and I. Levin, Science 316, 561 (2007).
[8] C. S. Spanjers, T. P. Senftle, A. C. T. van Duin, M. J. Janik, A. I. Frenkel, and R. M. Rioux, Phys. Chem. Chem. Phys. 16, 26528 (2014).
345
[9] D. Franz, S. Runte, C. Busse, S. Schumacher, T. Gerber, T. Michely, M. Mantilla, V. Kilic, J. Zegenhagen, and A. Stierle, Phys. Rev. Lett. 110, 065503 (2013).
[10] S. Billinge, Nature 495, 453 (2013).
[11] J. Coraux, A. T. N’Diaye, C. Busse, and T. Michely, Nano Lett. 8, 565 (2008).
[12] D. Martoccia, P. R. Willmott, T. Brugger, M. Bj¨orck, S. G¨unther, C. M. Schlep¨utz, A. Cervellino, S. A. Pauli, B. D.
350
Patterson, S. Marchini, J. Wintterlin, W. Moritz, and T. Greber, Phys. Rev. Lett. 101, 126102 (2008). [13] J. Wintterlin and M. L. Bocquet, Surf. Sci. 603, 1841 (2009).
[14] D. Martoccia, M. Bj¨orck, C. M. Schlep¨utz, T. Brugger, S. A. Pauli, B. D. Patterson, T. Greber, and P. R. Willmott, New
J. Phys. 12, 043028 (2010).
[15] W. Moritz, B. Wang, M. L. Bocquet, T. Brugger, T. Greber, J. Wintterlin, and S. G¨unther, Phys. Rev. Lett. 104, 136102
355
(2010).
[16] M. Gao, Y. Pan, C. Zhang, H. Hu, R. Yang, and H. Lu, Appl. Phys. Lett. 96, 053109 (2010).
[17] B. Borca, S. Barja, M. Garnica, J. J. Hinarejos, A. L. V´azquez de Parga, R. Miranda, and F. Guinea, Semicond. Sci.
11
[18] A. T. N’Diaye, S. Bleikamp, P. J. Feibelman, and T. Michely, Phys. Rev. Lett. 97, 215501 (2006). 360
[19] A. T. N’Diaye, T. Gerber, C. Busse, J. Myslive˘cek, J. Coraux, and T. Michely, New J. Phys. 11, 103045 (2009).
[20] P. J. Feibelman, Phys. Rev. B 77, 165419 (2008). [21] P. J. Feibelman, Phys. Rev. B 80, 085412 (2009).
[22] J. Knudsen, P. J. Feibelman, T. Gerber, E. Gr˚an¨as, K. Schulte, P. Stratmann, J. N. Andersen, and T. Michely, Phys.
Rev. B 85, 035407 (2012). 365
[23] C. Busse, P. Lazi´c, R. Djemour, J. Coraux, T. Gerber, N. Atodiresei, V. Caciuc, R. Brako, A. T. N’Diaye, S. Bl¨ugel,
J. Zegenhagen, and T. Michely, Phys. Rev. Lett. 107, 036101 (2011). [24] J. Zegenhagen, Surf. Sci. Rep. 18, 199 (1993).
[25] S. Ferrer and F. Comin, Rev. Sci. Instrum. 66, 1674 (1995).
[26] J. Coraux, A. T. N’Diaye, M. Engler, C. Busse, D. Wall, N. Buckanie, F. J. Meyer zu Heringdorf, R. van Gastel, B. Poelsema, 370
and T. Michely, New J. Phys. 11, 023006 (2009). [27] E. Vlieg, J. Appl. Cryst. 30, 532 (1997).
[28] E. Vlieg, J. Appl. Cryst. 33, 401 (2000).
[29] J. Zegenhagen, B. Detlefs, T.-L. Lee, S. Thiess, H. Isern, L. Petit, L. Andr´e, J. Roy, Y. Mi, and I. Joumard, J. El. Spec.
178-179, 258 (2010). 375
[30] F. Leroy, G. Renaud, A. L´etoublon, A. Rohart, Y. Girard, V. Repain, S. Rousset, A. Coati, and Y. Garreau, Phys. Rev.
B 77, 045430 (2008).
[31] F. Leroy, G. Renaud, A. L´etoublon, and R. Lazzari, Phys. Rev. B 77, 235429 (2008).
[32] N. Blanc, J. Coraux, C. Vo-Van, A. T. N’Diaye, O. Geaymond, and G. Renaud, Phys. Rev. B 86, 235439 (2012). [33] R. Lazzari, J. Appl. Cryst. 35, 406 (2002).
380
[34] T. Gerber, Interaction of Graphene and Templated Cluster Arrays with CO, H2, and O2, Ph.D. thesis, Universit¨at zu K¨oln
(2013).
[35] M. Klimenkov, S. Nepijko, H. Kuhlenbeck, M. B¨aumer, R. Schl¨ogl, and H.-J. Freund, Surf. Sci. 391, 27 36 (1997).
[36] U. Pietsch, V. Holy, and T. Baumbach, High-Resolution X-Ray Scattering, Springer Tracts in Modern Physics (Springer, 2004).
385
[37] See Supplemental Material at [URL will be inserted by publisher] for GISXAS results and fits .
[38] T. Gerber, J. Knudsen, P. J. Feibelman, E. Gr˚an¨as, P. Stratmann, K. Schulte, J. N. Andersen, and T. Michely, ACS Nano
7, 2020 (2013).
[39] X. Su, P. S. Cremer, Y. R. Shen, and G. A. Somorjai, Journal of the American Chemical Society 119, 3994 (1997). [40] T. Engel and G. Ertl, Advances in Catalysis, 28, 1 (1979).
390