Analysis and Improvement
of the Spectral Properties in
Mid-Infrared Semiconductor
Quantum Cascade Lasers
Th`ese pr´esent´ee `a la Facult´e des Sciences pour l’obtention du
grade de Docteur `es Sciences par:
Lionel Tombez
Ing. Dipl. EPFL en Microtechnique
accept´ee le 21.01.2014 sur proposition du jury:
Prof. Thomas S¨
udmeyer Directeur
Prof. J´erˆome Faist
Rapporteur
Dr. Saverio Bartalini
Rapporteur
Dr. St´ephane Schilt
Rapporteur
Faculté des sciences Secrétariat-décanat de Faculté Rue Emile-Argand 11 2000 Neuchâtel - Suisse Tél: + 41 (0)32 718 2100 E-mail: [email protected]
IMPRIMATUR POUR THESE DE DOCTORAT
La Faculté des sciences de l'Université de Neuchâtel
autorise l'impression de la présente thèse soutenue par
Monsieur Lionel TOMBEZ
Titre:
Analysis and Improvements of the Spectral Properties in
Mid-Infrared Semiconductor Quantum Cascade Lasers
sur le rapport des membres du jury composé comme suit :
x Prof. Thomas Südmeyer, Université de Neuchâtel, directeur de thèse x Dr. Stéphane Schilt, Université de Neuchâtel
x Prof. Jérôme Faist, ETH Zürich
x Dr Saverio Bartalini, LENS, Université de Florence, Italie
Neuchâtel, le 20 février 2014 Le Doyen, Prof. P. Kropf
Keywords - Mots cl´
es
Keywords
semiconductor, quantum cascade, lasers, intersubband transitions, mid-infrared, mid-IR, distributed feedback, DFB, single mode, linewidth, flicker, 1/f , frequency noise, phase noise, frequency stability, electronic noise, ac-tive stabilization, low noise, noise reduction, frequency modulation, ther-mal dynamics
Mots cl´
es
semiconducteur, cascade quantique, lasers, transition intersousbande, in-frarouge moyen, r´eseau de Bragg distribu´e, DFB, mono mode, largeur de raie, flicker, 1/f , bruit de fr´equence, bruit de phase, stabilit´e de fr´equence, bruit ´el´ectronique, stabilisation active, r´eduction de bruit, faible bruit, modulation de fr´equence, dynamique thermique
Abstract
Quantum Cascade Lasers (QCLs) are semiconductor lasers based on inter-subband transitions in semiconductor heterojunctions. Unlike conventional laser diodes, the emission wavelength of QCLs is not defined by the energy gap between the conduction and valance bands of the semiconductor ma-terial, but by the energy spacing between the discrete states of quantum wells, which enables the realization of compact semiconductor lasers in the mid-infrared and far-infrared spectral regions. The mid-IR spectral region contains the fundamental vibration bands of many molecular species, such as carbon dioxide (CO2) and methane (CH4), and enables high precision analysis of chemical species. Thanks to the use of well-known semicon-ductor fabrication techniques widely developed for optical telecommuni-cation applitelecommuni-cations in the near-IR, QCLs are compact and suitable for mass-production, and therefore constitute a very interesting candidate for the development of portable and highly sensitive and selective trace-gas sensors by absorption spectroscopy in the mid-infrared.
In this thesis, the spectral properties of InGaAs/InAlAs distributed-feedback (DFB) QCLs emitting in the mid-IR spectral region were stud-ied, with the aim of assessing and improving the spectral purity of these devices. Low frequency-noise and narrow-linewidth coherent light sources emitting in the mid-IR spectral region are indeed of prime interest for the future development of high-resolution spectroscopy systems. First of all, this thesis presents the frequency-tuning and thermal dynamics in DFB-QCLs, which are important to understand the underlying mechanisms of frequency noise generation. A simple thermal model is used to explain the observed thermal dynamics. In a second phase, the frequency-noise proper-ties of different QCLs were studied upon operating conditions and devices parameters. The effect of the processing of the lasers active region, namely in ridge waveguide or buried-heterostructure was in particular investigated. The design of a low-noise power supply to provide a stable injection current as well as the impact on the spectral properties of QCLs is also presented.
Then, the noise properties at the electrical level in the semiconductor laser chips were investigated. A particularly interesting outcome of the exper-iments is a clear link between instabilities of the emission frequency and electrical power fluctuations due to the electronic transport in the laser chip. The results enabled the demonstration of a novel and extremely simple method for assessing the spectral properties of QCLs from electri-cal measurements only. Finally, a novel and innovative active method for frequency-noise reduction and linewidth narrowing of QCLs without using any optical frequency reference was developed and yielded a 90% reduction of the frequency-noise power spectral density.
R´
esum´
e
Les lasers `a cascade quantique (QCL) sont des lasers `a semiconducteur bas´es sur des transitions inter-sous-bandes. Au contraire des diodes lasers traditionnelles, la longueur d’onde d’´emission de ce type de laser n’est pas d´efinie par la bande interdite (bandgap) du mat´eriau semiconducteur, mais par l’´ecart d’´energie entre les niveaux discrets de plusieurs puits quan-tiques, ce qui permet la r´ealisation de sources laser compactes ´emettant dans l’infrarouge moyen (mid-IR) et dans l’infrarouge lointain (far-IR). Le moyen infrarouge comporte les bandes fondamentales de vibrations d’un grand nombre d’esp`eces mol´eculaires telles que le dioxide de carbone (CO2) ou le m´ethane (CH4), et permet la d´etection d’´esp`eces chimiques avec grande pr´ecision. Grˆace `a l’utilisation de techniques de fabrication standards et bien connues des lasers `a semiconducteur utilis´es pour les t´el´ecommunications optiques dans l’infrarouge proche, le laser `a cascade quantique est un dispositif extrˆemement compact et productible en masse, et constitue par cons´equence un excellent candidat pour la r´ealisation de capteurs de gaz portables et extrˆemement sensibles utilisant des techniques de spectroscopie par absorption dans le moyen infrarouge.
Dans cette th`ese, les propri´et´es spectrales des lasers `a cascade quan-tique `a base d’InGaAs/InAlAs ´emettant dans l’infrarouge moyen et util-isant un r´eseau de Bragg distribu´e pour garantir une ´emission mono-mode ont ´et´e ´etudi´ees, avec pour but d’en ´evaluer et d’en am´eliorer la puret´e spectrale. Les sources de lumi`ere coh´erentes `a largeur de raie ´etroite et faible bruit de fr´equence sont en effet d’une grande importance pour le d´evelopement de nouveau syst`emes de mesure et d’instruments de haute pr´ecision dans la gamme spectrale du moyen infrarouge. Dans un premier temps, la dynamique de l’ajustement de la fr´equence optique et des pro-pri´et´es thermiques des lasers `a cascade quantique, qui est essentielle `a la compr´ehension du m´ecanisme de formation des instabilit´es de fr´equence, a ´et´e ´etudi´ee et est pr´esent´ee. Dans un deuxi`eme temps, l’impact des con-ditions d’op´eration et de divers param`etres des lasers `a cascade quantique
sur leur bruit de fr´equence a ´et´e ´evalu´e. L’impact du type de fabrication de la r´egion active des lasers a notamment ´et´e ´etudi´e. Pour ce faire, une alimentation `a faible bruit de courant a dˆu ˆetre d´evelopp´ee afin de fournir un courant d’injection aussi stable que possible. Le bruit ´electrique dans les lasers `a cascade quantique a ´egalement ´et´e ´etudi´e, et nous montrons un lien particuli`erement int´eressant entre les instabilit´es de fr´equence du laser et les fluctuations de la puissance ´electrique dissip´ee dans ce dernier. Ces r´esultats ont permis la d´emonstration d’une nouvelle approche partic-uli`erement simple visant `a ´evaluer la puret´e spectrale des lasers `a cascade quantique `a partir uniquement de mesures ´electriques. Finalement, une nouvelle m´ethode innovante de r´eduction active du bruit de fr´equence et de diminution de la largeur de raie sans avoir recours `a aucune r´ef´erence de fr´equence optique a ´et´e d´evelop´ee dans le cadre de cette th`ese et a permis d’obtenir une r´eduction de 90% de la densit´e spectrale de puissance du bruit de fr´equence.
Contents
1 Introduction 1
2 Basics of mid-IR technologies and noise in laser diodes 5
2.1 Mid-IR technologies . . . 5
2.1.1 Mid-IR coherent light sources . . . 5
2.1.2 Quantum cascade lasers . . . 6
2.1.3 Applications . . . 9
2.2 Spectral purity of semiconductor lasers . . . 11
2.2.1 Frequency-noise in semiconductor lasers . . . 11
2.2.2 Schawlow-Townes linewidth . . . 12
2.2.3 Frequency-noise to optical lineshape relation . . . 13
2.3 1/f fluctuations in physical systems . . . 15
2.4 List of QCLs used in this work . . . 18
3 Wavelength tuning and thermal dynamics of CW QCLs 19 3.1 Basics of frequency-modulation . . . 20
3.2 Frequency modulation of DFB lasers . . . 21
3.2.1 Interband semiconductor lasers . . . 21
3.2.2 Intersubband semiconductor lasers . . . 23
3.3 Frequency-modulation characterization . . . 24
3.4 Frequency-modulation response . . . 26
3.5.1 Step response . . . 29
3.5.2 Temperature dependence . . . 30
3.6 Fast electrical modulation . . . 32
3.7 Conclusion and outlook . . . 34
4 Spectral purity of mid-IR QCLs 37 4.1 Low-noise electronics for QCLs . . . 38
4.1.1 Custom and commercial low-noise solutions . . . 38
4.1.2 QCL driver design . . . 39
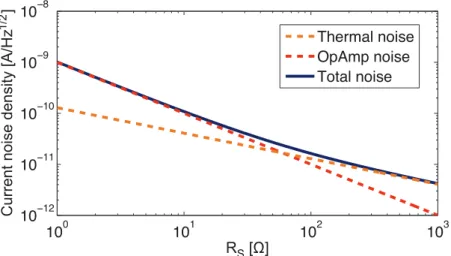
4.1.3 Theoretical noise limit . . . 40
4.1.4 Current noise . . . 41
4.1.5 Modulation bandwidth . . . 42
4.2 Measurement of mid-IR frequencies . . . 43
4.2.1 Molecular spectroscopy of carbon monoxide . . . 43
4.2.2 Frequency-noise measurement setup . . . 45
4.3 Frequency-noise of 4.6 µm at room temperature . . . 47
4.3.1 Results from molecular absorption line . . . 47
4.3.2 Results from Fabry-Perot interferometer . . . 49
4.3.3 Calculated and experimental linewidths . . . 50
4.3.4 Schawlow-Townes linewidth . . . 51
4.4 Impact of the driving electronics . . . 52
4.5 State-of-the-art . . . 54
4.5.1 Free-running mid-IR QCLs . . . 54
4.5.2 Comparison to interband laser diodes . . . 56
5 Origin of frequency instabilities in mid-IR QCLs 59 5.1 Temperature dependence of frequency-noise . . . 60
5.1.1 Experimental setup . . . 60
Contents
5.1.3 Linewidth . . . 64
5.1.4 Electrical noise conversion . . . 65
5.2 Effect of the thermal resistance . . . 67
5.3 Buried-heterostructure vs. ridge QCLs . . . 69
5.3.1 Frequency-noise spectra . . . 69
5.3.2 Electrical noise and comparison . . . 70
5.4 Voltage and frequency noise correlation . . . 72
5.4.1 Time-domain measurements . . . 73
5.4.2 Frequency-domain cross spectrum . . . 75
5.5 Voltage noise . . . 76
5.5.1 Buried-heterostructure device . . . 76
5.5.2 Ridge-waveguide QCL . . . 78
5.5.3 Discussion and outlook . . . 80
6 Towards all-electrical linewidth narrowing 87 6.1 Frequency-stabilization of QCLs . . . 88
6.2 Voltage stabilization scheme . . . 89
6.2.1 Experimental setup . . . 90
6.3 Experimental results . . . 92
6.3.1 Voltage noise . . . 93
6.3.2 Frequency noise and linewidth . . . 93
6.3.3 Effect of external laser and intensity noise . . . 94
6.3.4 Modulation and loop bandwidths . . . 95
6.4 Limitations . . . 97
6.5 Outlook . . . 99
List of Figures
1.1 Periodic semiconductor nanostructure . . . 2
2.1 Interband vs. intersubband transitions . . . 6
2.2 Typical active region design of a QCL . . . 7
2.3 Schematic and micrograph of a DFB grating . . . 8
2.4 Transmission spectra of CO2 and CH4 . . . 10
2.5 FWHM linewidth evaluation from FN spectrum . . . 14
2.6 Typical 1/f noise spectrum . . . 16
3.1 Refractive index in interband and intersubband transitions . 21 3.2 FM response of a singlemode AlGaAs DFB laser at 842 nm . 23 3.3 FM response measurement setup . . . 24
3.4 Relative FM response of two ridge-waveguide QCLs . . . 26
3.5 Simplified schematic of a QCL structure and thermal model 28 3.6 Optical frequency response vs. current step . . . 30
3.7 Temperature dependence of the cut-off frequencies . . . 31
3.8 Thermal resistances relative contributions . . . 32
3.9 Optical spectrum with 15 MHz FM modulation . . . 33
4.1 Current driver output stage design . . . 39
4.2 Theoretical current-noise limit . . . 41
4.4 Current drivers modulation responses . . . 43
4.5 Simulated transmission of CO R(14) . . . 44
4.6 Discriminator slope and spectral width vs. gas pressure . . . 45
4.7 Frequency-noise measurement setup . . . 46
4.8 Experimental CO absorption profile . . . 47
4.9 Frequency-noise PSD of a 4.6 µm DFB-QCL . . . 48
4.10 FN measurement with a Fabry-Perot interferometer . . . 49
4.11 FN PSD measured with a Fabry-Perot interferometer . . . . 50
4.12 Beat signal between two identical 4.6-µm DFB-QCLs . . . . 51
4.13 Frequency-noise PSD vs. current noise density . . . 52
4.14 Impact of the current driver noise on the QCL linewidth . . 53
4.15 Frequency-noise PSD of different mid-IR QCLs . . . 55
5.1 Transmission spectra of various transitions of CO R-branch . 61 5.2 FN spectra of a BH-QCL at different temperatures . . . 62
5.3 FN PSD vs. temperature of a BH-QCL . . . 64
5.4 Calculated linewidth as a function of temperature . . . 64
5.5 Electrical noise spectra from 128 K to 283 K . . . 65
5.6 Thermal filtering of the noise process . . . 66
5.7 Frequency noise PSD vs. laser thermal resistance . . . 68
5.8 FN PSD of a ridge-waveguide QCL at 98 K and 250 K . . . 69
5.9 Comparison between ridge and buried-heterostructure devices 70 5.10 Voltage noise as a function of the device temperature . . . . 71
5.11 Noise correlation measurement setup . . . 72
5.12 Frequency and voltage fluctuations vs. time in a ridge QCL 73 5.13 Frequency and voltage fluctuations vs. time in a BH QCL . 74 5.14 Frequency fluctuations vs. voltage fluctuations (ridge) . . . . 74
5.15 Frequency fluctuations vs. voltage fluctuations (BH) . . . . 75
List of Figures
5.17 VN PSD of a BH QCL at 133 K and 250 K . . . 77
5.18 VN PSD at 3 kHz of a BH QCL versus temperature . . . 78
5.19 VN PSD at 3 kHz of a ridge QCL versus temperature . . . . 79
5.20 Ridge QCL VN PSD at 3 kHz vs. TA . . . 79
5.21 Ridge QCL VN PSD at 3 kHz vs. drive current at fixed TA . 80 5.22 FN of an 8 µm QCL from optical and electrical measurements 83 5.23 Voltage noise PSD of a wide set of 8 µm DFB QCLs . . . . 84
5.24 Voltage noise PSD vs. device dimensions . . . 85
6.1 Voltage-noise stabilization principle . . . 89
6.2 Voltage-noise stabilization experimental setup . . . 90
6.3 QCL voltage vs. temperature at constant current . . . 91
6.4 Simultaneous recordings of the QCL voltage and frequency . 92 6.5 VN PSD when the locking scheme is enabled and disabled . 93 6.6 Frequency-noise PSD in locked and unlocked conditions. . . 94
6.7 Impact of NIR illumination on FN and IN . . . 95
6.8 Transfer functions of frequency and voltage modulation . . . 96
6.9 Time-domain measurement of the drive current . . . 97
6.10 Current-noise PSD . . . 98
List of Tables
2.1 List of QCLs used in this work . . . 18
3.1 QCLs used for FM response measurements . . . 25
3.2 Cut-off frequencies and relative contributions . . . 29
3.3 Experimental thermal capacities . . . 35
4.1 Overview of the low-noise current drivers . . . 38
4.2 Overview of FWHM linewidths reported in mid-IR QCLs . . 55
5.1 8 µm BH and ridge QCLs main parameters . . . 84
Publications
Parts of this thesis are published in the following journal papers, book chapters and conference proceedings.
Journal publications
1. L. Tombez, S. Schilt, D. Hofstetter, T. S¨udmeyer, “Active frequency-noise reduction of a mid-IR quantum cascade laser without optical fre-quency reference”, Opt. Letters 38, 5079-5082 (2013)
2. L. Tombez, F. Cappelli, S. Bartalini, S. Schilt, G. Di Domenico, D. Hofstetter, “Wavelength-tuning and thermal dynamics in continuous-wave mid-infrared quantum cascade lasers”, Applied Physics Letters 103(3), 031111-031111 (2013)
3. L. Tombez, S. Schilt, J. Di Francesco, T. Fhrer, B. Rein, T. Walther, G. Di Domenico, D. Hofstetter, P. Thomann, “Linewidth of a quantum cascade laser assessed from its frequency noise and impact of the current driver”, Applied Physics B, 109(3), 407-414 (2012)
4. L. Tombez, S. Schilt, J. Di Francesco, P. Thomann, D. Hofstetter, “Tem-perature dependence of the frequency noise in a mid-IR DFB quantum cascade laser from cryogenic to room temperature”, Opt. Express 20 (7), 6851-6859 (2012)
5. S. Schilt, N. Bucalovic, L. Tombez, V. Dolgovskiy, C. Schori, G. Di Domenico, M. Zaffalon, P. Thomann, “Frequency discriminators for the characterization of narrow-spectrum heterodyne beat signals: applica-tion to the measurement of a sub-hertz carrier-envelope-offset beat in an optical frequency comb”, Rev. Scient. Instr. 82 (12), 123116 (2011)
6. L. Tombez, J. Di Francesco, S. Schilt, G. Di Domenico, J. Faist, P. Thomann, D. Hofstetter, “Frequency noise of free-running 4.6 µm dis-tributed feedback quantum cascade lasers near room temperature”, Opt. Letters 36 (16), 31093111 (2011)
Book chapter
1. S. Schilt, L. Tombez, G. Di Domenico, D. Hofstetter, “Frequency Noise and Linewidth of Mid-infrared Continuous Wave Quantum Cascade Lasers: An Overview”, in The Wonders of Nanotechnology: Quantum and Optoelectronic Devices and Applications, SPIE Press, Bellingham, WA, pp. 261-287 (2013)
Selected conference presentations
1. L. Tombez, S. Schilt, G. Di Domenico, D. Hofstetter, T. S¨udmeyer, “Active linewidth narrowing of a mid-IR quantum cascade laser with-out optical frequency reference”, Mid-Infrared Coherent Sources, Paris, France, Oct. 26 - Nov. 1, 2013, oral MTh4B.3
2. L. Tombez, S. Schilt, G. Di Domenico, S. Blaser, A. Muller, T. Gresch, B. Hinkov, M. Beck, J. Faist, D. Hofstetter, “Physical Origin of Fre-quency Noise and Linewidth in Mid-IR DFB Quantum Cascade Lasers”, CLEO-2013, San Jose, USA; June 9-14, 2013, oral CM1K.3
3. L. Tombez, S. Schilt, J. Di Francesco, D. Hofstetter, “Frequency noise of free-running mid-IR DFB quantum cascade lasers”, IQCLSW-2012, Vienna, Austria; September 2-6, 2012, oral presentation
4. L. Tombez, S. Schilt, J. Di Francesco, P. Thomann, D. Hofstetter, “Tem-perature dependence of the frequency noise and linewidth of a DFB quantum cascade laser”, CLEO-2012, San Jose, USA; May 6-11, 2012, oral CF2K.5
5. L. Tombez, J. Di Francesco, S. Schilt, G. Di Domenico, D. Hofstetter, P. Thomann , “Frequency noise of free-running room temperature quantum cascade lasers”, CLEO-Europe 2011, Munich, Germany; May 22-26, 2011, oral CB4.3 TUE
6. L. Tombez, J. Di Francesco, S. Schilt, G. Di Domenico, D. Hofstetter , P. Thomann, “Frequency noise of free-running room temperature CW quantum cascade lasers”, 40th Freiburg Infrared Colloquium, Freiburg, Germany, February 17-18, 2011, oral presentation
7. L. Tombez, J. Di Francesco, S. Schilt, G. Di Domenico, D. Hofstetter, P. Thomann, “Low-noise room temperature quantum cascade lasers”, Optical Clock Workshop, Torino, Italy, December 1-3, 2010, oral pre-sentation
Chapter 1
Introduction
Would you expect a portable, inexpensive and widespread device such as a cell phone to be capable of performing medical diagnostics, testing whether food is safe for human consumption, or monitoring air quality? It would undoubtedly better fit in a bad sci-fi movie. However, the tremendous developments in quantum optics of the last decades could very well move such futuristic applications closer to a not-so-distant reality.
The advent of quantum mechanics combined to the technological devel-opments in semiconductor fabrication techniques have allowed scientists to play with electrons and photons at the scale of the atom, and develop rev-olutionary nanostructures aiming at overcoming physical boundaries. The emergence of semiconductor lasers emitting in the mid-infrared (mid-IR) spectral region cannot better illustrate the foregoing statements. Recent advances in quantum optics enabled the development of compact and effi-cient coherent light sources in this portion of the electromagnetic spectrum. The mid-IR spectral region of the optical spectrum extends from wave-lengths of 2 µm up to 30 µm, and is also often referred to as the molecular fingerprint region. This latter designation reveals of lot about its impor-tance in numerous different application fields. Indeed, a countless number of molecular species, among them molecules attracting very high media coverage such as carbon dioxide (CO2), have their fundamental vibrational resonance bands in this spectral region. The exact location of these reso-nances in the spectrum as well as their strengths depend on the constituents and amount of molecules in a given sample, and are governed by quantum mechanics selection rules. Mid-IR radiation can therefore be used to probe these molecular resonances and record absorption spectra, which are liter-ally the fingerprints of the molecules and can be compared to reference data
in order to establish whether a particular molecular specie is present in an unknown sample, and quantify its concentration. The ability to identify and quantify low levels of specific chemical compounds in the air opens the way to an infinite number of potential real-world applications. Air quality and greenhouse gases monitoring, detection of toxic agents and explosives, and exhaled air analysis for medical diagnostics are only a few examples of applications that have the potential to transform environmental sciences and modern medicine.
However, the realization of robust, efficient and compact laser sources at mid-IR wavelengths has been challenging and it is only since the advent of the quantum cascade laser (QCL), which was demonstrated for the first time at AT&T Bell Labs in 1994 [1] that the development of highly sensitive and portable chemical sensor has emerged. Unlike conventional semicon-ductor laser diodes, quantum cascade lasers are semiconsemicon-ductor lasers based on intersubband transitions and do not rely on electron-hole recombination between the conduction and valence bands. In interband transitions, the energy of the emitted photons E = hν, depends on the gap between these two energy bands. The composition of the semiconductor compounds de-fines the energy bandgap, and therefore the emission wavelenghts -or color-of the laser. In intersubband transitions, the picture is fundamentally dif-ferent and the transition takes place in the conduction band itself, between two discrete energy levels of a quantum well. Quantum wells are nanostruc-tures made of extremely thin layers of semiconductor materials, as shown in Figure 1.1, in which electrons can be confined.
Figure 1.1: Periodic nanostructure of thin layers of two different semi-conductor materials enabling quantum confinement effects. The nar-rowest layers measure 1 nm, or one billionth of a meter. Image from [2]. The first important implication is that the emission frequency does not rely any more on the bandgap of the material, but is instead defined by the physical thickness of the layers. With such transitions, it is therefore
possible to overcome the bandgap limitation and precisely design the emis-sion of quantum cascade lasers for different mid-IR wavelengths in a same material system using quantum effects.
Since the first demonstration of a QCL in 1994, which was carried out in pulsed mode and at cryogenic temperature, tremendous advances were achieved and devices operating in continuous wave at room-temperature are nowadays commercially available. This evolution was made possi-ble notably through several key achievement such as the demonstration in 1996 of room-temperature operation in pulsed mode [3], single-mode operation in 1997 [4, 5] and of the first continuous-wave QCL working at room-temperature in 2002 [6]. Since then, relatively low electrical power consumption below 1 W [7] as well as high-power QCLs with optical powers beyond 4 W at 4.6 µm [8] were more recently disclosed.
Despite all these important advances, the spectral properties of QCLs were not extensively investigated and the focus was mostly directed to-wards improving the efficiency, lowering threshold currents and electri-cal power consumptions, and extending the wavelength coverage. This is even more true compared to interband semiconductor lasers emitting in the near-infrared and visible spectral regions, for which spectral properties were deeply explored and many narrow-linewidth systems demonstrated. Whereas the width of molecular resonances in the mid-IR is of a few gi-gahertz at atmospheric pressure, high spectral purity light sources are of prime interest in the field of high-resolution spectroscopy in order to follow the tracks of precision optical metrology, which was mainly developed in the visible and near-infrared spectral regions. Moreover, the potential de-velopment of high-speed free-space coherent communication systems using mid-IR QCLs in the so-called atmospheric windows (3-5 µm and 8-14 µm) as well as the future development in solid-state optical frequency comb would very likely benefit from low-noise mid-IR lasers.
The work carried out in this thesis unifies two research fields having strong ties in the scientific landscape of Neuchˆatel, namely frequency-metrology and mid-IR quantum cascade lasers. The work encompassed the study of the performance of InGaAs/InAlAs mid-IR QCLs as frequency-stable light sources in the mid-IR spectral region, the study of the noise gen-eration mechanisms and the development of compact active noise-reduction techniques.
This thesis is organized as follows. First of all, a general introduction on the fundamental concepts of QCLs and optical frequency metrology is presented in Chapter 2.
In Chapter 3, the wavelength-tuning and temperature dynamics in QCL chips were investigated and a thermal model was developed and validated. The thermal dynamics are of prime importance for the study of frequency-noise generation processes in QCLs and the results will be used in the following chapters.
In Chapter 4, the spectral purity of mid-IR QCLs emitting at 4.6 µm was investigated using absorption spectroscopy. We reported at that time the lowest frequency-noise and narrowest linewidth of 550 kHz of a free-running QCL in the 4-5 µm range, while operating the device at room-temperature. To achieve these results, low-noise electronics were developed to drive the lasers and are presented in this chapter. Despite the challenging design due to the high voltage required to bias QCLs, very low current-noise lev-els were achieved, and remain state-of-the-art today. The impact of the driving electronics upon the spectral properties of mid-IR QCLs was also studied in detail, and we show that great care must be taken if narrow-linewidth emission is desired.
Chapter 5 presents the impact of QCLs designs and operating pa-rameters upon the frequency-noise. Different QCLs using either ridge waveguides or buried-heterostructures were characterized, across a range of structural design parameters. A particularly interesting dependence of the frequency noise over temperature was found in buried-heterostructure QCLs at 4.6 µm and a clear correlation between frequency noise and elec-trical noise measured directly across the devices was shown. The origin of frequency-instabilities was linked to electrical-power fluctuations in the laser active region. These findings have led to the demonstration of a novel and simple method to assess the spectral properties of QCLs from electrical noise measurements only, which are much more convenient and simpler to implement than optical frequency measurements. The origin of electronic fluctuations will be discussed in this chapter as well.
In Chapter 6, a novel active method for frequency-noise reduction is presented. While an optical frequency-reference is generally required, we demonstrated a linewidth-narrowing technique implemented without mea-suring the actual laser frequency. The developed scheme employs only the voltage-noise measured across the QCL to generate a correction signal that is fed back to the laser temperature at a fast rate, independently of the injection current. In these conditions, the fluctuations of the optical fre-quency were reduced by 90% in terms of frefre-quency-noise power spectral density. The scheme has the potential to be completely integrated and could possibly also be applied to other kinds of semiconductor lasers.
Chapter 2
Basics of mid-IR technologies
and noise in laser diodes
First of all, this chapter presents an overview of the importance of the mid-infrared (mid-IR) as well as the advances and developments of coherent light sources in this spectral region. Many chemical molecular species that are important in environmental and life sciences have their fundamental vibration bands in the mid-IR spectral region (λ = 2−30 µm) of the optical spectrum [9]. These strong vibrational resonances allow the realization of chemical analysis of many molecular compounds with extremely high sensitivity and selectivity, provided that coherent and tunable light sources are available in this spectral region.
In a second phase, the fundamentals of phase noise in laser oscillators are presented, including a theoretical basis, an overview of frequency-noise in semiconductor laser diodes, spectral purity characterization techniques, and 1/f -like noise in physical systems.
2.1
Mid-IR technologies
2.1.1
Mid-IR coherent light sources
Several technologies have been developed to reach the mid-IR region of the optical spectrum. For instance, the operation of a CO2 gas laser at 10 µm was demonstrated for the first time in 1964 [10].
Regarding low-energy bandgap semiconductors, lead-salt (PbS, PbTe, PbSe) based laser diodes emitting in the 3−30 µm range have been available since the 1960s [11]. However, this kind of mid-IR lasers suffers from lim-ited output power (hundreds of µW), complicated manufacturing process and cryogenic temperature operation. Interband antimonide laser diodes emitting up to 3 µm at room-temperature were also demonstrated [12, 13] as well as interband cascade lasers (ICL) [14, 15] up to 5.6 µm [16].
Alternatively, generation of mid-IR light through non-linear processes based on difference frequency generation (DFG) [17] and optical parametric oscillators (OPOs) tunable from 3.6 to 4.3 µm [18] and 5.5 to 9.3 µm [19] have been demonstrated as well. Although DFG systems can be relatively compact, only limited mid-IR output power can be achieved. On the other hand, OPOs can deliver much higher output powers but are generally large systems with high power consumptions.
2.1.2
Quantum cascade lasers
Quantum cascade lasers are unipolar semiconductor devices based on in-tersubband transitions, relying on the idea of light amplification in het-erostructures proposed in the early 70’s [20], and were experimentally demonstrated for the first at Bell Labs in 1994 [1]. In contrast to con-ventional semiconductor laser diodes, the fundamental mechanism of light emission in intersubband lasers is not based on electron-hole recombina-tions between the conduction and valance bands of the gain medium, but on the transitions of electrons between discrete states in well-designed quan-tum wells. Both schemes are compared in Figure 2.1.
Figure 2.1: (a) Interband transition: recombination of electron-hole pairs. (b) Intersubband transition between two discrete states of a quan-tum well in the conduction band itself. Reprinted from [21].
2.1. Mid-IR technologies
A first crucial implication is that the emission wavelength in QCLs is not any more defined by the energy gap of the semiconductor materials, sometimes referred to as “the bandgap slavery”. Indeed by engineering the wave functions of the quantum wells, which basically depend on the layers thicknesses, it is possible to precisely tailor the emission wavelength of QCLs and to reach longer values in the mid-IR and even the THz do-main [22]. Another interesting aspect of intersubband transitions is that they can be almost naturally cascaded, which enables the electrons to be recycled and improves the quantum efficiency of such devices.
Figure 2.2: Active region design employed for the first demonstration of a QCL in 1994 [1].
An example of a typical QCL period is shown in Figure 2.2. It consists of an injector region, and an active region composed in this particular case of three quantum wells. This design results in a three-level laser system which enables an efficient population inversion between the states defining the laser transition 3→ 2. The spacing of the lower subbands is generally designed so that the 2→ 1 transition matches the energy of the longitudinal optical (LO) phonon energy and enables a fast relaxation of the lower laser level by resonant scattering to the following period. QCLs are generally composed of≈ 25 − 40 cascaded periods shown in Figure 2.2.
Since the first QCL demonstration, several key innovations such as the achievement of laser operation above room-temperature in pulsed mode [3], of the bound-to-continuum [23] and two-phonons resonant designs [24], and finally of continuous-wave (CW) operation at room temperature [6] have
led to a fast development of the performances of these devices in terms of wavelength coverage, output power and electrical consumption. For instance, mid-IR QCLs operating at electrical power consumptions below 1 W [7] and high optical output powers beyond 4 W in CW have been recently demonstrated [8].
Figure 2.3: (a) Schematic cross-section of a ridge-waveguide QCL. (b) Scanning electron micrograph (SEM) of the distributed-feedback grat-ing etched on top of the device [25].
Another key advance in the field of QCLs was the development of tun-able single-frequency devices, especially required in the field of molecular spectroscopy. The first realization of single-frequency QCLs was achieved using a distributed-feedback grating (DFB) etched on top of the device [4] and also directly on top of the active region, before the regrowth of a cladding layer [5]. Other single-frequency QCLs were then demonstrated at
2.1. Mid-IR technologies
different wavelengths [25, 26]. The processing of QCLs with DFB gratings is illustrated in Figure 2.3 (a). Figure 2.3 (b) shows an image of the DFB grating of the QCL of Ref. [25] (λ = 10 µm) obtained by scanning electron microscopy (SEM). In such a configuration, the distributed-feedback grat-ing acts as an optical filter inducgrat-ing wavelength-dependent losses in the laser cavity and forces laser operation at a single wavelength, despite the relatively broad gain curve. The lasing wavelength is defined by the Bragg condition:
λB =
2nef fΛ
N (2.1)
where nef f is the effective refractive index, Λ the grating period, and N the order of the grating (integer value). Although the detailed analysis will not be presented here, the coupled-wave theory of distributed-feedback lasers can be found in Ref. [27].
Single-frequency operation of QCLs in extended cavity configuration using external gratings was demonstrated for the first time in 2001 up to 230 K [28], and then in various configurations both in pulsed and CW regimes [29–31]. The main advantage of the external cavity configuration lies in a broader tuning range than DFB QCLs, at the expense of the size of the device. Based on a heterogenous cascade, a tuning range of up to 24% of the central wavelength was obtained [32].
2.1.3
Applications
The mid-infrared (mid-IR) region of the electromagnetic spectrum, also referred to as the fingerprint region, ranges from wavelengths of 2 to 30 µm and is of prime interest for several applications such as chemical sensing and monitoring of atmospheric constituents. Many chemical species such as carbon-dioxide (CO2), carbon-monoxide (CO), methane (CH4), ammo-nia (NH3) and nitrogen-oxide compounds (NOx) show strong vibrational molecular resonances in this spectral region [33], which makes mid-IR ab-sorption spectroscopy a very efficient technique for sensitive and selective chemical analysis and trace-gas sensing.
Absorption spectroscopy relies on Beer-Lambert law, which states that the intensity of light I(ν) at a frequency ν transmitted through a sample of concentration C and absorbance α(ν) over a distance L, compared to the initial intensity I0, is given by Eq. 2.2.
I(ν) = I0e−α(ν)CL (2.2) As the absorbance is characteristic of the chemical compounds, the ratio I(ν)/I0 as a function of ν gives a quantitative and qualitative information about the concentration and composition of the sample. Figure 2.4 shows the transmission spectra of carbon dioxide and methane around 2.7 µm and 3.3 µm, respectively. These features are governed by quantum mechanics selection rules and constitute the fingerprints of molecules.
3.2 3.3 3.4 3.5 2.7 2.75 2.8 0 1 Wavelength [µm] T ra n smi ssi o n CO2 CH44
Figure 2.4: Transmission spectra of carbon dioxide (CO2) and methane (CH4) in the mid-IR spectral region, which are the equivalent of the fingerprints of molecules.
The advent of QCLs has triggered the development of many absorp-tion spectroscopy techniques and the demonstraabsorp-tion of trace-gas sensing with unprecedented precision. Noise-reduction techniques such as wave-length modulation spectroscopy (WMS) [34] and frequency modulation spectroscopy (FMS) [33] as well as signal enhancement methods such as cavity ring-down spectroscopy [35] and quartz-enhanced photoacoustic spec-troscopy (QEPAS) [36] have been implemented.
Such systems have been deployed to quantify the concentrations of many of the most important atmospheric greenhouse gases, including car-bon dioxide (CO2) and methane (CH4) with sensitivities as low as 0.1% of the ambient concentrations [37]. In life sciences, the development of trace-gas sensors for the analysis of exhaled chemical compounds brings promising perspectives for novel and fast medical diagnostics [38]. For instance, ammonia (NH3) in human breath was studied as a marker for kidney and liver function [39], while carbon-monoxide (CO) could be used for the detection of cardiovascular diseases and diabetes. In both cases,
2.2. Spectral purity of semiconductor lasers
the exhaled levels of gases are in the sub-ppm range and very sensitive sensors have been developed with detection limits as low as 50 ppb for ammonia [40] and 200 ppb for CO [41].
The advent of optical frequency combs (OFC) enabled high resolution spectroscopy experiments by referencing mid-IR radiation of QCLs to fre-quency standards [42, 43] and the measurement of radiocarbon (14C) down to parts per trillion (ppt) was achieved at 4.5 µm [44].
Beside spectroscopy applications, mid-IR quantum cascade lasers might be used for optical communications. The atmosphere contains indeed two transmission windows between 3-5 µm and 8-14 µm showing low absorp-tion, and which could be used for free-space data transfers. A few exper-iments were performed and showed the feasibility of high data rates links based on mid-IR QCLs [45–48].
2.2
Spectral purity of semiconductor lasers
2.2.1
Frequency-noise in semiconductor lasers
The spectral properties of a laser are commonly described by its linewidth, i.e. the full width at half maximum (FWHM) of the optical lineshape. The linewidth of a laser can be experimentally determined from the het-erodyne beat with a reference laser source or by self-homodyne/hethet-erodyne interferometry using a long optical delay line [49]. The linewidth is a sin-gle parameter widely used to characterize the laser spectral properties, as it allows a simple and straightforward benchmark between different laser sources. However, this specific parameter gives an incomplete picture of the actual frequency stability. In particular, it contains poor information about the spectral distribution of the noise. This is in contrast to the power spectral density (PSD) of the laser frequency fluctuations, which gives a complete picture of the laser frequency noise, showing how the different noise spectral components contribute to the laser linewidth.
The measurement of the frequency noise requires an optical frequency discriminator to convert the laser frequency fluctuations into intensity fluctuations that can be measured with a photodiode. An optical fre-quency discriminator can be seen as a filter with frefre-quency-dependent transmission in a restricted frequency range, such as a gas-filled cell near an atomic/molecular resonance (Doppler-broadened [50–52] or sub-Doppler [53]), a Fabry-Perot resonator or an unbalanced two-beam interferometer.
As an alternative, the frequency-noise of the beat signal can be measured in the RF domain as well, using RF frequency discriminators [54].
In semiconductor lasers, the frequency-noise spectrum is generally split into two distinct regimes. The ultimate frequency-noise limit achievable in lasers is given by a white frequency-noise floor leading to the intrinsic linewidth, or Schawlow-Townes linewidth, and is due to quantum noise (spontaneous emission) in the gain medium of the laser oscillator. While this fundamental limit can be relatively narrow, the frequency-noise spec-trum in real semiconductor lasers is generally governed by excess 1/f fluc-tuations at low frequency that exceed the white noise floor and broaden the emission linewidth at reasonable observation times. Both Schawlow-Townes linewidth and 1/f noise in physical systems will be introduced later in this chapter.
2.2.2
Schawlow-Townes linewidth
The intrinsic linewidth, or Schawlow-Townes linewidth ∆νST represents the ultimate spectral width of a laser oscillator, limited by quantum noise due to spontaneous emission in the resonator gain. The relation can be written as [55, 56]:
∆νST =
2πhν0µ(∆νcav)2
P (2.3)
where hv0is the photon energy, µ = N2/(N2−N1) describes the population inversion, ∆νcav is the FWHM linewidth of the passive resonator, and P the output optical power. The intrinsic linewidth ∆νST of a laser oscillator can therefore be orders of magnitude narrower than the FWHM linewidth of the resonator ∆νcav. The intrinsic linewidth of an helium-neon (He-Ne) gas laser at 633 nm with a passive resonator linewidth of 8 MHz and 1 mW output power can be calculated to be narrower than 1 Hz [57].
The expression of the intrinsic linewidth was rewritten by Henry [58,59] for semiconductor lasers in order to take into account the dependence of the refractive index upon the carrier density in semiconductor materials. The intrinsic linewidth of semiconductor lasers is basically enhanced by a factor (1+αH)2, where αH is known as the linewidth enhancement factor. These aspects will be discussed in more details in Chapters 3 and 4.
Finally, it is extremely important to highlight the fact that, as stated before, the Schawlow-Townes linewidth represents a fundamental limit and
2.2. Spectral purity of semiconductor lasers
is most often not reached in real laser systems, which are exposed to addi-tional external perturbations. This is specially the case in semiconductor lasers for which the emission linewidth is broadened by low-frequency 1/f fluctuations (see [60, 61] and Chapters 4-5).
2.2.3
Frequency-noise to optical lineshape relation
From the frequency noise PSD, the laser lineshape and the linewidth may be retrieved, but the reverse process (i.e. determining the exact frequency noise spectrum from the lineshape) is not possible. However, the exact determination of the linewidth from the frequency noise spectral density is not always straightforward. This problem has been theoretically addressed for a long time [62–65] and involves a two-step integration procedure as detailed in [56, 62, 66]. The first step consists in calculating the auto-correlation function of the electrical field ΓE(τ ) as an exponential of the integral of the frequency noise PSD Sδν(f ) filtered by a sinc2 function [62]:
ΓE(τ ) = E02ei2πν0τe −2∞�
0
Sδν(f )sin2(πf τ )f 2 df
(2.4) Then, the optical spectrum SE(ν) is obtained by Fourier transform of the auto-correlation function ΓE(τ ):
SE(ν) = 2 � ∞
−∞
e−i2πντΓE(τ )dτ (2.5)
However, only the ideal case of a pure white frequency noise S0
δν can be analytically solved [63] and yields a Lorentzian lineshape with an FWHM linewidth:
∆νFWHM = πSδν0 (2.6)
This case corresponds for instance to the well-known lorentzian lineshape described by the Schawlow-Townes linewidth in Eq. 2.3 [55,59]. In all other cases, including real laser frequency noise spectra encountered in practice, the calculation must be performed by numerical integration.
A simple approximation to determine the linewidth of a laser from an arbitrary frequency noise spectrum was demonstrated in Ref. [66]. It was
1010 108 106 104 102 109 107 105 103 101 Sδν (f ) [ H z 2/H z] 101 102 103 104 105 106 107 Fourier frequency [Hz] 8 ln(2)A FWHM = = 562 kHz A 0 1 -1 FWHM = 625 kHz ν - ν0[MHz] SE ( ν ) -separ ation l ine β
Figure 2.5: Evaluation of the FWHM linewidth from the frequency-noise power spectral density (PSD) of a 4.6 µm QCL using the formal-ism of Ref. [66]. Inset: laser lineshape obtained through the two-step integration of the experimental frequency-noise PSD.
shown how the frequency noise PSD Sδν(f ) can be geometrically sepa-rated into slow and fast modulation areas by a single line displayed in Fig-ure 2.5, referred to as the β-separation line, defined as Sβ−line(f )≈ 0.56f. Frequency noise in these two areas has a completely different impact on the laser lineshape. Only the slow modulation area, for which Sδν(f ) > Sβ−line(f ), contributes to the linewidth of the signal. The fast modulation area Sδν(f ) < Sβ−line(f ) only affects the wings of the lineshape, without contributing to the FWHM linewidth. As a result, the linewidth ∆ν can be approximated with a good accuracy (better than 10%) from the integral A of the slow modulation area as introduced in Ref. [66]:
∆ν =�8 ln(2)A (2.7)
The surface A corresponds to the area under the frequency noise PSD obtained for all Fourier frequencies for which Sδν(f ) exceeds the β-line as shown in Figure 2.5. A low-frequency cut-off fchas to be introduced, which represents the inverse of the observation time τ0 in which the linewidth is measured (fc = 1/τ0), when the frequency noise PSD is affected by 1/f noise (A diverges when fc → 0). Moreover, this observation also shows that the linewidth of lasers broadened by 1/f noise depends on the observation time. A linewidth should therefore always be specified with the considered observation time. However, while the observation time has an important
2.3. 1/f fluctuations in physical systems
impact when its value is close to the inverse of the crossing point of the frequency-noise PSD with the β-line, the linewidth only slowly diverges and can almost be considered as constant for observation times in the 0.1-10 s range for frequency-noise PSD of typical free-running semiconductor lasers. This formalism was demonstrated to yield a good accuracy of the calculated linewidth with different laser systems [67] and will be used many times along this thesis in order to estimate QCL linewidths from frequency-noise measurements.
2.3
1/f fluctuations in physical systems
1/f noise, also sometimes referred to as flicker noise, or pink noise, describes a stochastic process in which the power spectral density S(f ) follows a power law in the form:
S(f ) = Constant
fα (2.8)
where f is the frequency and α generally takes a value comprised be-tween 0.5 and 1.5. In other words, such noise phenomena are charac-terized by equally distributed fluctuations of relatively high magnitude at low-frequencies, or long time scales, and small fluctuations at higher fre-quencies, or short time scales. This behavior is illustrated in Figure 2.6, which shows the power spectral density of fluctuations characterized by a dependence in 1/fα (α = 1 in this case).
1/f noise is often associated to semiconductors where it plays an im-portant role on the performances of electronic devices. However, since the first observation of 1/f fluctuations in vacuum tubes by Johnson during the 30’s [68, 69], it is interesting to point out that this form of fluctuations was reported in many physical systems. It is for instance the case in geophysi-cal systems, where 1/f -like power spectra were reported for undercurrents measured over 152 days at a depth of 3100 m in the middle of the Pacific Ocean [70] (see Figure 2.6), as well as for the fluctuations of sea level at Bermuda measured over 8 years [71]. The interplanetary magnetic field was also shown to follow a similar power law [72].
Fluctuations of audio power in music was investigated in different radio stations of various music styles and showed 1/f -like power spectra [73, 74]. A same behavior was reported for the shots structure in Hollywood
movies [75]. These two additional examples of 1/f fluctuations lead to similar observations made in biological systems. Fluctuations in the human heart beat rate [76], neural activity [77, 78] and even human cognition [79] were shown to follow 1/f power laws.
!"# !"$ !"! !"" !"%# !"%$ !"%! !"" &'()*(+,-./,-,0(1.2%!3 456('.17(,8'90.:(+1;8-./,<.1 %!3 . $.=./,-,0(1.2 %!3
Figure 2.6: Power spectral density of east-west undercurrents velocity at a depth of 3100 m at 1◦02’S,149◦50’W, reproduced from [70].
Beside the somehow universal character of 1/f fluctuations observed in many different physical systems, another puzzling aspect relates to diver-gence of the power spectral density at low frequencies. A few experimental attempts aiming at assessing the continuity of 1/f noise processes were carried out with for instance thin-film resistors, and showed almost perfect 1/f spectra over six frequency decades [80]. Noise measurements of an array of operational amplifiers were even performed during a few months and down to Fourier frequencies as low as 0.5 µHz [81], but did not show any flattening of the noise spectra.
At low frequency, the power spectral density of 1/f noise diverges and could lead to infinitely large fluctuations. This was expressed jokingly in the review on flicker noises of Ref. [82] as “If you postpone your Bermuda vacation for too long, the island may be underwater!”. However, a relatively simple argument was given in Ref. [83] in order to put in perspective the magnitude of low frequency fluctuations. For a pure 1/f spectrum, the
2.3. 1/f fluctuations in physical systems
integrated fluctuations of each frequency decade are equal to each others, and the total fluctuation is given by:
� f1 f0 1 f df = ln � f1 f0 � (2.9) Considering the lowest observable frequency as the inverse of the universe lifetime (≈ 109years≈ 3 · 1016s) and the inverse of Plank’s time (5· 10−44s) as the highest observable frequency, the total fluctuation would be approx-imately only ln(1060)/ ln(10) = 60 times the integrated fluctuation of one frequency decade, e.g. from 1 to 10 Hz. This simple approximation shows that the mathematical divergence of 1/f noise has no real impact on phys-ical systems in reasonable time scales.
1/f fluctuations in electronic devices were of course extensively inves-tigated and have occupied scientists’ mind for a long time. Low-frequency fluctuation showing 1/f power spectra were already reported a long time ago in vacuum tubes [68, 84], p-n germanium junctions and carbon resis-tors [84], as well as in metallic thin-films [85–87] and semiconductor ho-mogenous samples [88]. A few models were proposed in order to explain 1/f noise in homogenous semiconductor and MOS transistors, and gen-erally confront mobility fluctuations ∆µ to carrier numbers fluctuations ∆N , which are associated either to bulk or surface effects, respectively. McWorther proposed a model involving trapping et detrapping of carriers at the Si-SiO2 interface of MOS transistors and explained 1/f fluctuations by changes of the number of carriers [89]. The idea behind this model is a sum of spectra with a wide distribution of relaxation times, the probability that an electron reaches a trap in the oxide being τ = τ0ex/d, where x is the distance between the traps and the interface, and d is a characteristic of the tunneling process.
On the other hand, Hooge proposed in 1969 the following empirical relation for the power spectral density S of flicker noise in homogenous semiconductors [90]: SR R2 = SI I2 = SV V2 = α f N (2.10)
where f is the Fourier frequency, N is the total amount of carriers in the sample, and α is a parameter that was first believed to be constant. α values on the order of 2· 10−3 were indeed measured in several III-V semiconductors such as p-type and n-type InSb, GaSb, GaAs and GaP [88].
Later, it was demonstrated that α strongly depends on the quality of the crystal as well as on the scattering processes determining the mobility [91]. Despite some attempts at unifying the two theories [92] and recursive discussions about the effect of carriers number and mobility fluctuations in MOS transistors [93], various experimental results support so far both bulk and surface-state effects [94] and it seems difficult at this point to conclude on the supremacy of one of these models. In the light of the universal character of 1/f fluctuations in physical systems, it is also important to emphasize that the underlying physical mechanisms might very well be different from a system to another, despite the manifestation of similar 1/f -like power laws [95].
The investigation of low-frequency noise processes in solid-state devices is nowadays still of prime interest for the realization of low-noise electronic devices for telecommunications, consumer electronics and sensors. It is particularly the case of semiconductor lasers, which will be discussed in Chapters 4 and 5. Low-frequency fluctuations were also more recently stud-ied in GaN/AlGaN high electron mobility transistors [96,97] and graphene solid-state devices [98], in which 1/f noise was even used as a signal for sensing applications [99].
2.4
List of QCLs used in this work
Different distributed-feedback QCLs provided by Alpes Laser SA emitting around λ = 4.55 µm were used throughout this work. Optical powers ranging from 5 to 15 mW were obtained at room-temperature. The devices are listed along with their manufacturing number in Table 2.1.
Device Processing Mounting ith1 Used in
sbcw2689 Ridge-waveguide epi-side up 300 mA Chap. 3, 4, 5 sbcw2694 Ridge-waveguide epi-side up 355 mA Chap. 4, 5 sbcw3661 Buried-heterostructure epi-side up 140 mA Chap. 5 sbcw4210 Buried-heterostructure epi-side up 200 mA Chap. 5, 6
1 at 283 K
Chapter 3
Wavelength tuning and
thermal dynamics of CW
QCLs
In this chapter, the dynamic behavior of the optical frequency and temper-ature in continuous wave (CW) mid-IR DFB-QCLs under direct current modulation is presented. Frequency modulation of single-mode semicon-ductor lasers is important for several applications, such as optical communi-cations [100], and also for advanced enhancement techniques in absorption spectroscopy for trace-gas sensing [101]. In the framework of this thesis, two other main interests motivate the study of the frequency-modulation response of QCLs:
• Narrow linewidth sources of coherent light in the mid-IR, required to push the limits of high-resolution spectroscopy and metrology, can be achieved by active stabilization of DFB-QCLs to optical references with high-bandwidth servo-loops. The frequency-modulation band-width can affect the feedback loop bandband-widths and therefore limit the ultimate achievable performances in terms of linewidth narrow-ing [102].
• The dynamic response of the optical frequency is of prime interest to gain a deeper insight in the origin of frequency instabilities in QCLs. The study of the dynamic response gives access to the thermal dynamics in the QCL structure and allows the identification of the different thermal mechanisms involved in the appearance of frequency instabilities and frequency noise in DFB-QCLs.
Despite the fact that the thermal resistance and the heat extraction in pulsed QCLs have been deeply investigated [103–105], this chapter also enables the dynamics of thermal effects in CW DFB-QCLs under direct current modulation to be discussed.
3.1
Basics of frequency-modulation
Let us consider pure frequency-modulation of the light field, whose instan-taneous frequency is given by Eq. 3.1 where ∆ν is the frequency excursion and fm the modulation frequency. The modulation index β is defined in Eq. 3.2 as the ratio of the frequency excursion to the modulation frequency.
ν(t) = ν0+ ∆ν cos(2πfmt) (3.1)
β = ∆ν fm
(3.2) The electrical field can be expanded as a series of Bessel functions of the first kind Jn(β) [56, 106], and its explicit development is shown in Eq. 3.4.
E(t) = E0 ∞ � n=−∞ ��Jn(β)e2πi(ν0+nfm)t � (3.3) E(t) = E0{J0(β) cos(2πν0) (3.4) + J1(β)[cos(2π(ν0+ fm)t)− cos(2π(ν0 − fm)t)] + J2(β)[cos(2π(ν0+ 2fm)t) + cos(2π(ν0− 2fm)t)] + J3(β)[cos(2π(ν0+ 3fm)t)− cos(2π(ν0− 3fm)t)] + J4(β)[cos(2π(ν0+ 4fm)t) + cos(2π(ν0− 4fm)t)] + ...}
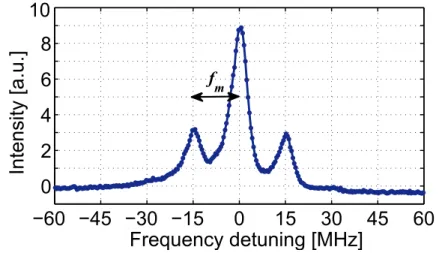
Eq. 3.4 shows that the spectrum of a frequency-modulated electrical field is composed of an infinity of equally spaced sidebands at integer mul-tiples nfm of the modulation frequency. Moreover, for a given modulation index β, the relative amplitude of the nth sidebands with respect to the carrier can be simply deduced from the ratio of the corresponding Bessel functions Jn(β) to J0(β).
3.2. Frequency modulation of DFB lasers
3.2
Frequency modulation of DFB lasers
3.2.1
Interband semiconductor lasers
Frequency-modulation (FM) of interband DFB laser diodes under direct current modulation was extensively investigated in devices emitting in the near-IR [107, 108], at 1.3 µm [108, 109] and at 1.5 µm [110–112]. Two main mechanisms are responsible for frequency-tuning in semiconductor lasers based on interband transitions, namely a thermal effect and a carrier density effect.
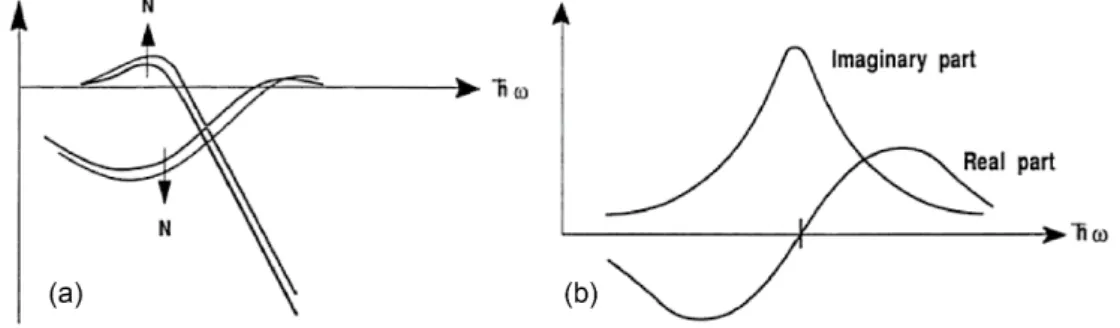
Figure 3.1: Real and complex part of the refractive index in (a) in-terband and (b) intersubband transitions as a function of the photon energy. Reproduced from [113].
Thermal effect
The temperature-dependent refractive index of the semiconductor materials forming the laser cavity is directly linked to the effective op-tical length of the resonator and is the main contributor to frequency tuning. The relative change in optical frequency is given by:
1 ν
dν
dT =−(αn+ αL) (3.5)
where αnis the relative refractive index temperature coefficient and αL is the linear expansion coefficient. The relative change in refrac-tive index of InP with respect to temperature is on the order of 5.5· 10−5 K−1, whereas the linear expansion coefficient is one order of magnitude smaller [114]. From Eq. 3.5, typical frequency tuning coefficient of 12 GHz/K can be calculated for DFB lasers at 1.5 µm. This effect is relatively slow since it is limited by the thermal time constant required to change the temperature in the laser chip.
The thermal contribution to the frequency modulation was experi-mentally investigated and analytical models of the heat conduction in simplified laser structures were developed [107, 115]. The band-width of this effect depends on the laser structure and is limited to frequencies below 1 MHz [116].
Carrier density
The refractive index of the laser resonator and its emission frequency depend on the carrier density N , and therefore on the injection cur-rent. Indeed, the gain curve is not symmetric in interband semi-conductor lasers and its peak shifts towards higher photon energies when the carrier density increases. As a result, the real part of the refractive index, and therefore the emission frequency, depends on the carrier density as shown in Figure 3.1 [113].
This effect is usually quantified using the α parameter (αe or αH are sometimes used), which is defined as the ratio of the change of the real part nr to the imaginary part ni of the refractive index with respect to the carrier density N :
α = dnr dN
�dni
dN (3.6)
The dynamic of this effect relies on the lifetime of the carriers, which is in the nanosecond range [117], and is much faster than the ther-mal effect. Typical frequency modulation bandwidths in the GHz regime have been reported in near-IR laser diodes [107, 110]. Multi-section devices with multiple electrodes for selective carrier density modulation have been investigated [118], and frequency modulation bandwidths up to 15 GHz [119] have been achieved using such de-signs.
The combined effects of temperature and carrier density on the fre-quency modulation of a singlemode AlGaAs DFB semiconductor laser emit-ting at 840 nm is shown in Figure 3.2 [107]. The dashed line represents the thermal effect, showing a thermal cut-off frequency in the MHz range, while the solid line denotes the effect of charge carriers at higher frequencies.
3.2. Frequency modulation of DFB lasers
Figure 3.2: Frequency-modulation response of a singlemode AlGaAs DFB laser at 842 nm [107]. At low frequencies, the FM response is mainly governed by thermal effects (dashed line). Above 10 MHz, the solid line denotes the carrier-density effect.
3.2.2
Intersubband semiconductor lasers
In QCLs, the picture is fundamentally different. Unlike interband transi-tions, the gain curve of intersubband transitions is symmetric. As shown in Figure 3.1, the associated refractive index is independent in that case of the carrier density at the gain peak, which results in a zero, or close-to-zero alpha parameter [120, 121]. The tuning of the optical frequency -or wavelength- of DFB-QCLs is therefore mainly governed by the tempera-ture dependence of the average refractive index of the active region, with a typical tuning-rate on the order of 1/λ dλ/dT = 7· 10−5 1/K [26]. This value leads to temperature tuning coefficients βT = ∆ν/∆T on the order of 4.5 GHz/K at 4.6 µm and 2.8 GHz/K at 8 µm.
The effect of the injection current on the laser frequency tuning can then be inferred from Eq. 3.7:
∆ν = βT∆T = βTRth∆P (3.7)
where Rth is the thermal resistance and ∆P is the dissipated electrical power (defined in Eq. 3.8 as a function of the current modulation ∆i, bias current i0, voltage U0, and differential resistance Rd).
∆P = (U0+ Rdi0)∆i + Rd∆i2 (3.8) The current tuning coefficients depends on both the thermal resistance and the electrical characteristics of the QCLs. Typical values are comprised between 200 MHz/mA and 1 GHz/mA.
While the picosecond carrier lifetime in QCLs allows a very fast in-tensity modulation above 10 GHz [46, 122], the ability to modulate the frequency of a QCL with the drive current is limited by the thermal time constants of the semiconductor structure, i.e. the time required for the temperature to follow the modulation of the dissipated electrical power.
3.3
Frequency-modulation characterization
Several methods can be used to measure the frequency modulation response of a laser such as Fabry-Perot [107] or Michelson [123] interferometers. Here, the frequency response of QCLs under direct current modulation was measured using single-pass direct absorption spectroscopy, as shown in Figure 3.3. The QCL beam passes through a cell filled with a refer-ence gas at low pressure, e.g. carbon dioxide (CO2) or carbon monoxide (CO). The emission frequency is tuned to the flank of the respective molec-ular absorption line, which acts as a frequency-sensitive element. At this point, the frequency fluctuations of the laser are converted into intensity fluctuations that are detected with a photodiode.
QCL
Mod. input
Gas cell Detector Lock-in amplifer Laser Driver i0 + imod Ref. Input (a) (b) T ra n sm issi o n Frequency Figure 3.3: (a) FM response measurement setup. The frequency excur-sion ∆ν of the optical carrier at 4.55 µm (ν ≈ 66 THz) is measured as a function of the current modulation frequency fm. (b) Frequency-to-intensity conversion principle.
The conversion factor, or frequency discriminator, is given by the slope of the absorption line. Similar setups were used for frequency-noise
char-3.3. Frequency-modulation characterization
acterization of free-running mid-IR [52, 124] and THz [125] QCLs and a complete description can be found in Chapter 4.
For the measurements presented here, the current of the QCLs was modulated from 100 Hz up to several MHz and the associated laser fre-quency modulation was measured in magnitude and phase using a lock-in amplifier. A small sinusoidal modulation imod on the order of 0.2 mA peak-to-peak was used in order to keep the laser frequency in the linear range of the molecular absorption line and avoid any distortion of the output signal. The current driver and the photodiode benefit from bandwidths of sev-eral MHz and more than 50 MHz, respectively, and allow the measurement of the frequency modulation response up to several MHz without intro-ducing any additional roll-off. Nevertheless, the laser intensity modulation response measured by detuning the laser out of the resonance was used to scale the magnitude and compensate for the slight phase shift introduced by the current driver at higher frequencies so that it reflects the dynamic response of the laser frequency only, as in Ref. [126].
Two QCLs from different suppliers were characterized and compared. The first one is the same ridge waveguide DFB-QCL used in Ref. [52] and Chapter 4 (epi-side up), emitting at 4.55 µm. The second one is a 4.33 µm ridge-waveguide DFB-QCL from Hamamatsu Photonics (epi-side down). The measurements of this second device were performed in Italy, at LENS (European Laboratory for Nonlinear Spectroscopy). These two devices are labeled QCL1 and QCL2 respectively, and their main charac-teristics are listed in Table 3.1. QCL1 was mounted in a cryostat and its frequency-response was measured over a broad temperature range, from 283 K down to 95 K. QCL2 was mounted in a sealed package and its frequency response was measured at 285 K.
Device Supplier λ epi-side ith1 i01 P01
QCL1 Alpes Lasers 4.55 µm up 300 mA 350 mA 5 mW
QCL2 Hamamatsu 4.33 µm down 660 mA 710 mA 5 mW
1 at 283 K
3.4
Frequency-modulation response
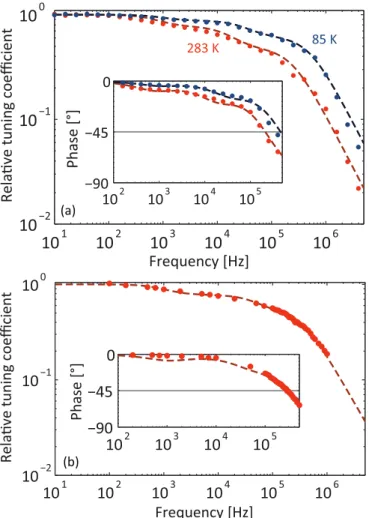
The frequency modulation response of QCL1 and QCL2 under direct cur-rent modulation is disclosed in Figure 3.4(a) and Figure 3.4(b), respectively. The two devices show similar a behavior. In the high-frequency region, a clear roll-off of -20 dB/decade and its associated phase shift are observed, in both cases beyond 200 kHz. In the low-frequency region, it is important to note that the frequency-response is not flat and differs from a first order low-pass filter. Indeed, a roll-off of a few dB/decade in the magnitude as well as a non-negligible phase shift are observed above a few hundred Hz already. 101 102 103 104 105 106 10−2 10−1 100 Frequency [Hz] Re la " v e tu n in g c o e ffi ci en t 102 103 104 105 −90 −45 0 P h as e [ °] 85 K 283 K (a) 101 102 103 104 105 106 10−2 10−1 100 Frequency [Hz] Re la " v e t u n in g c o e ffi ci en t 102 103 104 105 −90 −45 0 P h as e [ °] (b)
Figure 3.4: Relative frequency-modulation response of (a) QCL1 (at 283 K and 85 K) and (b) QCL2 (at 283 K) under direct current mod-ulation (∆ipp = 0.2 mA) and fitted model (dashed lines). The phase shift between frequency- and current-modulation is shown in the inset.
3.5. Thermal model
At room-temperature, the frequency-modulation bandwidth of QCL2 is slightly higher than the one of QCL1. The frequency at which the phase shift reaches -45◦ is 200 kHz for QCL1 and 300 kHz for QCL2 while the attenuation of the tuning coefficient is pretty strong and reaches a factor of 2 with respect to the DC value already at modulation frequencies lower than 100 kHz. It is important to note that one order of magnitude separates the -45◦ and -3dB frequencies, which supports the observation that the dynamic-response is not governed by a simple one-pole low-pass filter.
The dynamic response of QCL1 was also measured over a broad tem-perature range, from 283 K down to 85 K, and is reported in Figure 3.4(a) for these two temperature values. We observe that when the tempera-ture is lowered, the modulation bandwidth increases and both the low-frequency roll-off and phase shift become smaller. The -45◦ frequency in-creases from 200 kHz at room-temperature up to 400 kHz at 85 K. More-over, the dynamic response at 85 K is qualitatively closer to a first order low-pass filter, with a weaker roll-off in the low-frequency range.
3.5
Thermal model
In order to have a deeper understanding of the observed dynamic responses and especially of the roll-off and phase shift at low frequency, a thermal model was used to fit the experimental data in magnitude and phase.
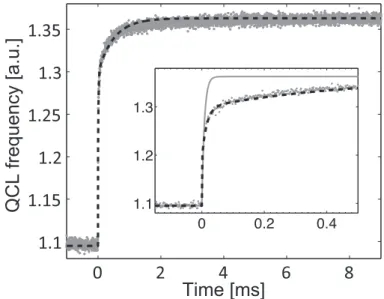
A similar behavior was observed with interband semiconductor DFB lasers (see Figure 3.2), and various analytical models were derived [107, 115, 116] in order to explain the thermal dynamics in these structures. In contrast to previous analytical models, a simple thermal response R(f ) (Eq. 3.9) consisting of three cascaded first-order low-pass filters of characteristics frequencies fi (Eq. 3.10) is considered here. The model is illustrated in Figure 3.5. R(f ) = ∆T ∆P(f ) = 3 � i=1 Ri 1 + jff i (3.9) fi = 1 2πRiCi (3.10) The fitted model is plotted along with the measured frequency modu-lation responses in Figure 3.4 and shows a good agreement with both the
![Figure 2.2: Active region design employed for the first demonstration of a QCL in 1994 [1].](https://thumb-eu.123doks.com/thumbv2/123doknet/15020593.683073/31.892.224.686.408.705/figure-active-region-design-employed-demonstration-qcl.webp)
![Figure 2.6: Power spectral density of east-west undercurrents velocity at a depth of 3100 m at 1 ◦ 02’S,149 ◦ 50’W, reproduced from [70].](https://thumb-eu.123doks.com/thumbv2/123doknet/15020593.683073/40.892.263.631.304.657/figure-power-spectral-density-undercurrents-velocity-depth-reproduced.webp)