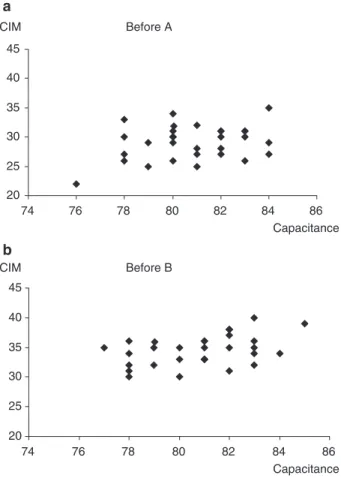
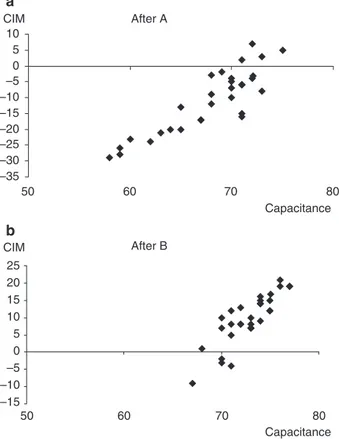
Responsive corneosurfametry following in vivo skin preconditioning.
Texte intégral
Figure


Documents relatifs
An implementation of the Kubelka-Munk model combined with Saunderson correction allows measuring six parameters of Caucasian skin: epidermis thickness, melanin volume fraction,
L’archive ouverte pluridisciplinaire HAL, est destinée au dépôt et à la diffusion de documents scientifiques de niveau recherche, publiés ou non, émanant des
According to Limbert’s review ([5]), the mathematical and computational models of the human skin can be classified into three main categories : phenomenological, structural
The quantitative agreement between measurements of this local stretch ratio and of the macroscopic stretch ratio proved that the global deformation was fully transmitted to the
In recent years much has been written concerning the widening gap between the newer developments in mathematics and the traditional mathematics taught in
Effectiveness of hand washing on the removal of iron oxide nanoparticles from human skin ex vivo.. Nastassja Lewinski, Aurélie Berthet, Lionel Maurizi, Antoine Eisenbeis,
Comparison between simulations (dashed lines) assuming different initial volumetric fractions of solid particles (ε 0 ) and the actual deposit (solid line) of the (a) EU3pf unit S
Figure 4: A External temperature changes before exposure initial T and after exposure final T for the exposed groups of rats during the first E1 and the second E2 experiment..