Volume XII Number 3, 2020
Recent Evolution of Perennial Crop Farms: Evidence from Dak Lak
Province, Vietnam
Phan Thi Thuy1,2, Le Duc Niem1, Philippe Lebailly2
1 Faculty of Economics, Tay Nguyen University, Buon Ma Thuot, Vietnam
2 Economic and Rural Development, Gembloux Agro-Bio Tech, University Liège, Gembloux, Belgium
Abstract
There is a great consensus about the crucial role of perennial crops in an agricultural economy of a country. The paper aims (1) to identify the differences in the costs and profits of perennial crops produced by two study groups, a group producing coffee (GpC) and a group producing pepper (GpP) over two crop years 2016/2017-2017/2018; (2) evaluate the evolution of the economic performance of each group during two years; and (3) examine factors influencing the farm profitability. By using the mixed data from a household survey conducted in three sub-regions of Dak Lak province, Vietnam, a financial verification is used to explore the economic incentives between two groups and a discriminant analysis is undertaken to classify the determinants of the farm profitability. The results perform that the GpC is generally lower input costs and economic benefits than the GpP. The decrease of economic indicators of the GpP during two years, meanwhile, is more significant than that of the GpC in the same period. In addition, the GpP is likely to invest more inputs, heavily use chemical cost, be more susceptible to pests and diseases, and the volatile market conditions in comparison to the GpC. Categorically, the variable cost and reduction rate in terms of value-added, net farm income (NFI), profit, labor productivity, and the ratio of NFI to family labor of the GpC have lower than those of the GpP, respectively, during two years. Furthermore, in similarly conditional practices, the perennial crop farms generate different returns depending on experience, training, other income, and gross outputs. The findings provide information for farmers to make accurate decision about coffee and pepper farms production as recommended by reducing the quantity of fertilizers, allocating resources and diversifying crop systems. Additionally, the empirical results also offer policymakers the farms sustainable development at local and national levels. Going forward, authors suggest these factors be considered in the future.
Keywords
Evolution, economic performance, coffee and pepper farms, Vietnam.
Thuy, P. T., Niem, L. D. and Lebailly, P. (2020) “Recent Evolution of Perennial Crop Farms: Evidence From Dak Lak Province, Vietnam", AGRIS on-line Papers in Economics and Informatics, Vol. 12, No. 3, pp. 87-100. ISSN 1804-1930. DOI 10.7160/aol.2020.120308.
Introduction
The various dimensions of the vital role of perennial crops in the livelihood and export earnings are well captured in the literature. For example, perennial crops subsidized significantly to food, fuel, goods for export, and jobs, as well as environmental and cultural benefits. In addition, perennial crops contributed to the reducing deforestation (Peter et al., 2003; Angelsen, 2010; Dinh et al., 2017). On the other side, the practices of agricultural sector, in general, and cropping system, in particular, had undergone the times, the local, regional, international economic situation by ecological, socio-economic transformation (FAO, 1999).
Yet, there are limitations on empirical evidence of economic changes of perennial crop farms. In Vietnam, perennial crops introduced at the end of the nineteenth century by the French. Currently, these products have become major commodities and driving forces for economic growth and export earnings. As statistical data, perennial crop growing area reached over 2.2 million hectares, in which approximately 1.8 million hectares produce over 4 million tons including coffee, pepper, rubber, cashew and tea, concentrate largely on the Central Highlands, namely Dak Lak, Dak Nong, Gia Lai, Lam Dong, and Kon Tum provinces thanks to the favorable conditions (GSO, 2019).
Over the past quarter century, the agricultural sector has developed such significance that many countries tried to learn from those Vietnamese successes, in which perennial crop section reached explosive growth of export earnings. Since 2000s, Vietnam ranked among the top five global exporters of perennial crop products. For instance, Vietnam was one of the world’s largest producer of coffee and the world’s leading exporter of black pepper made up relatively 1490 and 100 thousand tons, earning 2880 and 134 million USD in 2017 –2018, respectively (GSO, 2019; JICA, 2012). Notwithstanding, other authors such as (Slater et al., 2007; Ha and Shively, 2008) demonstrated that the perennial crop production may face many difficulties (i.e., production is smallholders and susceptibility to natural disasters and vulnerabilities from trade fluctuation). Thus, challenges of perennial crop production lead to reduction of households’ income, as well as significant negative impacts on the national economy. Meanwhile, the perennial crops are not well-adapted into other types of farming due to their long economic lifespans and high startup costs (Thuy et al., 2019 a; Gunathilaka et al., 2018). Consequently, understanding the evolution of cropping system is essential to raise farm productivity, identify the management practices and provide the ensuring farmers’ income in the future (Herridge et al. 2019; Stillitano et al. 2019).
Dak Lak province has the largest basalt soil area to create extremely advantageous conditions for well-grown perennial crops. Remarkably, coffee productivity dominated at about 30% while pepper output occupied approximately 40% for the whole country in 2018 (GSO, 2019). Over the years, perennial crops have changed dramatically being usual dynamic of requirement. Despite its advantages and positive development trends, provincial perennial crop production has faced with numerous constraints due to price fluctuations, climate changes, and pests and diseases. Meanwhile, most literature only focused more on coffee farming and have a few studies compare monetary benefits between perennial crop farm approaches (Chau, 2007; Thi Duong Nga and Thuy, 2017; Ho et al., 2017; Thuy et al 2019b). In overall, there is an obvious need to know the economic earnings and evolution of two group producing perennial crops in order to understand how changes and how well of each perennial crop group during a period.
This study focuses on comparing the economic performance of two groups, a group producing
coffee (GpC), which is categorized into coffee specialized farms and diversified farms, where both kinds of farms have the similar about the practices and characters such as the age, input items, and calendar as well as are dominant approaches in research sites, and a group producing pepper (GpP) which is categorized into pepper specialized farms and diversified farms. Another aim is to monitor the evolution of economic viability across two groups of 2016/2017 –2017/2018. The remaining part of this paper highlights factors affecting farm profitability. The results provide empirical evidence to design perennial crop production strategies regarding what they grow and how they grow under real-life conditions. Furthermore, the negative and positive determinants need to decrease or improve for the coming years.
Materials and methods
Selection of study sites
Classification of regions depends on the ecological and suitable land criteria (fertility capacity classification)
Source: Author’s creation and adapted from (Thong et al, 2017) Figure 1: The distribution of perennial crop in Dak Lak province
According to (FAO, 1999), to obtain the identification and localization of agro-ecological, and socio-economic situation in the different systems, selected zones should have similar characteristics. Furthermore, in terms of agriculture, cropping system analysis is carried out on smaller communes or villages to achieve the same resources and examine properly cropping systems (Diepart and Céline, 2018). This study is operating in Buon Ma Thuot city, CuMgar and CuKuin districts of Dak Lak, which have homogeneous fertility and adequate weather conditions, the largest of coffee area (CuMgar), the third largest of pepper area (CuKuin); and favorable market conditions, transportation, agri-services and the longest history of perennial crop production (Buon Ma Thuot city). Three sub-regions have dominant coffee and pepper approaches of specialized and diversified farms. Therefore, from three sub-regions, three communes and three villages are chosen based on the popular level of coffee and pepper farms. This information is provided by local authority discussion. In other words, the existence level of above two groups of coffee and pepper is the criterion to select the communes and villages.
Stratification of perennial crop systems/ Target perennial crop systems selection
As (Barral, 2012), in the limitations on time and resources, it is better to confine the number of cropping systems study rather than implement many cropping systems in order to reach the accurate information. In this study, our effort concentrated on the coffee and pepper farms and the study used the cross-sectional data in 2016/2017 and 2017/2018.
Selection of surveyed farms and households
Selected farms
Regarding the sample size, it depends on the provincially farm scale. As statistical data,
over 90% of producers hold around 1.5 hectares per households. Thus, in order to have exact and detailed analyses, the selected perennial crop systems are from 0.5 to 2 hectares with farms age over three years. The first group is labeled the group producing coffee (GpC). Similarly, the second group is called the group producing pepper (GpP).
Sample size
According to (Diepart and Céline, 2018), there is no rule about the household sample size of the research sites. Yet, as reported by (Salvatore and Reagle, 2002), selected households (n = 0.1*N, with N: populated size or statistical units) could have the same probability of being selected. For instance, if the sample rate is 10%, meaning the sample size represents 10% of population (FAO, 2016).
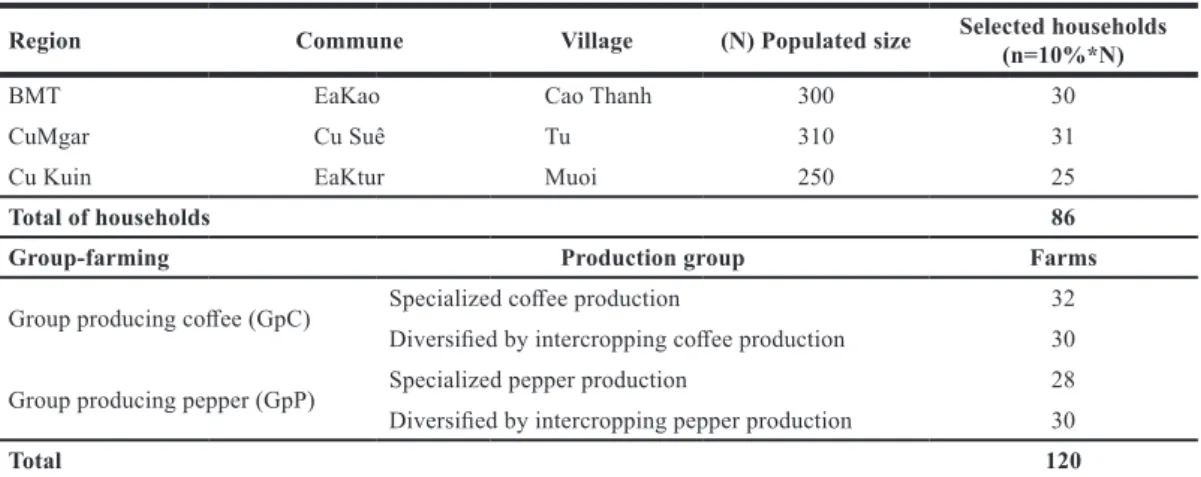
From the list of perennial crop farmers in the villages, by using the random sampling method, the coffee and pepper producers including specialized and diversified items are collected. At the end of this process, the total farmers are gathered making up 86 households. However, because each household often owns more than one plot in surveyed regions, total number of plots is larger than number of interviewees. The sample distribution is presented in the Table 1.
In-depth interviews, Focus Group Discussion and face-to-face interview techniques as follows:
- In-depth interviews: Key people, such as elderly people, heads of communes and villages, and experienced farmers, are selected as subjects to provide preliminary information in the research sites via intensive individual interviews;
- Focus Group Discussions (FGDs): one FGD is conducted in each surveyed commune with 6 - 8 farmers to explore the historical trends in perennial crop production and marketing practices;
Region Commune Village (N) Populated size Selected households (n=10%*N)
BMT EaKao Cao Thanh 300 30
CuMgar Cu Suê Tu 310 31
Cu Kuin EaKtur Muoi 250 25
Total of households 86
Group-farming Production group Farms
Group producing coffee (GpC) Specialized coffee production 32
Diversified by intercropping coffee production 30
Group producing pepper (GpP) Specialized pepper production 28
Diversified by intercropping pepper production 30
Total 120
Source: own processing
- Household surveys: a questionnaire is used to collect information about demographics and household characteristics, input and output data, and socio-economic profiles relating to perennial crop production. The field surveys were conducted into two stages of two crop years in 2017/2018 and 2018/2019.
Data analysis
Analysis method
In this research, farm profile, cost-return and comparative analyses are used to identify the differences in economic performance of the two groups and discover the changes of costs and benefits in each group during two crop years, in addition to descriptive statistical analysis such as percentages, means, charts and growth rate. By using cost benefit analysis (CBA), many indicators such as production cost, revenue, value added and profit are computed to indicate which group have the best economic performance and how the changes of each groups during two crop years under similar practices. CBA refers to have a systematic approach to make decisions on which group creates more benefits as well as whether or not implement an investment under limited resources (Quah and Mishan, 2007; Odum, 1983). Meanwhile, the economic performance indicators are a foundational requirement for enhancing market efficiency and decision-making (FAO, 2016). This analysis utilizes the Mann–Whitney test to examine the significant difference between two independent groups (GpC and GpP) and dependent variables including input cost items and economic performance indicators. Alternatively, in this study, the Mann-Whitney test uses to understand whether continuous dependent variables, which are namely production cost items, gross output, net value added, net farm income, profit, labor productivity and GO/IC, differ based on two group of the GpC and the GpP or not. The calculation of costs and benefits is to follow some authors (Hill and Bradley, 2015; Newton et al., 2012 ; Cochet, 2015). The statistical tool SPSS 22.0 version is used to analyze the data.
Econometric analysis
The objective of this study is to find main factors affecting the farm profitability. In other words, the study has attempted to understand why some perennial crop farms are more profitable than others. Alternatively, in this study, the determinant analysis measured the impact of factors on farm profitability by examining differences among
two groups categories, including (Non-profit <0: failure group; Profit >0: successful group (No case of profit=0)).
In literature, many factors have been found to be significant in explaining the farm profitability. (Tey and Brindal (2015) found that these factors related to management and financial capacity, farm resource quality and operations, farm and financial management and skills. Meanwhile, Lan et al. (2018) argued that the different profitability could be relied on crop typologies, input access and prices, households types and local context.
In this study, most of failure farms belong to ethnic households. Therefore, we expect there are differences in both farm practices. In other words, we suppose socio-economic characteristics between Kinh and other groups are driving forces for the changes of farm profitability, in which skills such as practical experience and training attempt to understand. It noted that the Kinh group is in the majority while the other groups is indigenous and migrated households (Thai, 2018). Moreover, the economic condition as Gross output, which is controlled by the crop price and yield, is another factor (Lososová and Zdenek, 2014). Note that the data, which is only in 2017/2018 year, utilizes to examine the changes of farm profitability. There is, therefore, a constant of selling price. The output is hypothesized by the effect of yield, where crop and farm profiles can be reasons such as soil, pests and diseases, and age of trees (Ho et al, 2018) (Table 2).
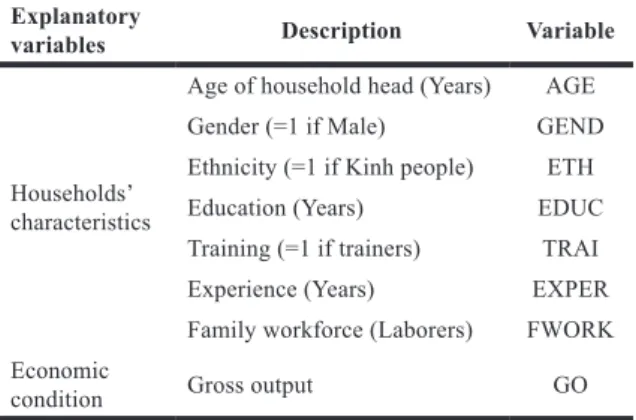
Explanatory
variables Description Variable
Households’ characteristics
Age of household head (Years) AGE Gender (=1 if Male) GEND Ethnicity (=1 if Kinh people) ETH
Education (Years) EDUC
Training (=1 if trainers) TRAI
Experience (Years) EXPER
Family workforce (Laborers) FWORK Economic
condition Gross output GO
Source: own processing
Table 2: Variables description.
For qualitative variables, a change from 0 to 1, leaving all other variables constant at their mean is reported. Specifically, GEND is a dummy variable that presents the gender of the farmer; it has a value of 1 for men and 0 for women. ETH is also a dummy variable to measure
the ethnicity of households. It takes the value 1, if the households are majority group of Kinh people; 0, if they are indigenous and migrated people. It is expected that the majority group get higher benefits than the others. TRAI measures the farmers participating in training program and applying knowledge for their farms. It takes the value of 1 if the farmer participates in training programs, and 0 if otherwise. It is hypothesized that the training program has positive influence of farm profitability. Quantitative variables include Age of Head (AGE), EDU (Education), Experience (EXPER), FWORK (Family Workforce) and Gross Output (GO).
At the same time, a multiple discriminant analysis is used to measure the impact of socio-economic characteristics of households and farms’ output on the performance of different perennial crop farms. Alternatively, a determinant analysis is applied as a quantitative method to clarify the factors causing a problem and reviewing the linkages among these factors (Landau and Everitt, 2003; Trong and Ngoc, 2008).
The discriminant equation:
F = β0 + β1X1 + β2X2+….+ βpXp + ε, (1) where F is variable form by the linear combination of the dependent variables. X1....Xp
are the independent variables (socio-economic characteristics of households and gross output).
β0 is constant. β1..p is the discriminant coefficients. The aim of discriminant analysis is to test whether the classifications of Y groups depends on at least one of the Xi.
Results and discussion
Statistical descriptions of the group producing coffee and group producing pepper
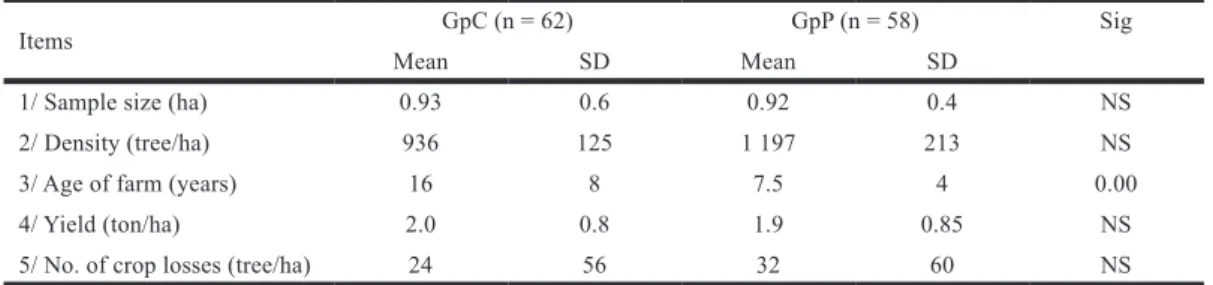
Generally, the average cultivated areas of the GpC and the GpP are similar, estimated to be about 0.9 hectares per farm group. It means that perennial crop farms are characterized relatively by smallholders as reported by (World Bank,
2016). In addition, the densities reach 936 trees/ha in the GpC and 1197 trees ha in the GpP, respectively, which are lower than the technical standards (1100 coffee trees/ha and 1700 pepper trees/ha) (Thong, 2015). Moreover, the yields among the GpC and the GpP are 2.0 tons for coffee bean and 1.9 tons per ha for dried black pepper, which are smaller than for the nation and other countries such as Indonesia and India. What is more, the numbers of crop losses are 24 coffee trees/ha and 32 pepper trees/ha, respectively (Table 3). One reason is that, with respect to the GpC, the considerable expansion of planting onto less suitable or un-suitable regions (equivalent to 20% in Dak Lak and Lam Dong) and the age of the coffee tree stocks (i.e., over one-third of the provincial coffee growing area was aged 15–20 years) are likely to heavily affect. Meanwhile, concerning the GpP, in the previous years, due to very high selling price, excessive fertilizers were applied for plantation, which can lead to the soil acidification, the infectious diseases, the low yield and crop losses. In order to support this argument, authors (Ton and Buu, 2011; Oanh, 2019; Scherr et al., 2015) depicted that over 2000 ha were lost in 2018 due to pests and diseases such as foot rot (caused 9%–95% of economic losses) and yellow leaves.
The evolution of economic efficiency between the coffee farm and pepper farm groups
The change of input costs among the two farm groups
Table 4 shows the input cost items among the two groups and the variances in each group during the period of 2016/2017–2017/2018.
The results exhibit that the GpC demonstrated lower variable costs, which were estimated to be 1.01 thousand in 2016/2017 and 1.14 thousand USD in 2017/2018, than the GpP, whereas the GpP had variable costs of 1.83 thousand and 1.67 thousand USD/ha, respectively. Moreover, the GpC is considered being more suitable for smallholders having rarely available savings and facing considerable dilemma in accessing credit (Hurri and Quang, 2015; Birner
Items GpC (n = 62) GpP (n = 58) Sig
Mean SD Mean SD
1/ Sample size (ha) 0.93 0.6 0.92 0.4 NS
2/ Density (tree/ha) 936 125 1 197 213 NS
3/ Age of farm (years) 16 8 7.5 4 0.00
4/ Yield (ton/ha) 2.0 0.8 1.9 0.85 NS
5/ No. of crop losses (tree/ha) 24 56 32 60 NS
Source: Author’s calculations
Items GpC (n = 62) GpP (n = 58)
2016/2017 2017/2018 Sig 2016/2017 2017/2018 Sig
Mean Mean Mean Mean
Variable cost 1.01 1.14 0.04*** 1.83 1.67 NS
I. Intermediate cost (IC) 0.68 0.78 NS 1.16 0.97 NS
1. Fertilizer 0.49 0.63 0.01** 0.77 0.63 NS
Manure 0.10 0.14 NS 0.31 0.19 NS
Chemical 0.38 0.49 0.03** 0.46 0.43 NS
2. Pesticide, herbicide, stimulants 0.08 0.07 NS 0.28 0.26 NS
3. Watering 0.05 0.04 NS 0.04 0.03 0.06***
4. Transporting 0.01 0.01 0.00* 0.01 0.01 NS
5. Packaging 0.01 0.02 0.00* 0.01 0.01 0.00*
6. Others 0.03 0.01 0.00* 0.04 0.03 0.02**
II. Hired labor cost 0.15 0.14 NS 0.37 0.34 NS III. III. Interest cost 0.04 0.07 NS 0.06 0.13 NS
IV. Depreciation 0.14 0.14 NS 0.23 0.23 NS
Note: The significance levels are indicated as ****p <0.10, **p <0.05,*p <0.01, NS: Non-significant. Mann–Whitney test: 0.00 (exc-luding family labor cost); a Currency rate: 1USD=23 000 Vietnamese Dong
Source: Author’s calculations
Table 4: The variance of input cost of the two farm groups during the period of 2016/2017–2017/2018 (thousand USD/ha).
and Danielle, 2010). Unfortunately, the average cost of pesticides, herbicides, and stimulants for the GpP is several times higher than that of the GpC, which is estimated to be average 0.27 thousand UDS/ha (Table 4). One of the reasons might be that farmers boost amount of pesticides and stimulants due to rising the occurrence of pests and diseases on black pepper plants, influencing on plant growth and yield (Thuy, 2010). As (Thuy et al., 2019b), the authors argued that high pepper price motivates farmers to over-use pesticides and stimulants. This implies that pepper farms are likely to increase the dependency on inorganic and toxic inputs, which could have had a negative effect on production and sustainable development, as revealed by (Susmita, 2007; World Bank, 2016). In addition, the findings present that the GpP puts greater pressure on the labor force. It means this group requires more workdays and more hired labor during the crop season, especially for harvesting (pepper vine needs to be pick up on time, to control ripe cherries losses and help plant growth for the next season), than did GpC. Another reason that peppers production needs more laborers than that of coffee is field management and protection. For instance, as previously stated, theft is a social problem appears entirely in peppers production, which increases the need for laborers. Especially, thief problem occurs in ethnic minority due to higher un-employment labor (15-20 years) in ethnic families than that of Kinh families (labor went to school or got jobs), in which thieves are
the local and un-employment people, as revealed by farmers. Moreover, neighbor conflict causes the personal destructive behavior such as a chopping mass of pepper vines, leading to increase the managers.For instance, because of a lack of power-man on black pepper harvest season the paid-wage of labor in the local regions raise. Even though some households must work overtime hours causing health problem or hire less efficient laborers such as children or elderly people.
Fortunately, compare to the past, irrigation cost reduced in both groups due to the application of three-phase electricity as well as by the advanced irrigation technologies (drip and spray irrigations) instead of using diesel machines.This is an appropriate strategy for local farmers when perennial crop production has experiencing the effects of climate change such as increasing the number of hot days and nights and the occurrence of intense droughts (Haggar and Schepp, 2012). For the coming years, the continuously training programs of irrigation management should be improved, which can obtain the water productivity. Because as a report, trained farmers tended to use fewer litters per plant than the others (Amarasinghe et al., 2015).
Taking everything into consideration, the GpP is likely to apply more input items and the labor pressure for farmers, as opposed to the GpC. Farmers should consider the labor source when choosing crop farms and finding the employees, especially during the harvest season.
At the Government, official calls of controlled release of material items like chemical fertilizers and pesticides in terms of pepper production carefully consider in the future because of ecological effects. Moreover, establishment of volunteers or social communities helps rural farmers to collect the black pepper cherries in urgent cases.
Regarding each group-farming, the annual cost has jumped by 13% for the GpC but has declined steadily for the GpP by 8% per ha during two crop seasons (Table 4). Specifically, regarding the GpC, the intermediate cost has significantly boosted by 0.13 thousand USD/ha (about 30%), of which chemical fertilizer item mainly occupies (average about 52%), which is larger than that of other countries such as India (Devi and Pandurangarao, 2003). This is because of the following: (i) the older age of the coffee crops (the changes of revenues and the increase of inputs); (ii) the fact that farmers do not apply the optimal composition of fertilizers leading to running-off into streams or groundwater (i.e., they follow their neighbors’ tendency or advice of stakeholders or middlemen), or farmers got the confusion about how best to use these inputs (World Bank, 2016). Obviously, the growth rate of costs for GpC creates vulnerabilities for the farm groups, especially because coffee prices, are lower than in previous years. Moreover, increased fertilizers (urea and generic NPK fertilizer) leads to polluted surface water, excessive irrigation and soil acidification affect sustainable production. Authors suggest that rather than input costs increase, farmers implement better agricultural practices (i.e., apply agrochemical fertilizers in proportion to need and in accordance with technicians' recommendations) to deflate the amount of inputs and improve economic efficiencies. In addition, the practice of optimizing fertilizers, according to a Technoserve study, by reducing them, could improve yield and income, increasing them by 10% and 30%, respectively. Likewise, considerable implementation of coffee rejuvenation is to build a more sustainable coffee sector at the provincial and national levels.
With respect to the GpP, intermediate costs have declined, on the one hand, by 0.13 thousand USD/ha (18.5%) over two crop years. It could be inferred the following (1) the density is lower than the previous years due to losses crops; and (2) farmers decline their manure or bio-fertilizer use, which is an expensive item (i.e., the price of bio-fertilizer is 1.04 thousand USD/ton). Although selected farmers are well-aware of the important role of organic-fertilizers on increasing yield
and maintaining the soil, only 30 % of household produce their bio-organic in different ways, the rest have to buy it from the sales representative.
Simultaneously, the GpP has seemed to show a devaluation of intermediate and hired labor costs during the two crop years. However, this group has higher input costs, such as labor cost and interest payment, which can lead to a constraint if households did not have much savings and an available labor source, than the GpC. Likewise, use of high pesticides and herbicides is harmful to farmers' health, has raised concerns about pesticide residues and their effects on the marketing of products.
Notably, the interest charge is likely to raise in 2016/2018 and 2017/2018, which leads to an increase in household spending linked to production. For instance, these figures were 0.04 thousand USD/ha for the GpC and 0.06 thousand USD/ha for the GpP in 2016/2017 but they jumped sharply by 60% and 130% in 2017/2018, respectively (Table 4). Even though low prices of commodities, it could be expected that growers maintain their investment for the plantations by borrowing money from banks or informal sources, such as middlemen and collectors or mortgaging the Land Use Certificate, hoping “black gold or golden age” as previous years (over 90% of households mortgaged their Land Use Certificate). In light of this, the authors suggest that the Government should complete more monetary policies towards farmers, offer diversifier financial sources in order to avoid the spontaneous expansion of informal financial channels.
Generally, coffee and pepper farms not only are costly but also face struggles, leading to various challenges of livelihood strategies. Authors suggest that perennial crop farms should be diverse practices. Specifically, modern cultivation like technical application and intercropping farms such as coffee and pepper, coffee and cashew and fruits, which not only generates more income by taking advantage of space but also reduces input costs such as water, fertilizers as well as help environmental protection, should be taken into account. In addition, traditional practices use animal manure and leguminous to boot nitrogen into the soils and control the pests and diseases, as some developed countries and Asia upland counties did (Stillitano et al., 2019; Salazar, 2006; Ho et al., 2017; Romyen et al., 2018; Kunnal and Basavaraj, 2006). According to Lamcombe et al (2016), intergrating perennial crops and livestock sustains
smallholder's livelihood. Going forward, it is likely that changing behavior in perennial practices at the farm level is bound to be more than supporting funds directly. What is more, developing “specialty products and bio- products” that has been promoted successfully in Brazil, Indonesia, and Africa is considered to new orientation for farmers (Dak Lak People’s Committee, 2019).
Economic performance variance of two groups
Table 5 has displayed a comparison of output for the entire sample over the two crop years in the two farm groups. The findings show that the GpC demonstrates lower economic indicators than the GpP. Specifically, the profitability of the GpC accounted for 1.77 thousand USD/ha in 2016/2017 and 1.07 thousand USD/ha in 2017/2018, whereas these figures were 6.85 thousand and 1.73 thousand USD/ha for the GpP, respectively (Table 5).
Additionally, there has been a significant decrease in economic efficiency in each farm group over the two crop years, GpP rate of decline is for larger than the GpC. This falling value of the GpP are estimated to be around 21% for gross output, 46% for ratio GO and IC, and over 50% for value added, NFI, profit, labor productivity, and ratio of NFI to family labor, whereas the figures of the GpC are 14%, 21%, 23%, 24.5%, 40%, 28% and 33%, respectively, as depicted in Figure 2. It could be expected that the volatile market conditions is a straightforward interpretation of the decrease in economic returns of the GpC and the GpP, specially pepper selling price (Table 5). For instance, because of the fluctuation of market pepper price in mid-2017, the selling price of pepper failed nearly a half price, from 4.78 in 2016/2017
to 2.43 USD/ton in 2017/2018. The findings indicated that the economic performance can be achieved by cost reduction, input-output improvement, increasing revenue and better crop prices. It implies that the reduction in productivity and jumping costs significantly take into consideration when market price is a subjective factor at farm level.
0 1 2 3 4 GO VA NFI Profit Thousand USD/ha
Group producing coffee
2016/2017 2017/2018 Average 0 2 4 6 8 10 GO VA NFI ProfitGroup producing pepper
2016/2017 2017/2018 AverageSource: own procesing
Figure 2: The evolution of economic performance between the two groups during two crop seasons.
Although the GpP quantifies higher value than the GpC in both crop years, the rate of reduction is
Items
GpC (n = 62) GpP (n = 58)
2016/2017 2017/2018 Sig 2016/2017 2017/2018 Sig
Mean Mean Mean Mean
1. Gross output (GO) (Thousand USD/ha) 3.51 3.01 0.00* 9.77 4.63 0.00*
2. Price selling (Thousand USD/ton) 1.61 1.50 4.78 2.43
3. Net Value Added (Thousand USD/ha) 2.83 2.22 0.00* 8.61 3.65 0.00*
4. Net farm income (NFI) (Thousand USD/ha) 2.48 1.87 0.00* 7.96 2.96 0.00*
5. Profit (Thousand USD/ha) 1.77 1.07 0.00* 6.85 1.73 0.00*
6. Labor Productivity 0.03 0.02 0.00* 0.06 0.03 0.00*
7. GO/IC 0.26 0.20 0.4 0.49 0.26 0.00*
8. NFI per Family labor 0.03 0.02 0.00* 0.06 0.02 0.00*
Note: The significance levels are indicated as ****p <0.10, **p <0.05,*p <0.01, NS: Non-significant. Mann–Whitney test: 0.00 (exc-luding family labor cost); a Currency rate: 1USD=23 000 Vietnamese Dong
Source: Author’s calculations
more significant than that of the GpC. Remarkably, there has been a decrease of the labor productivity and NFI with respect to family labor in the two farm groups during 2016/2017–2017/2018. This seems to contribute serious challenges to production, and raise difficulties in the farmers’ life, which will be analyzed in future studies. Under problematic circumstances, the authors suggest that local farmers and the community change their method of growing coffee and pepper in order to mitigate the risk and maintain production. For instance, the authorities should announce certificate application to farmers in suitable region, or/and improve shade tree for plantations in the whole province, which can lead to cutting down environmental impacts, reducing production cost (i.e., irrigated cost) and enhancing households’ income from by-products (timber, fruits) (Jezeer at al., 2018; Ho et al., 2018). In Mexico, Peru and Ethiopia, certificated coffee creates the sustainability. In Spain, diversification is as a crop planning strategy for geographic area and products. (Barham and Weber, 2012; Villa et al., 2019). Nonetheless, the Government should attend quality of certificate farms instead of increasing quantity. Besides that, the authorities continuously implement the program of land consolidation through exchanging and regrouping land parcels among households to obtain “massive fields” (cánh đồng mẫu lớn), which is appropriate for technical application or hi-tech zones and marketing channel. Furthermore, the local government should call pests and diseases as an emergency. A massive death of plants should be well-controlled by improvement of producer’s awareness, hygiene farms and transferring other crops. Especially, improvement of technical training, guidance on safe production should be recommended. Moreover, encouragement uses live plants as pepper vines instead of concrete and wooden. It is further national and local government should have a wide range of package insurance for distinguished stages in terms of an immature and mature stages.
Factors impacting the change in profitability of the two farm groups
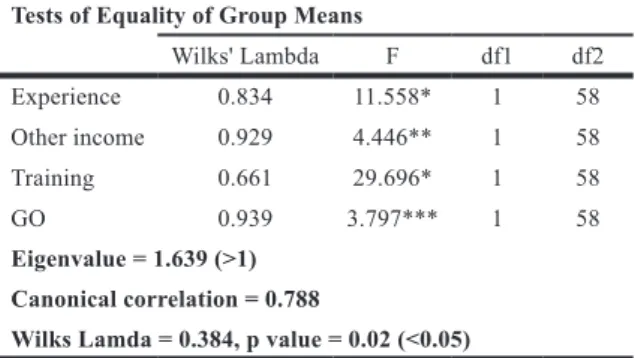
The farm profit inspires farmers to expand or leave the agriculture (Tey and Brindal, 2015). We utilize a technique to examine differences in the level of farm profitability among two groups of successes and un-prosperous farms. Alternatively, the discriminant analysis finds out factors affecting profitability by two categories. The finding of regression expresses determinants of farm productivity including experience,
other income, training, and output. Individually, experience, other income, training, and revenue delivered positive effects on the lucrative farms (Table 6).
Tests of Equality of Group Means
Wilks' Lambda F df1 df2 Experience 0.834 11.558* 1 58 Other income 0.929 4.446** 1 58 Training 0.661 29.696* 1 58 GO 0.939 3.797*** 1 58 Eigenvalue = 1.639 (>1) Canonical correlation = 0.788
Wilks Lamda = 0.384, p value = 0.02 (<0.05)
Note: The significance levels are indicated as ****p <0.10, **p <0.05,*p <0.01
Source: own processing
Table 6: Discriminant analysis test on the impact of factors on the results of the two farm groups.
About unique features, experience and training skills are likely to significantly influence the profitability of farms. This is logical, because perennial crops have a long lifespan and survive through multiple harvest seasons, even after being subjected to high levels of processing. When production is faced with obstacles, experience and training skills related to good agricultural practices reduce risk, save costs, and generate higher income. Especially, the finding shows that training is the most important factor affecting the performance of perennial crop farms with the absolute value of standardized coefficient of 1.133. This means that in comparison to others, farms with household heads who participated in training program tend to be more profit. Regarding local authorities, training programs can guide farmers to adopt technical innovations, preventing diseases, and pruning and shaping technique as well as guidance of diversified farm systems. In other words, farmers have an increase of agricultural knowledge based on which to draw, to decide, what to grow and how to grow it, as well as a better understanding of their resources, weather conditions, and price dynamics. Sustainability-certificate farms, which are less susceptible to environmental influences, develop better economic efficiency than did conventional farms, as reported by (Ho et al., 2018).
Additionally, other income is positively associated with farm profitability. It helps farmers to become a capital-endowed for their plantations to reduce borrowing money from informal sectors. A finding that is in good agreement with the literature (Warren, 2002; Turner
and Annamalai, 2012; Diep and Vien, 2017). Additionally, other activities, including agricultural and non-agricultural activities, are shown to generate added value to farmers in addition to coffee and pepper production. Lastly, the study indicates the revenue has positively correlated with the farm profitability. It should be noted that the revenue is not impacted by selling prices because the output data is only used in 2017/2018 crop year. It be inferred, therefore, earnings affected by the farm yield, in which we consider farms and crops profiles.
Indeed, perennial crop production is faced with many quandaries and sustaining in perennial crop farm business is not easy task. Therefore, this exploration generates policy implication to improve farm sustainability. Specifically, in order to maintain output growth, solutions involving intensified and diversified strategies to save costs such as labor, water, pesticides, and fertilizers, should be provided by the local and national governments. On top of that, training skills, which put farmers in a better position to compete in the production and marketing, should be improved. For instance, the Government can use available funds to train farmers and leaders instead of supply cash payments in order to be essential to the spread and longevity of new behavior for social and ethical motivators. In other words, agricultural technology and sustainable agriculture need to design and promote in the coming years.
Conclusion
Generally, perennial crop production involves labor-intensive crops, requires high input cost and has susceptibility to market failure. In this study, by empirically examining the economic benefits of two study groups over two crop years, our study aims to compare the differences of earnings between two groups and identify the evolution of the profitability of these groups. Another point worth noting is determinants of farm profitability. Empirical results provide several important findings. First, during the period of two years, the GpP has had higher variable costs such as pesticides, herbicides and stimulants.
For each farm group, the GpP has a loss of variable costs of 0.15 thousand while the figure leaps at 0.13 thousand USD per ha in the GpC. We argue that the GpC is likely to be more suitable for the poor due to lower overall consumption of inputs while the GpP is popular with well-endowed farmers due to high investment cost. Moreover, the GpP is likely to invest more input items and heavily use chemical inputs. It could be inferred that the GpC is more environmentally friendly practices to cope with environmental issues. Therefore, this implies that in comparison to the GpC, the GpP tends to be less sustainable. Second, regarding agronomic benefits, the amount of loss is 21% for gross output, 57% for value added, 62% for NFI, 74% for profit, 50% for labour productivity, and 64 % for ratio of NFI to family labor for the GpP, whereas the rate of loss for the GpC is under 50% for all items. It means that the GpP is likely to be more vulnerable, which may be affected by pests and diseases or weather and market fluctuation, in comparison to the GpC. It implies that it is very important for both farmers and local government agencies to pay more attention to sustainable production of the GpP. We argue that farmers in long term can be encouraged to pay attention to the GpC as well as interventions can be provided coffee production as primary economic field such as subsidies or cash rewards. Given that local government observes divergence across short-run loss and long-short-run gain in terms of ecological benefits of the GpP. Third, the study reveals that the change in profitability is influenced dramatically by a variety of factors, including experience, training, other income, and gross output, which are positive effects with respect to the farm profitability. These findings provide an explanation for farmers which can lead to decide their livelihoods and translate into efficiency improvement as well as for policy-makers to design the incentives to improve farmers’ knowledge and returns. It means that, this study understanding the current situation of coffee farm and pepper farm groups will help policymakers to develop better interventions to improve perennial crop sustainability and good agricultural practices.
Corresponding authors Phan Thi Thuy
Département d’Economie et du Développement rural
Gembloux Agro-Bio Tech Université de Liège, 5030 Gemboux, Belgium, Phone: +84 9 35 34 6969/+32 488338637, E-mail: phanthuydhtn@gmail.com, PhanThiThuy@student.ulg.ac.be
References
[1] Amarasinghe, U. A., Hoanh, C. T., D‘haeze, D. and Hung, T. Q. (2015) “Toward Sustainable Coffee Production in Vietnam: More Coffee with Less Water“, Agricultural Systems, Vol. 136, pp. 96-105. ISSN 0308-521X. DOI 10.1016/j.agsy.2015.02.008.
[2] Angelsen, A. (2010) “Policies for Reduced Deforestation and Their Impact on Agricultural Production“, Proceedings of the National Academy of Sciences, Vol. 107, No. 46, pp.19639-19644. ISSN 0027-8424. DOI 10.1073/pnas.0912014107.
[3] Barral, S. (2012) “Assessing Smallholder Farming. Diagnostic Analysis of Family-Based Agricultural
Systems in a Small Region“, 150 p. ISBN 978-971-560-153-5.
[4] Barham, B. L. and Weber, J. G. (2012) “The economic sustainability of certified coffee: Recent evidence from Mexico and Peru“, World Development, Vol. 40, No. 6, pp. 1269-1279. ISSN 0305-750X. DOI 10.1016/j.agsy.2019.05.006.
[5] Birner, R. and Danielle, R. (2010) “The Political Economy of Policies for Smallholder Agriculture“, World Development, Vol. 38, No. 10, pp. 1442-1452. ISSN 0305-750X. DOI 10.1016/j.worlddev.2010.06.001.
[6] Chau, T. M. L. (2007) “The Relative Sustainability of Coffee and Mixed Farmining Systems
in Dak Lak Province, Vietnam“, 120 p. [Online]. Available: https://dlc.library.columbia.edu/catalog/
ldpd:497638/bytestreams/content/content?filename=Chau_T_M_Long_Thesis.pdf [Accessed: 7 Aug. 2019].
[7] Cochet, H. (2015) “Comparative Agriculture“, Spinger, 85 p. ISBN 978-94-017-9828-0. DOI 10.1007/978-94-017-9828-0.
[8] Dak Lak People’s Committee (2019) “Focus on developing specialty coffee areas in the
2018-2019 coffee crop“. [Online]. Available:
https://daklak.gov.vn/web/english/-/focus-on-developing-specialty-coffee-areas-in-the-2018-2019-coffee-crop. [Accessed: 7 Aug. 2019].
[9] Devi, K. U. and Pandurangarao, A. (2003) “Economic Analysis of Coffee in Visakhapatnam District of Andhra Pradesh“, Agricultural Economics Research Review,Vol. 16, No. 1, pp. 36-43. ISSN 0971-3441.
[10] Diep, H. T. N. and Vien, H. T. (2017) “Determinants of Income Diversification and Its Effects on Rural Household Income in Vietnam“,Tạp Chí Khoa Học Trường Đại Học Cần Thơ, pp.153-162. ISSN 1859-2333.
[11] Diepart, J. and Céline, A. (2018) “Farming Systems Analysis: A Guidebook for Researchers
and Development Practitioners in Myanmar“, GRET, 86 p. [Online]. Available: https://www.gret.
org/publication/farming-systems-analysis-guidebook-myanmar/?lang=en [Accessed: 7 Aug. 2019]. [12] Dinh, H. H., Nguyen, T. T., Hoang, V. N. and Wilson, C. (2017) “Economic incentive and factors
affecting tree planting of rural households: Evidence from the Central Highlands of Vietnam“,
Journal of Forest Economics, Vol. 29, pp.14-24. ISSN 1104-6899. DOI 10.1016/j.jfe.2017.08.001.
[13] FAO (1999) “Land Tenure Service Rural Development Division Sustainable Development
Department Food and Agriculture Organization“ [Online]. Available: https://www.agter.org/bdf/_
docs/fao_1999_agrarian-systems-diagnosis_c.pdf [Accessed: 7 Aug.2019].
[14] Global Strategy (2016) “Agricultural Cost of Production Statistics Guidelines for Data Collection,
Compilation“, Rome. [Online]. Available:
http://gsars.org/wp-content/uploads/2016/02/Handbook-on-Agricultural-Cost-of-Production-Statistics-28-02-2016.pdf [Accessed: 7 Aug. 2019].
[15] GSO (2019) “Agriculture, Hunting, Forestry and Fishing (Statistical Book 2018)“, pp. 339-425. [Online]. Available: https://www.gso.gov.vn/default.aspx?tabid=512&idmid=5&ItemID=19293, [Accessed: 7 Aug.2019].
[16] Gunathilaka, R. P. D., Smart, J. C. and Fleming, C. M (2018) “Adaptation to Climate Change in Perennial Cropping Systems: Options, Barriers and Policy Implications“, Environmental Science
[17] Ha, D. T., and Shively, G. (2008) “Coffee Boom, Coffee Bust and Small Holder Response in Vietnam‘s Central Highlands“, Review of Development Economics, Vol. 12, No. 2, pp. 312-326, ISSN 1467-9361. DOI 10.1111/j.1467-9361.2007.00391.x.
[18] Haggar, J. and Schepp, K. (2012) “Coffee and Climate Change Impacts and Options for Adaption
in Brazil, Guatemala, Tanzania and Vietnam“, NRI Working Paper Series: Climate Change,
Agriculture and Natural Resources, Natural Resources Institute No. 4. [Online]. Available https://www.academia.edu/2050482/Coffee_and_Climate_Change_Impacts_and_Options_for_ Adaptation_in_Brazil_Guatemala_Tanzania_and_Vietnam [Accessed: 7 Aug. 2019].
[19] Herridge, D. F., Win, M. M., Nwe, K. M. M., Kyu, K. L., Win, S. S., Shwe, T., Min, Y. Y., Denton, M. D. and Cornish, P. S. (2019) “The cropping systems of the Central Dry Zone of Myanmar: Productivity constraints and possible solutions“, Agricultural Systems, Vol. 169, pp. 31-40. ISSN 0308-521X. DOI 10.1016/j.agsy.2018.12.001.
[20] Hill, B. and Bradley, B. D. (2015) “Comparison of Farmers’ Incomes in the EU Member States.
Report for European Parliament, Komisja Europejska, DG Internal Policies, Raport dla Parlamentu Europejskiego, Bruksela“ [Online]. Available http://www.europarl.europa.eu/RegData/etudes/
STUD/2015/540374/IPOL_STU(2015)540374_EN.pdf [Accessed: 7 Aug. 2019].
[21] Ho, T. Q., Hoang, V. N., Wilson, C. and Nguyen, T. T. (2017) “Which Farming Systems Are Efficient for Vietnamese Coffee Farmers?“, Economic Analysis and Policy, Vol. 56, pp. 114-125. ISSN 0313-5926. DOI 10.1016/j.eap.2017.09.002.
[22] Ho, T. Q., Hoang, V.-N., Wilson, C. and Nguyen, T.-T. (2018) “Eco-Efficiency Analysis of Sustainability - Certified Coffee Production in Vietnam“, Journal of Cleaner Production, Vol. 183, pp. 251-260. ISSN 0959-6526. DOI 10.1016/j.jclepro.2018.02.147.
[23] Hurri, S. and Quang, N. N. (2015) “Report Rural Finance of Coffee Smallholders in Vietnam
- Case Study in Dak Nong Province“, IFAD, Ha Noi. [Online]. Available https://asia.ifad.org/
documents/10751/084b3711-14d8-42f8-8d40-d604fa93e385. (In Vietnam) [Accessed: 7 Aug. 2019]. [24] IDH (2013) “Vietnam a Business Case for Sustainable Coffee Production“, Technoserve [Online].
Available: https://www.globalcoffeeplatform.org/assets/files/Documents/Reports-Brochures/3_ BusinessCaseEthiopiaUganda_vdPut_Stewart.pdf [Accessed: 7 Aug.2019].
[25] Jezeer, R. E., Santos, M. J., Boot, R. G. A., Junginger, M. and Verweij, P. A. (2018) “Effects of shade and input management on economic performance of small-scale Peruvian coffee systems“,
Agricultural Systems, Vol. 162, p. 179-190. ISSN 0308-521X. DOI 10.1016/j.agsy.2018.01.014.
[26] JICA (2012) “Agricultural Transformation and Food Security 2040, ASEAN Region with a Focus
on Vietnam, Indonesia, and Philippines“, 32 p. [Online]. Available ccsenet.org/journal/index.php/
ass [Accessed: 7 Aug. 2019].
[27] Kunnal, L. B., and Basavaraj, H. (2006) “Economic Analysis of Establishment of Pepper as Mixed Crop with Coffee in Chikmagalur District of Karnataka State“, Karnataka Journal of Agricultural
Sciences, Vol. 19, No. 3, pp. 568-573. [Online] Available http://14.139.155.167/test5/index.php/
kjas/article/viewFile/756/750 [Accessed: 7 Aug. 2019].
[28] Lacombe, G., Bolliger, A. M., Harrison, R. and Ha, T. T. T. (2016) “Integrated Tree, Crop and Livestock Technologies to Conserve Soil and Water, and Sustain Smallholder Farmers’ Livelihoods in Southeast Asian Uplands“, In Integrated Systems Research for Sustainable
Smallholder Agriculture in the Central Mekong, 41 p. World Agroforestry Centre.
ISBN 978-604-943-434-1. [Online]. Available https://www.bioversityinternational.org/fileadmin/ user_upload/Humidtropics_Raneri.pdf [Accessed: 7 Aug. 2019].
[29] Landau, S. and Everitt, B. S. (2003) “A Handbook of Statistical Analyses Using SPSS“, Chapman and Hall/CRC. ISBN 9781584883692. [Online]. Available http://www.academia.dk/ BiologiskAntropologi/Epidemiologi/PDF/SPSS_Statistical_Analyses_using_SPSS.pdf [Accessed: 7 Aug. 2019]. DOI 10.1201/9780203009765.
[30] Lan, L., Sain, G., Czaplicki, S., Guerten, N., Shikuku, K. M., Grosjean, G. and Läderach, P. (2018) “Farm-level and community aggregate economic impacts of adopting climate smart agricultural practices in three mega environments“, PloS One, Vol. 13, No. 11. E-ISSN 1932-6203. DOI 10.1371/journal.pone.0207700.
[31] Lososová, J. and Zdenek, R. (2014) “Key factors afecting the profitability of farms in the Czech Republic“, Agris On-line Papers in Economics and Informatics, Vol. 6, No. 1, pp. 21-36. ISSN 1804-1930. DOI 10.22004/ag.econ.166523.
[32] Newton, A. C., Hodder, K., Cantarello, E., Perrella, L., Birch, J. C., Robins, J., Douglas, S., Moody, Ch. and Cordingley, J. (2012) “Cost–benefit analysis of ecological networks assessed through spatial analysis of ecosystem services“, Journal of Applied Ecology, Vol. 49, No. 3, pp. 571-580. ISSN 0021-8901. DOI 10.1111/j.1365-2664.2012.02140.x.
[33] NIAPP (2017) “Viet Nam pepper industry development planning to 2020, and vision 2030“. [Online]. Available: http://www.niapp.org.vn/info/en/dtcl/giaidoan4/viet-nam-pepper-industry-development-planning-to-2020-and-vision-2030/54161.
[34] Oanh, D. T. (2019) “Thực Trạng Sản Xuất Hồ Tiêu Tại Tây Nguyên, Vietnam“ (The sistuation of Pepper Production in Central Highlands), Buon Ma Thuot. [Online] Available http://wasi.org. vn/doi-net-ve-thuc-trang-san-xuat-ho-tieu-tai-tay-nguyen-hien-nay [Accessed: 7 Aug. 2019] (in Vietnamese).
[35] Odum, H. T. (1983) “Systems Ecology; An Introduction”, pp. 644. ISBN-10:0471652776.
[36] Peter, K., Kurian, A., Angelsen and Chopra. V. L. (2003) “Production Systems and Agronomy|
Plantation Crops and Plantations“, Encyclopedia of Applied Plant Sciences, E-ISBN 978012394808,
ISBN 9780123948076. DOI 10.1016/B0-12-227050-9/00242-8.
[37] Quah, E. and Mishan, E. J. (2007) “Cost-Benefit Analysis“, Routledge, 336 p. ISBN-10: 0415349915. [38] Romyen, A., Sausue, P. and Charenjiratragul, S. (2018) “Investigation of Rubber-Based Intercropping
System in Southern Thailand“, Kasetsart Journal of Social Sciences, Vol. 39, No. 1, pp. 135-142. ISSN 2452-3151. DOI 10.1016/j.kjss.2017.12.002.
[39] Salazar, M. (2006) “An Economic Analysis of Smallholder Coffee Production in Guatemala, Honduras, Nicaragua and Vietnam“, M.Sc. Thesis, Faculty of Purdue University, Purdue Purdue. [Online] Available https://pdfs.semanticscholar.org/0c06/ e25f99c4a78b6723fd107eb13840ef2e4273.pdf [Accessed: 7 Aug. 2019].
[40] Salvatore, D. and Reagle., D. (2002) “Statistics and Econometrics, Schaum’s Outline Series“, McGraw–Hill. ISBN 9780071755474.
[41] Scherr, S. J, Kedar, M. J. and Christine, N. (2015) “Chapter 7: Coffee in Dak Lak, Vietnam“, In book
Steps toward Green: Policy Responses to the Environmental Footprint of Commodity Agriculture in East and Southeast Asia“, EcoAgriculture Partners, 220 p. [Online] Available
https://ecoagriculture.org/wp-content/uploads/2015/08/Steps-Toward-Green-Book-File-Final-for-Upload.pdf [Accessed: 7 Aug. 2019].
[42] Slater, R., Peskett, L., Ludi, E. and Brown, D. (2007) “Climate Change, Agricultural Policy and Poverty Reduction - How Much Do We Know?“, ODI Natural Resource Perspectives, 109 p. [Online]. Available: https://www.odi.org/sites/odi.org.uk/files/odi-assets/publications-opinion-files/1850.pdf [Accessed: 7 Aug. 2019].
[43] Stillitano, T., Falcone, G., Nicolò, B. F., Di Girolamo, C., Gulisano, G. and De Luca, A. I. (2019) “Technical Efficiency Assessment of Intensive and Traditional Olive Farms in Southern Italy“,
Agris On-Line Papers in Economics and Informatic, Vol. 11, No. 2, pp. 81-93. ISSN 1804-1930.
DOI 10.7160/aol.2019.110208.
[44] Susmita, D. (2007) “Pesticide Poisoning of Farm Workers–Implications of Blood Test Results from Vietnam“, International Journal of Hygiene and Environmental Health, Vol. 210, No. 2, pp. 121-132. ISSN 1438-4639. DOI 10.1016/j.ijheh.2006.08.006.
[45] Thái, H. A. C. (2018) “Livelihood Pathways of Indigenous People in Vietnam’s Central Highlands:
Exploring Land-Use Change“ (In Vietnamese), Springer. ISBN 978-3-319-71171-3.
[46] Thi Duong Nga, N. and Thuy, P. T. (2017) “Economic Performance of Coffee and Pepper Intercropping in Quang Hiep Commune, Cumgar District, Dak Lak Province“, Vietnam Journal
Agriculture Science, Vol. 15, No. 9, pp. 1277-1287. ISSN 1859-0004.
[47] Thong, P. H (2015) “Tài Liệu Đào Tạo Nông Dân Kỹ Thuật Sản Xuất Cà Phê Bền Vững“ (Coffee, Technical for Sustainable Production of Development), HDI, VNU. [Online] Available http://gcpconnect.coffee/sites/gcp-connect.org/files/TOF.pdf [Accessed: 7 Aug. 2019].
[48] Thong, L., Thao, N. Q. and Viet, P. C. (2017) “Sách Giáo Khoa Bài Tập Địa Lý 12“ (Geographical Book of Vietnam). ISBN 9786040149558.
[49] Thuy, P., Niem, L., Ho, T., Burny, P. and Lebailly, P. (2019a) “Economic Analysis of Perennial Crop Systems in Dak Lak Province, Vietnam“, Sustainability, Vol. 11, No. 1. E-ISSN 2071-1050. DOI 10.3390/su11010081.
[50] Thuy, P., Niem, L., Ho, T., Burny, P. and Lebailly, P. (2019b) “Which perennial crop farm approach generates more profitability? A case study in Dak Lak province, Vietnam“, Asian Social Science, Vol. 15, No. 9. ISSN 1911-2017. DOI 10.5539/ass.v15n9p1.
[51] Thuy, T. T. T. (2010) “Incidence and Effect of Meloidogyne Incognita (Nematoda: Meloidogyninae) on Black Pepper Plants in Vietnam“, Thesis, Katholieke Universiteit Leuven, België. Unpublish. [52] Tey, Y. S. and Brindal, M. (2015) “Factors influencing farm profitability“, Sustainable
Agroculture Reviews, Vol. 15, pp. 235-255. Springer, Cham. ISSN 2210-4410.
DOI 10.1007/978-3-319-09132-7_5.
[53] Ton, N. T. and Buu, B. C. (2011) “How to Prevent the Most Serious Diseases of Black Pepper (Piper Nigrum L.) – A Case Study of Vietnam“, In PC Annual Meeting in Lombok, Indonesia. [Online]. Available: http://www.ipcnet.org/admin/data/ses/1329362855thumb.pdf [Accessed: 7 Aug. 2019] [54] Turner, A. G., and Annamalai, H. (2012) “Climate Change and the South Asian Summer
Monsoon“, Nature Climate Change, Vol. 2, No. 8. E-ISSN 1758-6798. ISSN 1758-678X. DOI 10.1038/nclimate1495.
[55] Trong, H., Ngoc, C. N. M. (2008) “Phân Tích Dữ Liệu Nghiên Cứu Với SPSS“ (Analysis Data for Research with SPSS), Nhà Xuất Bản Hồng Đức. [Online] Available https://www.sachmoi.net/ phan-tich-du-lieu-nghien-cuu-voi-spss/ [Accessed: 7 Aug. 2019]. ISBN 506404262974.
[56] Villa, G., Adenso-Díaz, B. and Lozano, S. (2019) “An analysis of geographic and product diversification in crop planning strategy, Agricultural Systems, Vol. 174, pp. 117-124. ISSN 0308-521X. DOI 10.1016/j.worlddev.2011.11.005.
[57] Warren, P. (2002) “Livelihoods Diversification and Enterprise Development: An Initial Exploration
of Concepts and Issues. Livelihood Support Program (LSP)“, Food and Agriculture Organization
of the United Nations working paper 4. [Online]. Available: http://www.fao.org/tempref/docrep/ fao/008/j2816e/j2816e00.pdf. [Accessed: 7 Aug. 2019].
[58] World Bank (2016) “Transforming Vietnamese Agriculture: Gaining More from Less“, Work Bank Group. [Online]. Available: http://documents.worldbank.org/curated/en/116761474894023632/ pdf/108510-WP-PUBLIC.pdf [Accessed: 7 Aug. 2019].