HAL Id: hal-01405856
https://hal-enpc.archives-ouvertes.fr/hal-01405856
Submitted on 14 Dec 2016
HAL is a multi-disciplinary open access
archive for the deposit and dissemination of
sci-entific research documents, whether they are
pub-lished or not. The documents may come from
teaching and research institutions in France or
abroad, or from public or private research centers.
L’archive ouverte pluridisciplinaire HAL, est
destinée au dépôt et à la diffusion de documents
scientifiques de niveau recherche, publiés ou non,
émanant des établissements d’enseignement et de
recherche français ou étrangers, des laboratoires
publics ou privés.
Relief Computation from Images of a Fourier Transform
Spectrometer for Interferogram Correction
Clara Barbanson, Andrés Almansa, Yann Ferrec, Pascal Monasse
To cite this version:
Clara Barbanson, Andrés Almansa, Yann Ferrec, Pascal Monasse. Relief Computation from Images
of a Fourier Transform Spectrometer for Interferogram Correction. OSA Light, Energy and the
Envi-ronment Congress, OSA, Nov 2016, Leipzig, Germany. �10.1364/FTS.2016.FM3E.6�. �hal-01405856�
Relief computation from images of a Fourier
transform spectrometer for interferogram
correction
Clara Barbanson1, Andr´es Almansa2, Yann Ferrec1, Pascal Monasse3
1 : Onera, Chemin de la Huni`ere et des Joncherettes BP 80100, 91123 Palaiseau Cedex - France 2 : T´el´ecom Paristech, 46 rue Barrault, 75013 Paris - France
3: Ecole des Ponts Paristech, 6-8 av Blaise Pascal - Cit´e Descartes, Champs-sur-Marne, 77455 Marne-la-Vall´ee Cedex 2 - France
Abstract: A method to extract digital elevation models of the ground from the images of an airborne Fourier transform spectrometer is presented. Such information allows to construct accurate interferograms in non-flat areas, where they are otherwise flawed.
OCIS codes: (100.3190) Inverse problems; (100.4145) Motion, hyperspectral image processing.
1. Introduction
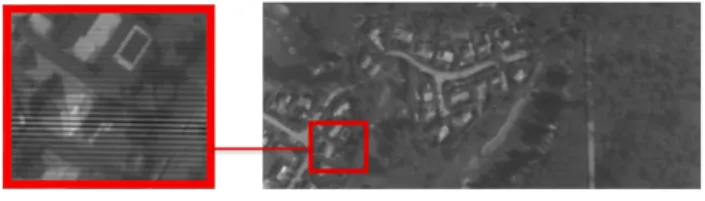
Airborne imaging Fourier transform spectrometers possess the singularity that spectrum acquisition is not snapshot, but temporal. When such an instrument, onboard an aircraft, is aimed towards the nadir, artefacts may appear due to changes in the view angle during acquisition. This is true in the case of Sieleters, an infrared imaging Fourier transform spectrometer developed by ONERA, the French Aerospace Lab [1]. Its interferometer is static : a Michelson interfer-ometer is placed in front of the imaging optics, and outputs an image of the overflown scene on which interference fringes are superimposed, as can be seen in figure1. The fringes are still and oriented perpendicularly to the linear flight path. Dense sequences of images, where each is translated by 1 pixel, are obtained. Thus, any point in the scene is seen on several images with different optical paths values. Combining all the values taken by each point of the scene leads to construction of an interferogram. The spectrum is then derived by Fourier transform.
Fig. 1. An image from Sieleters. On the left, a magnified detail shows contrasted interference fringes.
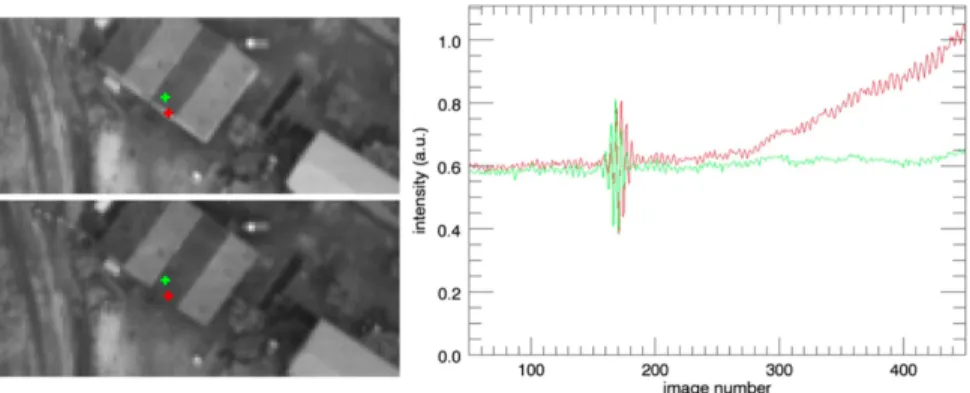
However, when the scene is not flat (containing for instance buildings or natural slopes), if relief is not taken into account, the position of an elevated object across the sequence of images is miscalculated. As a consequence, the scene element is wrongly matched on the images and the interfergram thus computed contains erroneous values. An example is shown in figure2.
As a result, an accurate estimation of ground elevation is needed in order to identify flawed interferograms in non-flat areas and correct them.
2. Methods 2.1. Fringe removal
Before proceeding with relief estimation, the fringes need to be removed from the images. Indeed, while they are paramount to spectrum reconstruction, the fact that they remain at the same position on all images interferes with
Fig. 2. On the left, two images of a sequence acquired by Sieleters are shown. Values from matching scene elements are used to construct the interferogram (on the right). The red crosses on the images correspond to matches made without taking the height and geometry of the building into account. Hence, part of the rooftop and part of the wall are used to construct a flawed interferogram. The green crosses are also mismatched, but are contained in an homogeneous area, thus providing a correct interferogram.
relief retrieval algorithms, which exploit the changes between images taken from different positions. Moreover, the fringes induce variations in radiometry that are uncorrelated to relief.
It was therefore decided to remove the fringes, using the fact that they are mostly band-limited in the Fourier space. We call Ω the area containing the frequencies of the fringes under homogeneous illumination. In addition, we adopt an image model inspired in [2], where w, the mesured image (with fringes), is the sum of u, the image of the overflown scene, and v, an image containing only fringes. Our aim is to find u by minimising a function called Total Variation (TV) on u. Total Variation is an operator that exploits the gradient of the image : TV (u) = ∑i∈N∑j∈M||∇(u)||, where
N and M are the height and width of the image. It allows smoothing an image without loosing discontinuities. The problem can be expressed as following, where ˆuand ˆwdenote the Fourier transforms of u and w :
min
u,v TV(u)
subject to ˆu|Ωc = ˆw|Ωc
and w = u + v
This step of fringe removal gives satisfactory results, even if some artefacts may still be visible in areas of high radiance gradients.
2.2. Depth computation
The method used to compute depth estimations is that of the Epipolar-Planes Images (EPI) [3]. It requires that the aircraft follow a linear path, and that the image acquisition be dense, which is a given in the case of imaging Fourier transform spectrometers, where scene elements can be traced on more than 400 images.
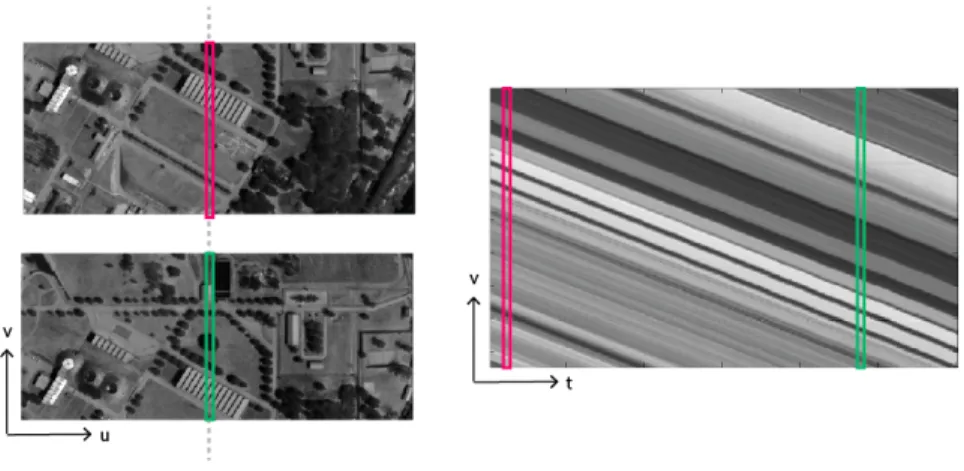
To build Epipolar-Plane Images, all images first need to be put in epipolar geometry, which consists in having all images aligned so that the same scene elements are observed in the same column on all images. This setup can be observed on figure3.
Then, we construct new images, called EPIs, one for each column of the Sieleters image. These images contain only one column from each original image, put one after the other in chronological order. Thus, the vertical axis of the EPI describes a spatial unit, and the horizontal axis shows time (or more precisely image number). Figure3shows an EPI extracted from a sequence of pictures.
In an EPI, an element of the scene is translated into a line, corresponding to the path followed by the object with regard to the first image of the sequence. Moreover, the slope of those paths is proportional to the distance between the scene element and the camera, providing a depth value. Our EPIs show only little variations on slopes between different paths. This is due to the fact that the altitude of the aircraft is much greater that the elevation differences
Fig. 3. On the left, images of a sequence of images from Sieleters are shown. They are in epipolar geometry, where columns contain the same set of scene elements where both images overlap. On the right, the EPI corresponding to the columns with index 510. Identical columns are shown in color.
observed in the scene. A precise line detection algorithm needs to be used to determine the depth of elements in the scene. For this purpose we chose a robust algorithm based on gradient orientation of pixels [4].
3. Conclusion
The procedure presented here outputs a sparse elevation map, as seen in figure 4, computed from the images of an imaging Fourier transform spectrometer. Such information allows to identify flawed interfograms. It can also be densified and used as a digital elevation model for all scene points, to allow reliable matching of scene elements through all images. Thanks to this, accurate interferograms can be computed for non-flat areas. Further work will study precise interpolation of interferograms on irregular sampling grids.
Fig. 4. Sparse elevation map with the corresponding Sieleters image as background in gray values. Height is coded in color, from red for the highest points to blue for the lowest.
References
1. C. Coudrain, S. Bernhardt, M. Caes, R. Domel, Y. Ferrec, R. Gouyon, D. Henry, M. Jacquart, A. Kattnig, P. Perrault, L. Poutier, L. Rousset-Rouvire, M. Tauvy, S. Thtas, and J. Primot, “SIELETERS, an airborne in-frared dual-band spectro-imaging system for measurement of scene spectral signatures,” in Opt. Express 23(12), pp.16164–16176(2015).
2. S. Osher,A. Sol, and L. Vese, “Image Decomposition and Restoration Using Total Variation Minimization and the H1,” in Multiscale Model. Simul. 1(3), pp.349–370(2003).
3. A. Criminisi, S. B. Kang, R. Swaminathan, R. Szeliski, and P. Anandan, “Extracting Layers and Analyzing their Specular Properties Using Epipolar-Plane-Image Analysis,” in Computer Vision and Image Understanding vol.97 (2005).
4. A. Desolneux, L. Moisan, and J.-M. Morel, “Meaningful Alignments,” in International Journal of Computer Vision40(1), pp.7–23(2000).