HAL Id: hal-00941765
https://hal-imt.archives-ouvertes.fr/hal-00941765
Submitted on 4 Feb 2014
HAL is a multi-disciplinary open access
archive for the deposit and dissemination of
sci-entific research documents, whether they are
pub-lished or not. The documents may come from
teaching and research institutions in France or
abroad, or from public or private research centers.
L’archive ouverte pluridisciplinaire HAL, est
destinée au dépôt et à la diffusion de documents
scientifiques de niveau recherche, publiés ou non,
émanant des établissements d’enseignement et de
recherche français ou étrangers, des laboratoires
publics ou privés.
Capacity gains from multipoint single frequency
transmission in HSPA+
Ahlem Khlass, Salah Eddine Elayoubi, Thomas Bonald
To cite this version:
Ahlem Khlass, Salah Eddine Elayoubi, Thomas Bonald. Capacity gains from multipoint single
fre-quency transmission in HSPA+. WCNC, 2013, Shanghai, China. pp.476-480. �hal-00941765�
Capacity Gains from Multipoint Single Frequency
Transmission in HSPA+
Ahlem Khlass
Orange Labs & Telecom ParisTech France
Salah Eddine Elayoubi
Orange Labs Issy-Les-Moulineaux, France [email protected]Thomas Bonald
Telecom ParisTech Paris, France [email protected]Abstract—High Speed-Single Frequency Network (HS-SFN) is one of the possible multipoint transmission techniques proposed in the 3GPP standard for High Speed Downlink Packet Access (HSDPA) in order to improve network performance, especially at the cell edge. It allows neighboring cells to transmit simul-taneously the same data stream to a User Equipment (UE) in the Handover region (HO). In order to evaluate the user-level performance of this technique, we develop a method based on network simulation coupled with Markov chain analysis. It shows that when the HS-SFN technique is performed in the HO region between adjacent cells, the user data rates increase significantly. However, this is true only when involved cells are partially loaded, which is not always the case. We thus propose an optimized approach that adapts the coordination area based on the average offered traffic observed in the network. Network performance is then improved at any load.
Index Terms-HSPDA, Multipoint Transmission, HS-SFN, Sec-tor Coordination, Cellular Networks, Flow Level Modeling, Queuing Theory.
I. INTRODUCTION
Since its initial release in 1999, the WCDMA system [1] has been upgraded to offer substantial improvements in data rates and capacity. The first step was to improve the downlink by introducing the High-Speed Downlink Packet Access (HSDPA) system in release 5. Subsequently, the uplink has been upgraded by defining the High-Speed Uplink Packet Access (HSUPA) system in release 6 [2]. Introduced in re-lease 7, the Enhanced HSPA system (also known as HSPA+) provides advanced features such as multiple input-multiple output (2x2 MIMO) technologies and higher order modulation (64 QAM). Recently, new features have been added such as the Multi-carrier HSDPA (MC-HSDPA) where two or more carriers are involved in serving a user equipment (UE). More recently, within the framework of Release 11, the concept of HSDPA Multipoint Transmission has been introduced [3]. The difference between multi-carrier and multipoint HSDPA is that the former allows multiple carriers, belonging to the same sector, to serve simultaneously the UE, while the latter coordinates different sectors to serve cell edge UEs.
There are three types of multipoint transmission schemes:
• In the Single Point data transmission scheme, the UE is
allowed to be attached to two sectors but can be served only by one of them at each time slot, depending on its instantaneous channel.
• In the Multiflow data transmission, all sectors can simul-taneously schedule independent transport blocks to the UE. In this scheme, coordinated sectors may or may not belong to the same NodeB but, in the latter case, the two NodeBs must exchange some signaling information. In [4], the authors propose a system-level evaluation of this scheme where two cells schedule independent data streams to the same UE in the same frequency. Results show that it performs better than the classical HSDPA transmission in terms of throughput and has the ability to balance load in asymmetric loading environment. Fur-thermore, the effect of coordination on UEs which are not concerned by the joint scheduling is shown to be negligible.
• In the Single Frequency Network (SFN) data transmis-sion, the same transport block is scheduled simultane-ously by a pair of sectors belonging to the same NodeB. As its name suggests, transmissions are performed syn-chronously so that the signals are combined and seen as a single multipath signal at the UE receiver [5]. We focus in this paper on this coordination scheme as its performance evaluation has been rarely addressed in the literature. These HSDPA Multipoint techniques enable to enhance net-work performance by improving user experience, especially at cell edge, and efficiently balancing load [6]. It turns out that the user dynamics are rarely taken into consideration when evaluating the performance gains of such techniques. The aim of this work is to evaluate the performance gains of HS-SFN in HSDPA at flow level, accounting for flow arrivals and departures. To do that, we develop a method based on network simulation coupled with Markov chain analysis. We consider that within a site, each pair of sectors serves users in the Handover (HO) region by simultaneous transmissions of the same data stream in the same carrier frequency. Performance is evaluated in terms of throughput in average and at cell edge. The main contributions of this work are the following:
1) We propose an original hybrid performance evaluation approach based on a realistic radio simulator coupled with a Markovian analysis, where the former assesses the impact of coordination on the peak throughputs while the latter catches the behavior of the resource allocation mechanism.
2) We take into account the flow level dynamics in the evaluation and assess the impact of traffic on the coor-dination gain.
3) We propose an optimization of the coordination scheme that chooses the appropriate coordination zone. This paper is organized as follows. In section II, the concept of sector coordination using HS-SFN for HSDPA and the resource allocation algorithm are introduced. The performance analysis is presented in section III. Simulation results are provided in section IV. In section V, we propose an optimized coordination. Finally, conclusions and further work are drawn in section VI.
II. HS-SFNFORHSDPANETWORK
A. Concept of sector coordination using HS-SFN
In classical HSDPA, each UE is associated to the so-called serving base station (BS) that offers the best signal. When signals from non-serving BSs exceed the signal from the serving one by a certain threshold, a handover (HO) mechanism is triggered in order to select the best BS to switch to. This threshold is denoted by δhandover and a user in this
region verifies:
Received signal from the serving BS
Received signal from the non-serving BS < δhandover This region can be represented also by the fraction α of the total surface covered by the BS.
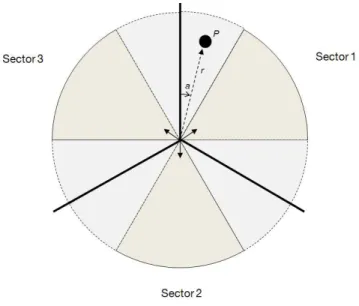
As proposed by the 3GPP standard [3], once a UE falls in this region, the non-serving BS with the best signal coordinates with the serving one in order to schedule the same transport block to this UE in the same frequency and using the same scrambling code, hence signals are combined and the receiver sees just one multipath signal. Thus, the Signal-to-Noise-plus-Interference-Ratio (SINR) is improved leading to a better user experience at the cell edge. In fact, focusing on a tri-sectored site as shown in figure 1 where sectors are loaded symmetrically, the SINR measured at location u using the single point transmission technique (without coordination) is as follows: SIN Ru= P0,s(u) P3 i=1 i6=s P0,i(u) +Pl P3
i=1Pl,i(u) + n
,
where Pl,i(u) denotes the received power from sector Si for
i ∈ N = {1, 2, 3} in site l (sector s of site 0 is supposed to be the serving sector of user u) and n is the thermal noise. However, when the HS-SFN technique is performed at the same location (in the HO region between adjacent sectors), the SINR becomes:
SIN R0u= P0,s(u) + P0,c(u) P3 i=1 i6=s,c P0,i(u) +Pl P3
i=1Pl,i(u) + n
.
We notice that the signal received from sector c is converted from interfering signal to useful signal. The SINR is thus largely improved as the received signal is getting stronger.
Fig. 1. A tri-sectored site.
B. Resource Allocation Algorithm
As it is shown in figure 1, we can divide the tri-sectored site into six zones:
• Non-coordination zones where users are served exclu-sively by a unique BS noted Z1, Z2 and Z3.
• Coordination zones where users are served simultane-ously by two BSs noted Z12, Z23 and Z31.
For instance, zone Z1⊂ S1 includes users served exclusively
by BS1 and zone Z12 ⊂ S1 ∩ S2 includes users served
simultaneously by BS1 and BS2.
We consider a centralized scheduler per site. Resources are divided according to a Proportional Fair resource allocation [7], [8] so that BS1, BS2 and BS3 can serve separately and
independently users in zone Z1, Z2 and Z3, respectively. But,
when serving users in Z12 for instance, BS1 and BS2 join
their resources and block users from Z1and Z2, similarly for
users in zones Z23 and Z31. Since we neglect the fast-fading
variations of the channel, the resource allocation algorithm can be described as follows:
At each timeslot,
• Select a user at random,
• Remove all other users sharing the same resources with
it from the list of eligible users,
• Iterate until all sectors are occupied (i.e. all resources are
used) or the list of eligible mobiles is empty;
• Serve the selected mobiles.
We can thus express the fraction of time allocated to each type of users at a given time. Let K = {1, 12, 2, 23, 3, 31} be the set of zones in the site. We denote by yk the number
of users in each zone Zk and y their corresponding vector.
The Total number of users in the site is given by ¯y. Then, the fraction of time allocated for instance to users in zone Z12for
instance is given by φ12(y) = y12 ¯ y + y3 ¯ y y12 y1+ y2+ y12 .
In fact, a user in zone Z12 is served if it is selected at first
with a fraction of y12/¯y or after selecting a user in zone Z3
with a fraction of y3/¯y (blocking by this way users in Z23
and Z13). Similarly, we get the fraction of time allocated to
users in Z1: φ1(y) = y1+ y23 ¯ y + y2 ¯ y y1+ y3 y1+ y3+ y31 +y3 ¯ y y1+ y2 y1+ y2+ y12 , and so on for the other zones.
III. PERFORMANCEANALYSIS
In this section, we first present the achievable rates obtained by the technique of HS-SFN in a HSDPA network. Then, these rates are used in the Markov process that describes the system dynamics. Finally, performance is evaluated in terms of average throughput and cell edge throughput for different load situations.
A. Achievable Rates
We consider a homogeneous, trisectored, HSDPA network in a hexagonal grid topology. Two interfering rings (i.e., a total of n = 19 cells) are considered when calculating inter-cell interference. We divide the inter-cell depicted in figure 1 into elementary surfaces defined by an angle a relative to the main direction of the antenna (i.e. a is an integer ∈ [0, 120])) and a distance from the site center r ∈ [50..350].
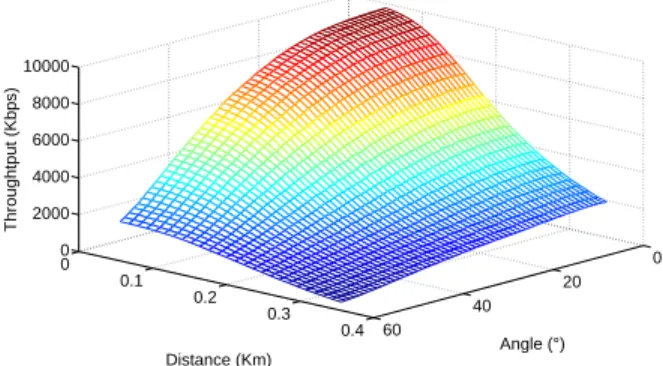
Based on the analysis of section II.A, we measure the SINR of a single user at different positions (a, r) in two cases: i) Classical transmission (i.e. without sector coordination) and ii) Multipoint transmission using the HS-SFN technique (i.e. with sector coordination). Once this SINR is obtained, link level curves are used that associate to each SINR the corresponding throughput by taking into account the fast fading as described in [9]. We thus obtain two matrices of peak full buffer throughputs, R(a, r) and R0(a, r), without and with coordination, respectively. Figure 2 illustrates the classical HSDPA throughput over a half-sector (PA3 channel, dense urban area with an inter-site distance of 500 meters), while figure 3 illustrates the case where α = 30% of the cell surface is subject of coordination. It can be observed that the peak throughput is largely improved when coordination is applied.
B. Markov Analysis
In the previous section, we showed the impact of coordina-tion on the throughput when the user is alone in the cell. In this section, we perform a Markovian analysis that takes into account the impact of the centralized scheduling and the flow level dynamics on the performance.
Let C = {1, 2, ..., M } be the set of elementary surfaces such as each element i ∈ C corresponds to a combination of (a, r) and belongs to one of the six zones defined previously. We assume the traffic demand is uniformly distributed in the site. Users arrive to the site at random following a Poisson process of intensity λ and leave the network once they finish their data transfer. Precisely, users in position j arrive following a
0 20 40 60 0 0.1 0.2 0.3 0.4 0 2000 4000 6000 8000 10000 Angle (°) Distance (Km) Throughtput (Kbps)
Fig. 2. 3D representation of the peak throughput using single point transmission (hexagonal, tri-sectorized network).
0 20 40 60 0 0.1 0.2 0.3 0.4 0 5000 10000 15000 Angle (°) Distance (Km) Throughtput (Kbps)
Fig. 3. 3D representation of the peak throughput using Multipoint transmis-sion (α = 30%)
Poisson process of intensity λi= piλ. Flows are characterized
by their size which is independent and identically distributed with mean σ. The mean service rates without and with coordination are given by µi and µ0i respectively such as
µi= Ri/σ; µ0i= R 0 i/σ.
The system can be described as a Markov process. Each state is denoted by x = {xi}i∈C and the transition rates
between two states x and x0 are given as follows q(x, x0) = λi for x0 = x + ei xi ykφk(y)µi for x 0= x − e i with i ⊂ Zk, k = {1, 2, 3} xi ykφk(y)µ 0 i for x0= x − ei with i ⊂ Zk, k = {12, 23, 31} 0 else
where ei denotes an M -dimensional vector where the i’th
component is equal to one and all the others are equal to zero.
We can obtain, by simulation, the steady-state probabilities π(x), leading to the average numbers of users in class i [10] [11] such as
E(xi) =
X
x
0 200 400 600 800 1000 1200 1400 1600 1800 2000 0 500 1000 1500 2000 2500 Offered traffic (Kbps) Average throughput (Kbps) No coordination α=30 %
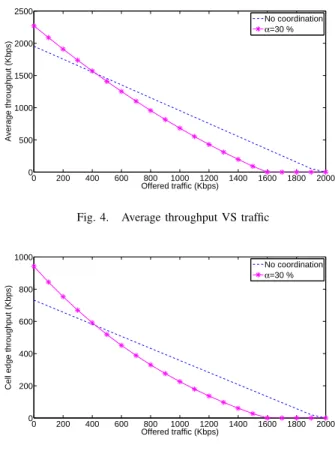
Fig. 4. Average throughput VS traffic
0 200 400 600 800 1000 1200 1400 1600 1800 2000 0 200 400 600 800 1000 Offered traffic (Kbps)
Cell edge throughput (Kbps)
No coordination
α=30 %
Fig. 5. Cell edge throughput VS traffic
Using Little’s law, we obtain that the mean delay users in i as E(Ti) =
E(xi)
λi
The throughput, defined as the ratio of the mean flow size to the mean flow delay, is given by
γi=
σ E(xi)
C. Simulation Results
In this part, we evaluate the HS-SFN technique by injecting the full buffer throughputs of Figures 2 and 3 in the Markovian flow level analysis. We define two performance measures: The average flow throughput over the cell and the cell edge throughput as the throughput achieved by the worst 5% of users. Figures 4 and 5 represent the average and the cell edge throughputs obtained for different traffic values λ. We notice an important increase in both average and cell edge throughputs in low load situations. However, for high load situations, we see a deterioration of the throughput, followed by a decrease of the stability region when using the HS-SFN coordination technique. This is due to the fact that, even if sectors are loaded, they have to schedule users from other sectors leading to less scheduling opportunities for their own users.
This motivates us to look for an optimized coordination area where to perform the HS-SFN for HSDPA without sacrificing the system performance.
0 20 40 60 80 100 0 500 1000 1500 2000 0 500 1000 1500 2000 2500 Coordination threshold (°) Offered Traffic (Kbps) Average throughput (Kbps)
Fig. 6. Average throughput for all possible values of α
0 200 400 600 800 1000 1200 1400 1600 1800 2000 0 500 1000 1500 2000 2500 Offered traffic (Kbps) Average throughput (Kbps) α=0 % α=15 % α=30 % α=50 % α=75 % α=100 %
Fig. 7. Average throughput for α = 0, 15, 30, 50, 75, 100
IV. OPTIMIZEDCOORDINATIONAREA
As seen so far, the performances of HS-SFN are mainly related to the average traffic observed in the cell. Allowing an α = 30% of the total area of a sector to enable Multipoint transmission is beneficial until some point where the single point transmission (without cell coordination) performs better. We thus study the impact of coordination area on the system performance. We start by illustrating, in figure 6, the average throughput γ(α, λ) for all possible values of α ranging from 0 % to 100 % and for different traffic values λ. We can observe that the extent of the coordination area has a large impact on performance and that this impact differs depending on the offered traffic. Figure 7 further illustrates this impact for some values of α ∈ {0, 15, 30, 50, 75, 100}. It can be observed that a value of α can be better than another in some load situations, and worse in others. More precisely, for low load situation, the best performances are obtained with large coordination areas while lower coordination is preferred for high loads.
We thus propose an optimized coordination scheme where the coordination zone is broadened or narrowed depending on the average traffic. For that, an information about the handled traffic need to constantly available in each sector. Hence, the optimal coordination value, denoted by α∗, is the solution of the optimization problem described as
α∗= arg max
α γ(α, λ)
0 200 400 600 800 1000 1200 1400 1600 1800 2000 0 20 40 60 80 100 Offered Traffic (Kbps) α * (°)
Fig. 8. Optimal coordination area.
0 200 400 600 800 1000 1200 1400 1600 1800 2000 −100 −80 −60 −40 −20 0 20
Offered traffic (Kbps/sector)
Coordination gain on average throughput (%)
α=30 %
α *
Fig. 9. Coordination gain on average throughput for the optimized case and the case where α = 30%.
for different traffic situations. We notice that the value of α∗ decreases with the load, until reaching the value of 0 near the network stability condition where the classical HSDPA operation is the preferred one. Using these results, each sector has to configure its coordination area in respect to the average traffic load. Figures 9 and 10 show the gain achieved when using the optimized coordination scheme compared to the common coordination scheme (with α = 30%)in average and at cell edge, respectively. We see that with a constant coordination threshold, we may have negative impact on network performances, while the optimized scheme brings almost always a positive gain.
0 200 400 600 800 1000 1200 1400 1600 1800 2000 −100 −50 0 50 Offered traffic (Kbps)
Coordination gain on cell edge throughput (%)
α=30 %
α*
Fig. 10. Coordination gain on cell edge throughput for the optimized case and the case where α = 30%.
V. CONCLUSION
In this paper, we analyze the flow-level performances of HS-SFN for HSDPA as proposed by the 3GPP standard. We develop a method based on network simulation coupled with Markov chain analysis. Results show an important increase in the average throughput at a price of a significant decrease in the stability region of the system. We hence propose an optimized coordination scheme that adapts the coordination area with respect to the load observed in the network and show that it achieves good performances in all traffic situations.
As future work, we aim at proposing self optimizing algo-rithms that allow adapting the coordination threshold based on radio conditions and traffic measurements. We aim also at studying other cell coordination algorithms (Single/Dual frequency Multiflow data transmission) in HSPA+ and also Coordinated Multipoint schemes in LTE-Advanced networks.
REFERENCES
[1] H. Holma and A. Toskala, WCDMA for UMTS: Radio Access for Third Generation Mobile Communications, Revised Edition. John Wiley & Sons, 2001.
[2] E. Dahlman, S. Parkvall, J. Skold, and P. Beming, 3G Evolution, Second Edition: HSPA and LTE for Mobile Broadband, 2nd ed. Academic Press, 2008.
[3] HSDPA Multipoint Transmission (Release 11), 3GPP TR 25.872 Std. [4] C. Zhang, Y. Chang, S. Liu, and D. Yang, “System-level analysis
and evaluation of sf-dc transmit mode in hspa system,” in Wireless Communications and Networking Conference (WCNC), 2012 IEEE, april 2012, pp. 1185 –1190.
[5] O. Puchko, M. Zolotukhin, V. Hytonen, T. Hohne, and T. Chapman, “Phase adjustment in hs-sfn for hsdpa,” in New Technologies, Mobility and Security (NTMS), 2012 5th International Conference on, may 2012, pp. 1 –5.
[6] “Hspa+ advanced smart networks: Multipoint transmission,” Qualcomm Incorporated, Tech. Rep., February 2011.
[7] P. Viswanath, D. Tse, and R. Laroia, “Opportunistic beamforming using dumb antennas,” Information Theory, IEEE, 2002.
[8] A. Khlass, T. Bonald, and S. Elayoubi, “Resource allocation in coordi-nated cellular networks,” submitted for publication.
[9] A. Saadani and J.-B. Landre, “Realistic performance of hsdpa evolution 64-qam in macro-cell environment,” in Vehicular Technology Confer-ence, 2009. VTC Spring 2009. IEEE 69th, april 2009, pp. 1 –5. [10] T. Bonald and M. Feuillet, Network Performance Analysis. ISTE/Wiley,
Jul. 2011.
[11] T. Bonald and A. Proutiere, “Wireless downlink data channels: user performance and cell dimensioning,” in Proceedings of the 9th annual international conference on Mobile computing and networking, ser. MobiCom ’03. New York, NY, USA: ACM, 2003, pp. 339–352.