Crisis-Robust
Bond Portfolios
Marie Brière
Ariane Szafarz
Dr. Marie Brière
Head of Fixed Income, Forex and Volatility Strategy Crédit Agricole Asset Management
Prof. Ariane Szafarz
Director of the Centre Emile Bernheim Solvay Business School Université Libre de Bruxelles
ABOUT THE AUTHORS
Marie Brière is Head of Fixed Income, Forex and Volatility Strategy at Crédit Agricole Asset Management, associate researcher with the Centre Emile Bernheim at Université Libre de Bruxelles and affiliate professor at CERAM Business School. She holds a PhD in Economics and is a graduate of the ENSAE school of economics statistics and finance. She also teaches empirical finance at Université de Paris IX Dauphine and Paris II Assas. She is the author of a book on the anomalies in the formation of interest rates as well as various scientific articles published in books, academic and practitioners’ journals. Ariane Szafarz, PhD in Science, teaches finance and mathematics at the Université Libre de Bruxelles (ULB), where she is Director of the Centre Emile Bernheim, of the PhD programme in Management Sciences (Solvay Business School), and the European Master in Microfinance. She was visiting professor at Université de Lille II, Université Catholique de Louvain and the Luxembourg School of Finance. She is the author of six books (published, among others, by Elsevier, Economica and Pearson Education) and many scientific articles published in books and international academic journals including Econometric Theory, European Economic Review, Journal
of Empirical Finance, Oxford Economic Papers, International Journal of Business, Economics Letters.
The authors thank Michel Aglietta, Jerome Barkate, Pascal Blanqué, Tony Bulger, Gabrielle Demange,Christian Gourieroux, Sylvie de Laguiche,
Sandrine Lardic, Bertrand Maillet, Thierry Michel, Valérie Mignon, Kim Oosterlinck, Carlos Pardo, Marco Piersimoni, Benjamin Sahel,
Ombretta Signori, for usefull comments and suggestions.
INTRODUCTION
A financial crisis is typically associated with a rise in the volatility of most assets. Moreover, if the crisis is “contagious”, things become even worse for investors because correlations among asset returns also increase and diversification becomes less efficient than during quiet periods. As most identified financial crises have been positively tested for contagion (Loretan and English (2000), Hartmann et al. (2001), Bekaert et al. (2005)), this problem warrants close attention.
To reduce investors’ excessive exposure to crisis effects (Chow et al. (1999)), this study builds “crisis-robust” portfolios, i.e. those exhibiting the least change in volatility during crises. Such portfolios enable investors to minimize as much as possible the perverse effects of volatility caused by a crisis. Holding a crisis-robust portfolio is an alternative to a regime-switching asset allocation (Ang and Bekaert (2002, 2004)), which implies recognizing early signs of a crisis and switching regimes appropriately1. In this respect, a crisis-robust portfolio is less demanding; and therefore safer, for the investor. As far as possible, crisis-robust portfolios are supposed to eliminate the need to rebalance asset allocations according to the climate in the financial markets. Choosing a crisis-robust portfolio not only reduces transaction costs; it means that investors do not have to worry constantly about changing their allocations. Furthermore, it is difficult to adapt portfolios to the changing volatility/correlation picture in a timely manner because most crises occur suddenly.
In practice, crisis-robust portfolios can help asset managers respect a risk threshold fixed by their clients or publicly announced along with a fund's objectives. Indeed, the risk thresholds produced by our model ensure that crisis periods interfere as little as possible with a portfolio's composition and risk. This is an innovation, since funds guaranteeing a maximal risk level typically evaluate that risk using time intervals that are long enough to be dominated by non-crisis subperiods.
Although general, the concept of crisis-robust portfolio is especially appealing when applied to markets that exhibit the mixed effects of crises on volatilities and correlations. Typically, these markets are characterized by a so-called flight-to-quality (FTQ) effect (i.e. all volatilities increase but the correlations between the safest and the riskiest assets decrease). Empirical work has detected this effect between bonds and stocks and among also bonds (Bekaert et al. (2005), Berben and Jansen (2005)), while stocks seem to be subject only to contagion (correlations rise).
Thus, contrary to the stock market, the bond market offers an FTQ trade-off during crises that can be exploited to keep portfolios as crisis-insensitive as possible, the optimum being the crisis-robust portfolio.
One might think that crisis-robust bond portfolios are composed solely of the highest quality securities, i.e. developed countries' sovereign bonds and highly rated corporate bonds, because the volatility of investment grade bonds is low, even during periods of turmoil. However, FTQ effect undermines this argument. The fact that investors shift from risky to safe securities during crises (Beber et al. (2006)) causes a decline in the correlations between risky and safe assets during such periods (Stivers and Sun (2002), Baur and Lucey (2006)). This is good news for diversification benefits.
Regarding bond portfolios, crises tend to increase volatilities and decrease correlations between highly rated and speculative bonds. Therefore, thanks to more effective diversification, a bond portfolio including some high yield bonds –but not too many, for volatility reasons– may withstand crises better than a 100%-safe portfolio. The empirical part of this study is devoted to assessing the extent of this phenomenon, that is, to measuring the fraction of risky assets devoted to optimally “robustifying” the portfolio against financial turmoil.
Regarding the consequences of crises, therefore, bondholders are better placed than stockholders, who are subject to harmful contagion. Indeed, bondholders benefit from an FTQ-linked risk trade-off. Crisis-conscious bond portfolio managers should therefore take this into account. The crisis-robust
approach is one way to fully exploit this trade-off in order to keep portfolios as crisis-insensitive as possible.
In the empirical part of this study, we have identified seven financial crises between 1998 and 2007 on the basis of the literature. The full dataset is composed of weekly returns of government (GVT) and corporate bond indices in the U.S. and in the Eurozone. Corporate bonds are split into investment grade (IG) and high yield (HY) categories. We therefore deal with six different assets. First, we show that the FTQ has a key effect in the bond class. Indeed, the two correlation matrices (U.S., Eurozone) show that diversification benefits rise during troubled times in four cases out of six. Accordingly, in these cases, the crisis-robust portfolio includes the lowest-grade asset, confirming the impact of the volatility trade-off.
The study is organized as follows. Section I defines crisis-robust portfolios in a general framework and furnishes their analytical expression in a simple two-asset setting. Section II presents the original bond-market dataset, explains how crisis periods have been delineated, and documents the presence of FTQ. Section III applies the crisis-robust concept to this dataset. Section IV concludes.
I. C
RISIS
-
ROBUST PORTFOLIOS
Because financial markets can be unpredictable, both in crisis periods and in quiet periods, the crisis-robust portfolio is defined as the one minimizing the volatility ratio between the two types of period.
Consider the following model. There are two possible regimes: the crisis regime C and the quiet regime Q, but the probabilities of these regimes are unknown. A crisis is therefore seen as a totally unpredictable event that affects the markets.
The market includes n risky assets. The stochastic return vector
is taken randomly from either the crisis-period multivariate distribution with covariance matrix or the quiet time distribution with covariance matrix . Crises happen exogenously2but investors are "crisis-conscious" (Kole
et al. (2005)), i.e. they know that crises are possible. However, they have no
prior information on the probability of occurrence. A rationale for the impossibility of inferring the probability of a next-day crisis could stem from the fact that crises are highly erratic, so the probability is unknown and, in most cases, unknowable.
Let , be the composition of portfolio P made up of
n assets, where denotes the proportion of asset i in P. The variance of this
portfolio depends on the regime:
(2.1) during crises
The crisis-robust portfolio P* is defined as the one minimizing the variance ratio between the two regimes:
(2.2)
Its composition, denoted by , with , is thus such that:
(2.3)
With a crisis-robust portfolio, the investor minimizes the need to rebalance the asset allocation. Thus, a crisis-robust portfolio reduces transaction costs, all other things being equal. However, the benefits associated with crisis-robustness are likely related to the style of the portfolio manager. For active investors who react even to minor signals, looking for a crisis-robust portfolio makes little sense since they adapt to any changes they perceive on the market. Conversely, passive investors with a diversified portfolio should be keenly interested in finding a way to avoid –or at least weaken as much as possible– the impact of a financial crisis on their wealth.
The optimization in (2.2)-(2.3) may be performed on any set of financial assets provided that the two-regime setting in (2.1) is assumed. Numerical software may then be used to find the appropriate asset allocation. However, to determine the robust portfolio analytically in a simple case, we will assume from now on that the market is composed of two assets having volatilities during quiet times, and during crises. The correlation coefficient between the returns of the two assets is during quiet times, and during crises. We also introduce parameter representing the ratio of these correlations:
The position of with respect to unity is left unconstrained. It may either be larger than one in case of contagion or smaller than one when FTQ arises. Therefore, the chosen parameterization will make it easier to conduct further discussions involving FTQ-specific issues.
To obtain tractable analytical results we assume that the crisis has the same relative impact on both assets' volatilities, that is, their crisis-to-quiet time volatility ratios are equal. We consequently introduce parameter for this common ratio. This parameter takes values larger than unity since crises are associated with a rise in volatility:
(2.5)
Short positions are excluded. The two-regime variance (2.1) of portfolio P including a proportion of asset 1 and, consequently, proportion
of asset 2, may be expressed as follows:
(2.6)
The first order condition for minimizing the ratio leads to:
(2.7)
If , meaning that the correlation changes during crises, then the condition simplifies to:
or equivalently:
(2.9)
so that the unique portfolio allocation fulfilling the first-order condition associated with the crisis-robust criterion is given by3 with:
(2.10)
However, as illustrated by Figures 1 and 2 for several point values of the parameters in question, this critical point may well correspond to a maximal value of the volatility ratio as well as to a minimal value depending on the sign of coefficient defined as:
(2.11)
The sign of indicates whether the two assets are subject to contagion or to FTQ . In the first case, the critical point corresponds to a maximal value and is therefore useless. Conversely, when the crises are associated with a decorrelation of the assets, then the critical point provides the optimal composition for a crisis-robust portfolio. Proposition 1 summarizes this result.
Proposition 1: If the market is made up of two assets such that
and , then the ratio reaches an interior minimum
Figure 1
Variance in crisis / variance in quiet period
The variance ratio is calculated as a function of for
Figure 2
Variance in crisis / variance in quiet period
The variance ratio is calculated as a function of for
Portfolio P* is thus the crisis-robust portfolio. Its existence is ensured thanks to the downward shift in the correlation, which compensates, at least to some extent, for the rise in the volatilities of the two asset returns. In the case of contagion, such a compensation effect is impossible and the minimal ratio is obtained for corner solutions, i.e. portfolios made up of a single asset. What is the efficiency of the crisis-robustness criterion? In other words, how close to one is the optimal variance ratio ? Replacing and by their expressions and computing both variances yields:
The next proposition follows from this equation.
Proposition 2: If the market is made up of two assets such that
and , then the minimal ratio is equal to 1 if and
only if .
When FTQ is present, the correlation spread between crisis and quiet period, , is negative and creates a volatility trade-off. Proposition 2 exhibits the threshold to be reached by this correlation spread in order to allow for full compensation, making the volatility of the crisis-robust portfolio totally insensitive to crises. Indeed, we have:
(2.13)
By definition, and , then is always negative. However, in practice, the correlation gap is generally insufficient ( ) to lead to the existence of a portfolio that is totally insensitive to crises4. Consequently, crisis-robust portfolios should be seen as second-best choices.
On Figure 1, all chosen values of are such that . Therefore, none of the represented curves reaches the level of one for the volatility ratio corresponding to a fully crisis-insensitive portfolio. Note that the result is not influenced by the quiet period volatilities of the two assets but only by the crisis-to-quiet period ratio .
Conversely, on Figure 2, for , the curve presents a minimum value with a unit ratio, while for the volatility ratio can be lower than one. This is an unrealistic situation to be avoided, making the volatility during crisis periods smaller than in quiet times.
II. D
ATA
,
DESCRIPTIVE STATISTICS
AND CORRELATION MATRICES
Government and Corporate Bonds
The period under study stretches from July 1998 to May 2007. The dataset is composed of weekly returns of the sovereign and corporate bond indices of two geographic zones: U.S. and Eurozone. Corporate bonds are split into IG and HY.
GVT bonds are represented by the 10-year benchmark indices supplied by Datastream5. These indices, which include coupon returns, are usually based on a single bellwether, namely the last bond issued by the country's Treasury in a given maturity. Factors such as liquidity, issue size and coupons are also taken into account when choosing the index component(s). For corporate bonds, two categories of index were used: IG, with ratings between AAA and BBB-, and HY, rated from BB+ to CCC. These indices exclude convertible bonds and include coupon returns. Data are sourced from Merrill Lynch (i.e., bids quoted by traders at the ML desk) at the market close6.
Figures 3 presents GVT bond prices, Figure 4 draws all corporate bond prices. HY bond indices decreased sharply between 2000 and 2002 in the aftermath of the stock market collapse. Indeed, HY default rates reached historical peaks at that time. Starting from 1.6% in 1998, they reached 5.1% in 2000 and finally 12.8% in 2002 (an historical high on the period 1971-2006). The HY market also recovered very rapidly after 2002. In 2003, the default rate declined to 4.7%, causing a complete change in the HY performance trend at that date. The particular episode of 2000-2002 explains why globally, for the period 1998-2006 under review, the HY bond index underperforms IG bond returns, showing a negative risk premium to less risky assets.
Figure 3
Government bond prices
Figure 4
Corporate bond prices
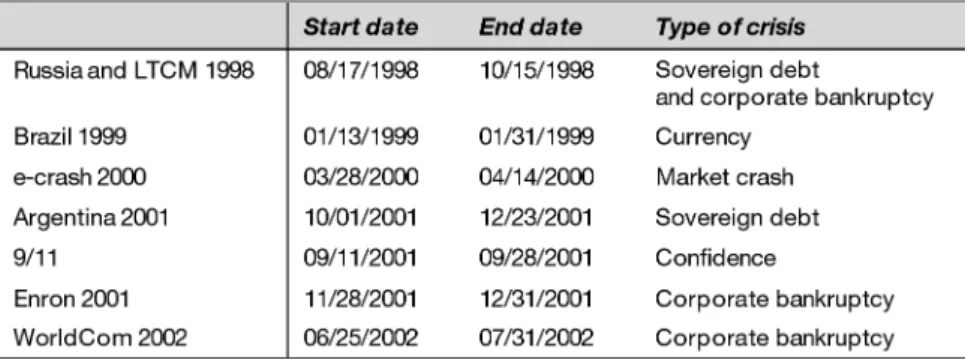
Crises studied
Our definition of "crisis" is broad. It encompasses five types of event: currencies, sovereign debt, bond or equity crash, corporate bankruptcies (Enron, WorldCom), and crises of confidence (9/11). We have deliberately omitted crises of a purely banking nature and economic crises such as recessions or oil shocks. The real difficulty lies in establishing precise timeframes for the crises we have selected.
Table I shows the start and end dates of the crises studied in this article. They have been chosen carefully on the basis of previous research (see Appendix). Admittedly, while the onset of a crisis is usually easy to identify, the end date is much harder to pinpoint. This awkward problem is highlighted by the Asian crisis studied by several authors.
Table I
Descriptive statistics, correlations and volatilities
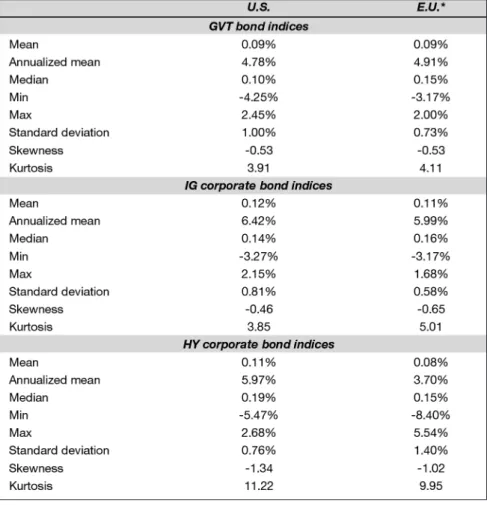
Table II provides descriptive statistics on returns (in local currencies) for all assets in the database, for the whole period (July 1998 - August 2006). All returns have been tested for stationarity (but the results are not reported here). The annualized mean return of GVT bonds is around 4.8%. IG corporate bonds exhibit somewhat larger returns with a risk premium between 108 and 164 bp while their volatility does not show higher values.
Surprisingly, the mean returns of HY bonds are lower than those of IG bonds, and in the case of Europe, even lower than the return on GVT bonds. The most probable explanation for this, as already mentioned, is the presence in the sample period of a huge breakdown (2000-2002) on the HY bond market, leading to a sharp increase in the default rate.
Table II
Descriptive statistics for returns: All bonds, whole period
Weekly returns in local currency, July 1998–May 2007
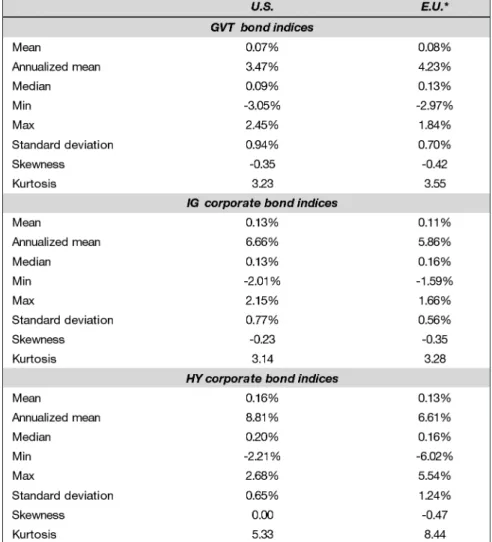
Tables III and IV give the descriptive statistics for crises and quiet periods, respectively. Logically, as testified by their average returns, corporate bonds suffer much more from crises than do GVT assets. In fact, HY bond returns exhibit negative mean returns during crises.
As crises are the exception rather than the rule, the quiet period statistics generally resemble the whole period data. Nevertheless, the anomaly regarding the risk premia over the whole period (i.e. riskier bonds having smaller mean returns) disappears in the quiet-period dataset (Table IV), testifying to the impact of crises on this stylized fact.
Table III
Descriptive statistics for returns: All bonds, Crisis period
Weekly returns in local currency, July 1998–May 2007
Table IV
Descriptive statistics for returns: All bonds, quiet period
Weekly returns in local currency, July 1998–May 2007
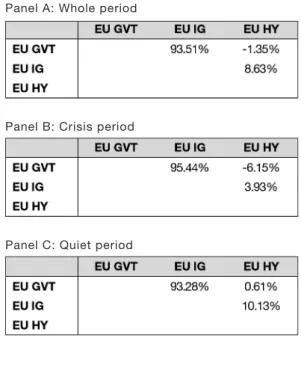
Tables V and VI provide the correlation matrices for, respectively, the whole period, the crises, and the quiet period. In all cases, sovereign and IG bonds exhibit positive correlations. The same is true within the HY bond class. However, correlations between HY bonds and the other categories take values between 0.61% and 29.97% during quiet periods. Most of the time they drop sharply during crises, reaching values comprised between -6.15% and 34.59%. The FTQ effect during crises is clearly observed among bonds.
Table V
Correlation matrix: U.S. bonds
Weekly returns in local currency, July 1998–May 2007
Panel A: Whole period
Panel B: Crisis period
Table VI
Correlation matrix: E.U. bonds
Weekly returns in local currency, July 1998–May 2007
Panel A: Whole period
Panel B: Crisis period
Finally, as the theory has shown (see Propositions 1 and 2 in Section 2), correlation spreads and volatility ratios are key elements in determining crisis-robust portfolios. This information is provided in Tables VII to IX, respectively, thus helping to measure the effects of crises on volatilities and diversification benefits.
Table VII
Correlation spread matrices*, U.S. bonds
Weekly returns in local currency, July 1998–May 2007
*Differences between correlations in crisis and correlations during quiet periods. The cells in grey correspond to the presence of FTQ (correlation decrease).
Table VIII
Correlation spread matrices*, E.U. bonds
Weekly returns in local currency, July 1998–May 2007
*Differences between correlations in crisis and correlations during quiet periods. The cells in grey correspond to the presence of FTQ (correlation decrease).
Table IX Volatility ratios*
Weekly returns in local currency, July 1998–May 2007
Tables VII and VIII show that FTQ is observed in four out of six cases, meaning that crises lead to lower correlations. For instance, on the U.S. market during turmoil, the correlation between sovereign and IG corporate bonds declined more than 8%, from 93.27% to 86.59%. Likewise, the decline in correlation between sovereign and HY bonds reaches 11.14% while intra-corporate bonds (IG and HY) show some contagion (+4.62%). This could mean that, during crises, U.S. bondholders consider public debt as the only really safe asset. Be that as it may, Tables VII and VIII testify to the simultaneous occurrence of contagion and FTQ in the bond market, thus confirming the relevance of our two-correlation-regime approach.
Table IX shows that volatility ratios in our dataset all lie between 1.46 (for GVT bonds in Europe) and 2.26 (for HY bonds in the U.S.). Not surprisingly, the ratios take the largest values in the HY bond category. The two-asset theoretical model in Section 2 assumes a constant ratio. While this hypothesis is clearly not met for every pair of assets, it seems still realistic for U.S. and E.U. sovereign and IG bonds at least. Crisis-robust portfolios can however be determined empirically in all cases. The drawback of not respecting the constant volatility ratio hypothesis is that neither the existence nor the uniqueness of a crisis-robust portfolio is guaranteed by the theory.
III. D
ETERMINING CRISIS
-
ROBUST BOND PORTFOLIOS
For each geographical zone, we determine the crisis-robust portfolio made up of two or three assets. In the two-asset case, only one parameter is required for indicating the portfolio composition. Consequently, it is possible to represent the portfolio volatilities in both regimes, as well as their ratios, as functions of the proportion of an asset in the portfolio.
Take for example the case of U.S. GVT and HY bonds. Figure 5 shows that both volatility curves are U-shaped and thus reach a minimal risk value for a certain proportion of HY bonds in the portfolio (69.91% during calm periods, 50.14% during crisis periods). The volatility ratio is trickier7but still reaches a minimal value at an interior point of the 0%-100% interval. Precisely, the crisis-robust portfolio has a volatility ratio of 1.55 and includes 12.68% of HY bonds. Consequently, HY bonds are indeed present in the crisis-robust portfolio. However, this portfolio is not fully crisis-insensitive since the minimal ratio remains above the unit value.
Figure 5
Volatility during the quiet period and during a crisis, and volatility ratio:
More generally, Table X offers the results for the various possibilities of two –or three– asset U.S. and E.U. portfolios. In each case, we determine the crisis-robust bond portfolio from the standpoint of a domestic investor.
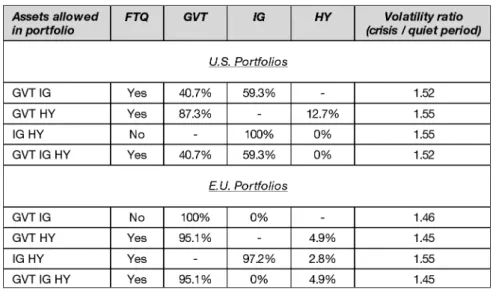
Table X indicates (left column) the assets allowed in the portfolio, then the presence or absence of the FTQ effect. The latter piece of information is derived from Tables VII or VIII depending on the geographical zone in question. In accordance with the theory, the two cases of no-FTQ effect correspond to corner solutions: 100% IG bonds in IG-HY U.S. portfolios, 100% GVT bonds in GVT-IG E.U. portfolios.
Table X
When the FTQ effect is present, the U.S. and E.U. portfolios differ from one another by the respective proportions of the riskiest asset required to reach crisis-robustness. While European investors find their optimum with small proportions (2.8%, 4.9%), U.S. investors need much larger proportions (12.7%, or even 59.3%). Moreover, the optimal ratio is more advantageous for Europeans, as it is (slightly) closer to unity, the best ratio being 1.45 for the E.U. and 1.52 for the U.S.
The difference between the U.S. and Euro portfolio composition is probably attributable to the 2000-2002 “anomaly” mentioned earlier. In fact, in the U.S. during quiet times, IG bond volatility appears lower than sovereign bond volatility (0.77 < 0.94, see Table IV). According to Proposition 1, the share of asset 1 volatility in the sum gives the proportion of asset 2 in the crisis-robust portfolio. Even if the results in Table X do not stricto sensu obey the theory (because the volatility ratio is not constant), Proposition 1 is still a good proxy for the composition of the crisis-robust portfolio. The same “anomaly” occurs in Europe, too, but only in the GVT-IG case, where the FTQ effect does not appear. Conversely, the HY European bonds exhibit greater volatility than do the two other classes. As these cases correspond to the occurrence of the FTQ effect, only relatively small amounts of HY bonds are to be included in crisis-robust portfolios.
Note also that, in both the U.S. and the Eurozone, putting the three assets together does not make the optimal portfolio more crisis-robust. Since the theory is restricted to the two-asset case, we cannot infer the generality of this observation. But, on the basis of this stylized fact, we conjecture that only a few securities exhibiting FTQ effects would be required to (partially) hedge a portfolio against financial turmoil.
IV. C
ONCLUSION
Several past events have pointed to the necessity for investors to take into account the possibility that financial crises may occur. That said, each crisis has its own pattern: some start slowly, others abruptly; some are short, others last longer; some hit specific assets, others are general. Therefore, waiting for a crisis to erupt in order to rebalance a portfolio is hazardous. So this study offers the concept of a crisis-robust portfolio, that is, a portfolio exhibiting the lowest volatility ratio between turmoil and quiet periods. Our work highlights the somewhat paradoxical result that introducing risky assets into a portfolio can “hedge” against a rise in volatility during crises. This result is established analytically as well as empirically. In a two-asset framework, the presence of the riskiest asset in the crisis-robust portfolio is solely linked to the occurrence of a flight-to-quality (FTQ) effect, namely an asset decorrelation during crises.
The empirical application provided here is rather simple, aimed at illustrating the fact that crisis-robust portfolios can include a substantial fraction of risky assets when FTQ is observed instead of contagion. In this respect, the bond market offers a natural arena for examples. Other cases of FTQ have also been identified, in particular in the bond-stock correlation (Hartmann et al. (2001), Baur and Lucey (2006)). Therefore, a natural extension of this work would be to test crisis robustness in the case of larger portfolios that also include stocks. Indeed, contagion and its unpleasant consequences for portfolio management have been now extensively described. But surprisingly, little attention has been paid to the benefits that can be obtained by overweighting assets whose correlations decrease during crises. Actually, acknowledging the FTQ effect helps reduce the perceived “drama” surrounding financial crises. More empirics are obviously needed to gauge the size of FTQ on global financial markets.
Crisis-robustness is, however, a debatable criterion for portfolio management, for several reasons. First, in this framework, the investor does not choose the level of risk as such. As safer assets tend to be less influenced by crises
than highly risky assets, a crisis-robust portfolio will be low-risk overall, but not necessarily the one with the minimal risk over the whole period or under a given regime. In this respect, the investor’s classic level of risk aversion is replaced by an aversion to higher volatility during crises.
Second, crisis-robustness concerns volatility only. The fact that returns decrease during crises is not taken into account. Further research could investigate the distorsions of the risk-return relationship during crises and check whether the volatility gains associated with crisis-robust portfolios are adversely affected by return costs. The intuition is that the result would depend on the level of investors’ crisis-awareness. In markets where portfolios are generally composed in a single regime setting, crisis-robust portfolios offer free hedging, whereas in two-regime markets, recognized by investors and integrated in their optimization along the lines of our model, asset pricing would incorporate the pricing of the hedge.
Third, crisis-robustness is formulated here in relative terms, as a ratio between the volatilities in the two regimes. Other formulations involving, for example, the frequency of a crisis or some kind of weighted average volatility level, could lead to better criteria. A ratio has been chosen here for simplicity but our main goal was to advocate looking for a crisis-conscious investment rather than having to scrutinize the market each morning and decide whether or not to change the portfolio's composition.
Going further on this issue would require a more general theoretical framework for investors’ fears and attitudes regarding crises. In this respect, behavioral finance (Malkiel et al. (2005), Bourachnikova (2007)) has shown that people tend to overestimate the probability of detrimental but rare events. By not introducing the probability of a crisis occurrence into our model, we provide a theoretical approach compatible with any view (rational or not) about the possibility of a crisis. Moreover, constraints could be added to the proposed optimization, such as a maximal level of volatility in either of the given regime, or even in both.
Finally, the model in this study is static since no composition update is considered. This is of course a major limitation, because extensive evidence of highly unstable correlations can be found in econometric papers (Engle (2002), Goetzmann et al. (2005)). Further research could therefore consider a dynamic counterpart, including for instance a two-regime random correlation coefficient.
N
OTES
1 “Because the regime is not observable, the estimation involves inferring from the data which regime prevails at each point in time” (Ang and Beckaert, 2004, p.89).
2 In this respect, the applications of the model are widely open as no crisis specification is needed. Indeed, different portfolio management styles may be sensitive to different crisis types.
3 Other solutions may exist if the no-short selling condition is waived.
4 However, in theory, it can happen that two interior portfolios are crises-insensitive because the correlation gap is so huge that it overcompensate the variance growth. In such a situation, as a matter of fact, the variance-ratio minimization is inappropriate due to the fact that the denominator may exceed the numerator.
5 For Eurozone, the German bond index.
6 The indices have minor differences. For investment grade indices, we selected a maturity of 7 to 10 years. However, for HY indices, maturity was not proposed as a selection parameter, so there are small differences in duration. Furthermore, the geographical indices for both IG and HY securities have median ratings that may vary slightly. Moreover, the number of index components varies from one country to another.
7 If the assumptions made in the theoretical part were fully satisfied, this curve would also exhibit a U-shape. This is not the case since the GVT bond volatility ratio is 1.56 while the HY one is much larger (2.26). Nevertheless, a numerical optimisation can always be performed.
A
PPENDIX
: C
RISES SELECTED FOR STUDY
In this study, we examine five types of crisis: (1) currency crises, (2) sovereign debt crises, (3) crises triggered by an equity or bond crash, (4) corporate bankruptcies or loss of confidence (e.g. the collapse of Enron), and (5) crises of confidence arising from severe external events (e.g. 9/11).
• Currency crisis
Brazil 1999Dungey et al. (2002) say that the crisis began on January 13, 1999 with the devaluation of the real. It is hard to establish an end date because no landmark events occurred. However, the crisis is generally referred to as the "January 1999 Brazilian crisis". We have therefore taken the final date to be the end of January 1999.
• Sovereign debt crises
Russia 1998The Russian crisis began on August 17, 1998, when the country defaulted on its debt, and continued until September of that year, when another crisis was triggered by the collapse of the hedge fund LTCM. We have therefore considered these two crises jointly, setting the end date for both at the end of the LTCM crisis.
Argentina 2001
The crisis began on the November 1, 2001 when Argentina announced a debt restructuring plan. On December 5, the IMF refused to release funds to help the country, and the Argentine president was forced to resign on December 20. On December 23, 2001, the country announced that it was
in default. For investors, the announcement marked the end of the crisis, and emerging spreads began to narrow (BIS, March 2002).
• Crashes
e-crash 2000Triggered by the crash in tech stocks, the equity meltdown began on March 28, 2000. We have dated the end of the crisis to April 14, 2000, when prices stopped falling. Thereafter, the market entered a period of stagnation.
• Corporate bankruptcies and crises of confidence
LTCM 1998The hedge fund Long Term Capital Management (LCTM) collapsed on September 23, 1998. Dungey et al. (2002) consider that the crisis ended when the U.S. Federal Reserve decided to cut interest rates in order to contain the fallout. The Fed's decision was taken unexpectedly between two FOMC meetings on October 15, 1998.
Enron 2001
The onset of the crisis can be dated to November 28, 2001, when Moody's Investor Services decided to downgrade Enron, taking it from IG to HY. Although it was Moody's decision that sparked the mood of wariness which spread to all financial markets, signs that Enron was in trouble had emerged much earlier. On October 16, 2001, the company lowered its earnings guidance (BIS (March 2002)), and on November 8, it announced a retroactive adjustment to all its results since 1997. Enron filed for bankruptcy on December 2. It is extremely difficult to set a precise end date, and we consider that the crisis lasted throughout December.
WorldCom 2002
The crisis related to the bankruptcy of WorldCom began on June 25, 2002, when the company revealed accounting inaccuracies concealing losses of $3.8 billion in 2001 and 2002; it also announced 17,000 job cuts, equivalent to 20% of the workforce. WorldCom filed for bankruptcy on July 11, and its share fell 80% over the next four months. Once again it is very hard to establish an end date because the loss of confidence was exacerbated by fears relating to terrorist attacks in May and June 2002 and to political tensions between India and Pakistan. According to the BIS (September 2002), the most significant crisis-related market movements occurred between July 10 and 23. We therefore consider that the crisis lasted until end-July 2002.
• Other crisis of confidence
9/11The terrorist attacks on the USA on September 11, 2001 sparked a crisis of confidence across markets worldwide. It is hard to say precisely when the crisis ended, but we have considered that it lasted for the whole of September.
R
EFERENCES
• Alexander, G.J., A.K. Edwards and M.G. Ferri (2000), "What does Nasdaq's high-yield bond market reveal about bondholder-stockholder conflicts?", Financial Management, Spring, 23-39.
•Ang, A. and G. Bekaert (2002), "International asset allocation with regime shifts", Review of Financial Studies, 15, 4, 1137-1187.
•Ang, A. and G. Bekaert (2004), "How Regimes Affect Asset Allocation"
Financial Analysts Journal, March/April, 86-99.
•Baig, T. and I. Goldfajn (1999), “Financial market contagion in the Asian crisis”, IMF Staff Papers, 46, 2, 167-195.
•Baur, D. and B.M. Lucey (2006), “Flight to quality or contagion? An empirical analysis of stock-bond correlations”, IIIS Discussion Paper no.122, Trinity College, Dublin.
•Beber, A., M. W. Brandt, and K.A. Kavajecz (2007), "Flight-to-Quality or Flight-to-Liquidity? Evidence from the Euro-Area Bond Market", working paper, HEC, University of Lausanne, Fuqua School of Business, Duke University and School of Business, University of Wisconsin - Madison.
•Bekaert, G. and G. Wu (2000), "Asymmetric volatility and risk in equity markets", Review of Financial Studies, 13,1, 1-42.
•Bekaert, G., C.R. Harvey and A. Ng (2005), "Market integration and contagion", Journal of Business, 78, 39-69.
•Berben, R.-P and W.J. Jansen (2005), "Comovement in international equity markets: A sectoral view", Journal of International Money and Finance, 24, 832-857.
•BIS (1999), "A review of financial markets events in Autumn 1998", Committee on the Global Markets Events in Autumn 1998.
•BIS (2002), Quarterly Review, March.
•BIS (2002a), Quarterly Review, September.
•Bookstaber R. (1997), "Global risk management: Are we missing the point?", Journal of Portfolio Management, 23, 3, 102-107.
•Bourachnikova O. (2007), "Weighting Function in the Behavioral Portfolio Theory", working Paper CEB no. 07-011, Solvay Business School, ULB.
•Caporale, G.M., A. Cipollini and N. Spagnolo (2005), "Testing for contagion: A conditional correlation analysis", Journal of Empirical Finance, 12, 476-489.
•Chakrabarti, R. and R. Roll (2002), "East Asia and Europe during the 1997 Asian collapse: A clinical study of a financial crisis", Journal of Financial
Markets, 5, 1-30.
•Chow, G., E. Jacquier, M. Kritzman, and K. Lowry (1999), "Optimal portfolios in good times and bad”, Financial Analysts Journal, 55, 3, 65-73.
•Connolly R., C. Stivers C. and L. Sun (2005), "Stock market uncertainty and the stock-bond return relation", Journal of Financial and Quantitative
Analysis, 40, 1, 161-194.
•De Santis, G. and B. Gérard (1997), "International asset pricing and portfolio diversification with time-varying risk", Journal of Finance, 52, 1881-1912.
•Dungey R., R. Fry, B. Gonzalez-Hermosillo and M. Vance (2006), “Contagion in international bond markets during the Russian and the LTCM crises”, Journal of Financial Stability, 2, 1, 1-27.
•Ellis L. and E. Lewis (2001), “The response of financial markets in Australia and New Zealand to news about the Asian crisis”, Reserve Bank of Australia, Research Discussion Paper 2001-03.
•Engle R. (2002), “Dynamic Conditional Correlation: A simple class of multivariate generalized autoregressive conditional heteroskedasticity models”,
Journal of Business & Economic Statistics, 20, 3, 339-350.
•Forbes, K. et Rigobon R. (2002), “No contagion, only interdependence: Measuring stock market comovements”, Journal of Finance, 57, 5, 2223-2261.
•Gebhardt, W.R., S. Hvidkjaer and B. Swaminathan (2005), "Stock and bond market interaction: Does momentum spill over?", Journal of Financial
Economics, 75, 651-690.
•Goetzmann, W.N., L. Li and K.G. Rouwenhorst (2005), "Long-term global market correlations", Journal of Business, 78, 1, 1-38.
•Gulko, L. (2002), “Decoupling”, Journal of Portfolio Management, 28, 3, 59-67.
•Hartmann, P., S. Straetsman, and C.G. de Vries (2001), "Asset market linkages in crisis periods", Tinbergen Institute Discussion Papers 01-071/2, Tinbergen Institute.
•Hong Y., J. Tu and G. Zhou (2003), "Asymmetric correlation of stock returns: Statistical tests and economic evaluation", Working Paper, Washington University.
•Jennrich, R.I. (1970), "An asymptotic chi-square test for the equality of two correlation matrices", Journal of the American Statistical Association, 65, 330, 904-912.
•Kaminsky G.L. and S.L. Schmulker (1999), “What Triggers Market Jitters? A Chronicle of the Asian crisis”, Journal of International Money and
Finance, 18, 537-560.
•Kim J. and C.C. Finger (2000), "A stress test to incorporate correlation breakdown", Journal of Risk, 2, 3.
•Lin, W.L., R.F. Engle, and T. Ito (1994), "Do bulls and bears move across borders? International transmission of stock returns and volatility", Review
of Financial Studies, 7, 507-538.
•Longin F. and B. Solnik (1995), "Is the Correlation in International equity returns constant: 1960-1990?", Journal of International Money and Finance, 14, 1, 3-26.
•Longin F. and B. Solnik (2001), "Extreme correlation of international equity markets", Journal of Finance, 56, 2, 649-675.
•Loretan M. and W.B. English (2000), "Evaluating 'correlation breakdowns' during periods of market volatility", Board of Governors of the Federal Reserve, International Finance Discussion Paper no. 658.
•Malkiel, B., S. Mullainathan, and B. Stangle (2005), “Market Efficiency versus Behavioral Finance”, Journal of Applied Corporate Finance, 17, 3, 124–136.
•Martens, M., and S.-H. Poon (2001), "Returns synchronization and daily correlation dynamics between international stock markets", Journal of
Banking & Finance, 25, 1805-1827.
•Neudecker, H., and A.M. Wesselman (1990), "The asymptotic variance matrix of the sample correlation matrix", Linear Algebra and Its Applications, 127, 589-599.
•Ragea V. (2003), “Testing correlation stability during hectic financial markets”, Financial Markets and Portfolio Management, 17, 3, 289-308.
•Reilly, F., Wright D. and K. Chan (2000), “Bond market volatility compared to stock market volatility”, Journal of Portfolio Management, Fall, 27, 82-92.
•Rigobon, R. (2001), “Contagion: How to Measure It?”, NBER Working Paper no. W8118.
•Sander, H. and S. Kleimeier (2003), “Contagion and causality: An empirical investigation of four Asian crisis episodes”, Journal of International
Financial Markets, Institutions and Money, 13, 2, 171-186.
•Shackman, J. D. (2006), "The equity premium and market integration: Evidence from international data", Journal of International Financial Markets,
Institutions and Money, 16, 2, 155-179.
•Sheedy, E. (1997), "Correlation in international equity and currency markets: A risk adjusted perspective", Macquarie University, Sydney, CMBF Papers no. 17.
•Silvapulle, P., and C.W.J. Granger (2001), "Large returns, conditional correlation and portfolio diversification: A Value-at-Risk approach,", Quantitative
Finance, 1, 1-10.
•Smith K.L. (2002), "Government bond market seasonality, diversification and cointegration: International evidence", Journal of Financial Research, 25, 2, 203-221.
•Stivers C. and L. Sun (2002), "Stock market uncertainty and the relation between stock and bond returns", Federal Reserve Bank of Atlanta, Working paper no. 2002-3.
•Tse, Y.K. (2000), "A test for constant correlations in a multivariate GARCH model", Journal of Econometrics, 98, 107-127.
An investment management company approved by the French Securities Authority (Autorité des Marchés Financiers - “AMF”) under No. GP04000036. Registered office: 90, boulevard Pasteur 75015 Paris-France. 437 574 452 RCS Paris. In each country where they carry on investment business, Crédit Agricole Asset Management and its affiliates are regulated by the local regulatory authority. This information contained herein is not intended for distribution to, or use by, any person or entity in any country or jurisdiction where to do so would be contrary to law or regulation or which would subject Crédit Agricole Asset Management or its affiliates to any registration requirements in these jurisdictions. The information contained herein is produced for information purposes only and shall not be considered as an investment advice nor the sole basis for the evaluation of any CAAM’s product. Any data provided herein is based on assumptions and parameters that reflect our good faith judgment or selection and therefore no guarantee is given as to the accuracy, completeness or reasonableness of any such data. No examination has been executed by us with respect to the financial, legal, tax, regulatory –and any related aspects thereof– situation of any addressee of the information herein”.
Investors tend to gravitate towards low-risk securities such as government bonds during financial crises. Typically, stock market volatility increases during such crises, a situation usually compounded by closer correlation between assets. This contagion makes diversification less efficient. For investors, the combination of widespread increases in volatility and correlation is pernicious because it forces them to cope with a dual in-crease in risk unless they modify their portfolios. In such cases, they may be tempted to sell off their most volatile securities and increase
the proportion of the safest investments.
The key question here is to detect precisely when a crisis occurs in order to switch portfolios in time. Because the onset can be sudden, investors may miss the optimal reaction date and bear the brunt of the initial shocks. Therefore, with a dual regime, portfolio managers have to monitor the situation constantly.
In this study, we develop an alternative concept - the crisis-robust portfolio - that consists in determining the optimal asset composition for minimizing the volatility ratio between crises and quiet periods. In other words, it means holding a portfolio that is as insensitive as possible to regime switches. In practice, a crisis-robust portfolio enables asset managers to respect the volatility thresholds they have promised their clients. One might think that crisis-robust bond portfolios are composed solely of the highest quality securities, i.e. developed countries' sovereign bonds, because their volatility is low, even during periods of turmoil. How-ever, a flight-to-quality effect undermines this argument. The decline in the correlations between risky and safe assets during such periods
is good news for diversification. Therefore, thanks to more effective diver-sification, a fixed income portfolio including some corporate bonds (in-vestment grade or high yield, depending on the country) may withstand crises better than a 100% - safe portfolio.
Marie Brière, PhD in Economics, is Head of Fixed Income, Forex and Volatil-ity Strategy at Crédit Agricole Asset Management, associate researcher with the Centre Emile Bernheim at Université Libre de Bruxelles (ULB) and affiliate professor at CERAM Business School.
Professor Ariane Szafarz, PhD in Science, teaches finance and mathematics at the Université Libre de Bruxelles (ULB). She is Director of the Centre Emile Bernheim, the PhD programme in Management Sciences (Solvay Business School), and the European Master in Microfinance.