HAL Id: hal-01168513
https://hal.archives-ouvertes.fr/hal-01168513
Submitted on 26 Jun 2015
HAL is a multi-disciplinary open access
archive for the deposit and dissemination of
sci-entific research documents, whether they are
pub-lished or not. The documents may come from
L’archive ouverte pluridisciplinaire HAL, est
destinée au dépôt et à la diffusion de documents
scientifiques de niveau recherche, publiés ou non,
émanant des établissements d’enseignement et de
A Review on the Public Benchmark Databases for Static
Keystroke Dynamics
Romain Giot, Bernadette Dorizzi, Christophe Rosenberger
To cite this version:
Romain Giot, Bernadette Dorizzi, Christophe Rosenberger. A Review on the Public Benchmark
Databases for Static Keystroke Dynamics. Computers and Security, Elsevier, 2015, pp.1-35.
�hal-01168513�
A Review on the Public Benchmark Databases for
Static Keystroke Dynamics
Romain Giot1, Bernadette Dorizzi2, Christophe Rosenberger3
Abstract
Keystroke dynamics allows to authenticate individuals through their way of typing their password or a free text on a keyboard. In general, in biometrics, a novel algorithm is validated through a comparison to the state of the art one’s using some datasets in an offline way. Several benchmark datasets for keystroke dynamics have been proposed in the literature. They differ in many ways and their intrinsic properties influence the performance of the algorithms under evaluation. In this work, we (a) provide a literature review on existing benchmark datasets of keystroke dynamics; (b) present several criteria and tests in order to characterize them; (c) and apply these criteria on these available public benchmark datasets. The review analysis shows a great disparity in the acquisition protocol, the population involved, the complexity of the passwords, or the expected performance (there is a relative difference of 76% between the EER on the worst and best performing datasets with the same authentication method).
Keywords: keystroke dynamics, benchmark algorithms, biometric performance evaluation, online and offline computation
1. Introduction
Keystroke dynamics [1] is a behavioural biometric modality, which allows the authentication of individuals through their way of typing their password on a keyboard. It is a behavioural biometrics which presents the advantage of not requiring additional sensor than the keyboard at hand and which allows au-thentication through time (on-line auau-thentication). It is probably the cheapest biometric modality available of a personal computer.
Biometric systems are validated thanks to datasets that are collected for this purpose and can be qualified in function of the problem that one wants
1R. Giot is with Univ. Bordeaux - LaBRI
2B. Dorizzi is with Institut Mines T´el´ecom/T´el´ecom SudParis (IMT/TSP)
3C. Rosenberger is with ENSICAEN - GREYC, email: [email protected],
to solve. For instance, if one wants to benchmark algorithms for face recog-nition, the algorithms may give very different performance on a dataset which contains no variability (visage is frontal with no expression and no illumination variation) and on other dataset which contains some of these variabilities. The choice of the dataset is therefore guided by the precise problem the algorithm aims at solving. A good evaluation framework corresponds to the association of a reference system, a dataset and an associated evaluation protocol which fixes the way the dataset is used. This way, it is possible to compare different systems between them without providing any bias and to report comparative results using some error measures which very often in biometrics corresponds to EER and ROC curves [2, 3]. Such protocols have been proposed for most of the biometric modalities as described in [4]. Keystroke dynamics is a recent modality for which no such framework has been yet proposed. One of the aims of the present work is to give some report of the existing situation in terms of publicly available datasets and to suggest some criteria that could guide the construction of new datasets helpful for the research community.
Although the authentication is done in real time (i.e., online) in a real world system, scientists working on keystroke dynamics do not analyze the perfor-mance of their system online (i.e, by asking users to authenticate themselves in real time and to impersonate other users). Indeed, they work in an offline way by using samples previously collected, probably by other researchers, and stored in a benchmark dataset. Thus, data collection and algorithms evaluation are often two separated tasks. The evaluation of algorithms is eased thanks to this offline procedure. If scientists share the same common benchmark, they can fairly compare their algorithms by considering error results and time consump-tion. Experiments become easily reproducible, which is an important criterion in scientific studies (although datasets could contain errors). Data collection is a tedious and time consuming task, which can explain why there are only few benchmark datasets of high quality. It is important to characterize the datasets in order to be able to easily compare them, and to choose the adequate one depending on the study.
A keystroke dynamic (KD) system (KDS) is composed of two main modules: the enrollment and the verification modules. Each user must enroll himself in the KDS which computes a biometric reference given multiple samples (i.e., several inputs of the password) acquired during the enrollment step. For each input, a sequence of timing information is captured (i.e., time when each key is pressed or released) from which some features are extracted (i.e., latencies and durations) and used to learn the model which characterizes each user. During a verification request, the claimant types his/her password. The system extracts the features and compares them to the biometric reference of the claimant. If the obtained distance is below a threshold, the user is accepted, otherwise he/she is rejected. An optional module can be used to automatically update the model of the user [5]. This can be important, as the KD data is not permanent and evolves with time [5, 6]. First works on KD have been done in the eighties [7], although
the idea of using a keyboard to automatically identify individuals has first been presented in 1975 [8]. In the preliminary report of Gaines et al. [7], seven secre-taries typed several paragraphs of text and researchers showed that it is possible to differentiate users with their typing patterns. Since then, several studies have been done, allowing to decrease the quantity of information needed to build the biometric reference, while improving the performances [9, 10, 11, 12, 13]. How-ever, most studies are not comparable because they use different datasets or protocols [13, 14].
In this paper, we present a review of existing publicly accessible benchmark datasets for keystroke dynamics. We also propose a methodology to character-ize these KD benchmark datasets (KDB). Although, it would be fruitful to rank them according to some criteria, it is actually difficult to give them a score be-cause such score cannot be generic, as it would depend on the kind of study we want to do, and would be based on too many subjective points. Consequently, in this work, we aim at considering all the interesting points to analyze in order to qualify a KDB; using this information, the scientist will be able to choose the best dataset adapted to his particular experiment. Alternatively, it can also help him to create a new dataset of higher quality than the existing ones and maybe more suitable to the problem he wants to tackle with. In this work, we focus only on static password KD authentication systems (i.e., each user is authenticated thanks to the typing of an expected password, and not free text). The originality of this work is (a) the proposition of a complete set of criteria for characterizing different datasets, which is lacking in this field, and (b) the analysis of all the existing public KDB with respects to these criteria. We think this work is important, because it is known that KD studies are not fair as (i) acquisition protocols are different between studies [13]; (ii) there is not always a comparative study [14] when authors propose new algorithms; and (iii) there are not always a valuable statistical evaluation [14]. Our work helps to solve the two first problems, while methods presented in [15] can solve the third one.
The paper is organized as follows. Section 2 presents a review of existing benchmark datasets for keystroke dynamics. Section 3 presents the various important elements to consider when characterizing KDB. Section 4 realizes a comparative study of public KDB by using all the criteria defined in the previous sections. Section 5 concludes this paper.
2. Existing Benchmark Datasets for Keystroke Dynamics
Contrary to other biometric modalities, there are only few public datasets for KD. Authors of [16] list three public KDB. However, we found 4 additional ones, but it still stays a low number, in comparison to face recognition, for example. These datasets are detailed in section 4 considering all the important criteria defined in section 3. Note that some of these datasets can be composed of several sub-datasets:
2.1. GREYC
Giot et al. propose the most important public dataset considering the num-ber of users. It contains 133 users and, 100 of them provided samples of, at least, 5 distinct sessions [17]. Most sessions are spaced of 1 week at least. Each user typed the password “greyc laboratory” 12 times, on two distinct keyboards, during each session (which gives 60 samples for the 100 users having participated to each session). Both extracted features (hold time and latencies) and raw data are available (which allows computing other extracted features). The dataset4is stored in a sqlite dataset file.
2.2. WEBGREYC{A,B}
Giot et al. propose the most important public dataset [18] in term of number of sessions [16]. 118 users had the possibility to acquire their biometric samples one time per week during 1.5 year The maximum number of sessions for one user is 47 sessions. The best advantage of this dataset it that it contains two kinds of biometric samples: (i) imposed login and password as with all the other KD datasets, WEBGREYCA ; (ii) login and password chosen by the user (several impostors are also asked to type it), WEBGREYCB. So, this is the first public dataset where each user has its own password. It is then the most realist one. The dataset5is stored in a set of text file and contains both raw and extracted features.
2.3. DSN2009
Killourhy et al. propose the most important dataset in term of number of samples per user. This dataset of 51 users provides 400 samples captured in 8 sessions (there are 50 inputs per session) [19]. The delay between each session is one day at minimum. This is the dataset having the larger number of samples per user, but a lot of them have been captured on a too short period (50 at the same time). Each biometric data has been captured when typing the following password: “.tie5Roan”. The dataset contains some extracted features: hold time, interval between two pressures, interval between the release of a key, and the pressure of the next one. The dataset6 is stored in raw text, csv and Excel files.
2.4. PRESSURE{0,1,2}
Allen has created a public KD dataset using a pressure sensitive keyboard [20]. It embeds the following raw data: key code, time when pressed, time when re-lease, pressure force. 104 users are present on the dataset, but only 7 of them provided a significant amount of data (between 89 to 504 samples), whereas the
4http://www.epaymentbiometrics.ensicaen.fr/index.php?option=com_content&view= article&id=19&catid=2&Itemid=101 5http://www.epaymentbiometrics.ensicaen.fr/index.php?option=com_content&view= article&id=20&catid=2&Itemid=10 6 http://www.cs.cmu.edu/~keystroke/
97 other have only provided between 3 to 15 samples. Three different passwords have been typed: “pr7q1z” (PRESSURE2), “jeffrey allen” (PRESSURE1) and “drizzle”. (PRESSURE3) The dataset7 is available in a csv or sql file.
2.5. BIOCHAVES{A,B,C}
The biochaves team has used the same KDB in several papers [21, 22, 23]. There are 3 sub-datasets (A, B, C) for static-text and 1 dataset (D) for free-text8. The maximum number of users in a dataset is 15 and the number of provided samples per user is 10. Each dataset contains the raw data of some users providing 10 samples. It seems that users are different among the datasets. The dataset is composed of couples of ASCII codes of the pressed key and the elapsed time since the last key down event. Release of a key is not tracked. Each dataset is stored in raw text files.
2.6. Keystroke100
Loy et al. have created a public KD dataset, which also contains pressure information [24]. 100 users provided 10 samples each. In our experiments, we only used the latency information, not the pressure one. The dataset9 is available in text files.
2.7. GREYC-NISLAB{A,B,C,D,E}
Syed Idrus et al. have recently released a dataset created for a study on the recognition of soft biometric traits for keystroke dynamics [25]. However it can also be used for classical keystroke dynamics authentication. 110 users provided 10 inputs of 5 different passwords during several sessions typed with one hand and 10 additional ones with two hands. Acquisition has been done with the same software than the GREYC database. The dataset10 is available in Excel file.
2.8. Discussion
These short descriptions already show the great variability of the KD datasets. Our objective in this paper is to deeply analyze these benchmark datasets in order to give the most complete information to researchers working in the field of keystroke dynamics and who would like to test their algorithms using them. In the next section, we define the important elements to consider for the char-acterization of keystroke dynamics datasets.
7http://jdadesign.net/2010/04/pressure-sensitive-keystroke-dynamics-dataset/ 8http://www.biochaves.com/en/download.htm 9 http://www.eecs.qmul.ac.uk/~ccloy/downloads_keystroke100.html 10http://www.epaymentbiometrics.ensicaen.fr/index.php?option=com_content&view= article&id=21&catid=2&Itemid=101
3. Characterization of Biometric Datasets
In order to characterize KDB, we present a brief state of the art of on dataset characterization in biometrics.
3.1. State of the Art
Dataset characterization does not seem to be a research field deeply stud-ied. It is a real issue for the biometric community, as the results of biometric authentication methods deeply depend on the chosen dataset.
Mau et al. analyzed the characterization of face recognition systems [26]. They reviewed large public datasets for still images and videos and listed var-ious points of differences between datasets or studies: (i) Does the evaluation uses a single image as reference, image sets or videos? (ii) Is it an open-set or a closed set evaluation? (iii) Is the capture controlled or uncontrolled? (iv) Which kind of protocol has been used (identification, verification, screening)? (v) Which evaluation metrics are used? All these parameters must be fixed in order to compare various algorithms. They argued that several evaluation mea-sures must be used, because none of them can be adapted to all scenarios. It is also important to analyze the relationships between dataset size and accuracy, dataset size and processing speed, and memory usage of the face recognition algorithms.
Li et al. have presented a method to characterize fingerprint datasets [27]. They compute a level of difficulty of a fingerprint dataset by doing a linear combination of various metrics: the samples quality, the relative rotation and deformation, and the common area between the reference and probe to compare. Three difficulty levels can be obtained (i) easy, (ii) normal, (iii) and difficult. They only used genuine mated pairs for computing the level of difficulty. Al-though their method is correlated to the Equal Error Rate (EER), we think that it is biased as it only analyses the facility of matching genuine samples, but not the difficulty for impostors to be accepted as genuine (which may explain why in two cases, EER and difficulty are not correlated). We think that EER is well correlated to this difficulty factor, most of the time because fingerprints of different users are rather different (which is less true for KD).
Veres el al. presented a method for computing the minimal number of sam-ples, users, and samples per user to create a dataset allowing to obtain repre-sentative results for a specified error rate [28]. The optimal values are obtained from a first dataset used to compute the selected error rate. It is then neces-sary to acquire another dataset, under the same conditions, in order to obtain representative results. Their work is illustrated on gait recognition, but can be generalized to other modalities.
The humanID gait challenge presents a good overview of gait recognition performances [29]. HumanID proposed one gait dataset of 122 users and one
baseline verification method, which is tested among 12 different experiments. The experiments were of various difficulties corresponding to different configu-rations (walking surface, camera angle, time difference between captures, shoes, carrying or not a bag). The baseline system performed quite well in the sim-plest scenarios. The variable factors had a different impact on the recognition performance. They also showed that normalizing the scores allows to improve the verification performance. The aim of the study is to allow researchers to test their own algorithms in the same conditions in order to improve them by comparison to the baseline system. Note that the dataset is larger in number of user than previous ones.
Based on this state of the art, we propose a specific method to characterize keystroke dynamics datasets and its associated criteria.
3.2. Characterization of Keystroke Dynamics Datasets
Considering the specificities of KD, we have identified several aspects that should be analysed on KD datasets as they are expected to influence the per-formance of any recognition system. They are mentioned in [13, 19, 18] and are related to: (i) the acquisition procedure; (ii) the distribution of the population and samples; (iii) the specificities of the password; and (iv) the performance of a baseline authentication method on the dataset.
3.2.1. The Acquisition Procedure
Various points can vary during the acquisition procedure of a dataset and we think they can impact its quality as well as the performance of the authentication method applied on it.
Duration of the dataset acquisition. KD is a behavioral biometric modality which has an important intra-class variability over time [6, 5]. For an oper-ational scenario, we expect to obtain better and non realistic performance on short term datasets than on long term ones. Indeed, only datasets with long term acquisition time span can be used for template update studies. Note that this information is different from the number of sessions, because several sessions can be acquired in a short amount of time. This information can be expressed in number of days between the first and last acquisition (e.g., 128 days).
Are typing errors allowed? If a user does a typing mistake during the capture of the KD, the correction of the mistake changes the way of typing the text as more keystrokes are used to correct it. Thus, the captured information does not match the model at all. As the management of keystroke dynamics authentication with typing corrections is a recently opened field of research [30], most acquisition tools force users to type correctly the text. If a user does a typing mistake, he/she must restart the capture process from scratch. This information can be expressed with a boolean (e.g., acquisition does not allow typing mistakes.)
Is the acquisition done in a quiet and stable environment? To know the acqui-sition environment is also an interesting information. Once again, we expect more stable patterns in quiet environments than in disturbed ones (i.e., better performance). This can be expressed using words (e.g., noisy room with people talking, but same machine with keyboard at the same place each time).
Is the acquisition controlled by an operator? When the acquisition is controlled by an operator, we assert that the dataset contains none or few erroneous data and users have respected clearly and properly the acquisition protocol. If this is not the case, we could not be totally confident on the quality of the dataset and on the results obtained on it. This information is expressed using a boolean value (e.g., yes, the acquisition is controlled).
Is there one unique password for all the users? Does each user types its own password, or a shared one? It is complex and time consuming to acquire a dataset with enough users providing a different password, that is why most of KD datasets use only one shared password. When only one password is used, genuine typing of users are also used as impostor typing for other users. So, users probably type the password for impostures more often than in a dataset with different passwords, and they learn more quickly how to type it. This information is specified using (a) a boolean value (e.g., yes, all the users share the same password), (b) a string or (c) list of strings representing the password(s) to type.
Operating System (OS) used. The OS plays a role in the accuracy of the timing capture [31]. This information can be specified (a) with a string giving the OS name (e.g., Ubuntu 13.10), (b) a number symbolising a predefined value in a list of possible OS (e.g., OS#2), or (c) a histogram if each user can launch the experiment on a different OS.
Type of Keyboard used. There is a high variability of keyboards (shape of the keyboard, position of the keys, language targeted, mechanical key technology, . . . ). Although it has not been proved for all these variabilities, we can assert that several of them have an impact on the performance mainly because fingers movement are different. This information can be specified with words (e.g., AZERTY keyboard with an ergonomic shape) or an image.
Failure To Acquire Rate. FTAR could give an idea on the password typing difficulty. In KD, there is a failure to acquire when the user mistypes the password and must correct it. People not used to type on a keyboard do more typing mistakes on complex passwords. A too high FTAR is annoying for the user and increases the False Rejection Rate (FRR)11. This error can come from
the complexity of the password, or if the shape of the keyboard is different from user’s own. The information is specified with a ratio of error (e.g., FTAR is of 12%.)
Clock resolution. It is well known that clock resolution of the method used to capture typing times has a big impact on performances [31, 32]. That is why this information is very important to track. It can be provided using a precision in milliseconds (e.g., clock resolution of 100 milliseconds +/- 10 milliseconds).
Captured information. Most of the time, public datasets only provide the ex-tracted features (latencies and durations) instead of the raw features (timestamp of press and release of a key). These features can be different from a dataset to another mainly because there are several types of latencies, and dataset creators do not always use the same, or do not explain which kind of latencies is used. As it is known that performances can slightly differ from one type of features to another one, it is important to explain which features are available in the dataset, or which features are used in the study. We also have to note that some keys can be ignored in the acquisition process (e.g, meta-keys like SHIFT) which gives wrong information. This information can be provided using the list of available extracted features (e.g, the following type of times are available: RP, PR12).
3.2.2. Distribution of the Population and Samples
Gender distribution. Males and females can be recognized on their way of typing using keystroke dynamics [33, 34, 25]. We can wonder if there are performance differences in user verification between males and females. This information can be specified using a ratio of males involved in the dataset (e.g., there are 26.2% of males).
Keyboard mastering. Not all individuals are used to manipulate computers and keyboards. People not accustomed in using keyboards may worsen the recogni-tion performance. This informarecogni-tion can be provided by a list of typing perfor-mance specified by the user (although it is too much subjective to be reliable) (e.g., all users are professional typists). Additionally, the number of used fin-gers, or the presence or absence of coordination between the two hands can also be interesting.
Left-handed and Right-handed. So far to our knowledge, there are few studies on this aspect [34], but right-handed or left-handed people may type differently. Typing complexity can be different for these two groups of people. This in-formation can be provided using a ratio of right-handed people involved in the dataset (e.g., there are 85.3% of right-handed people).
Age. Elderly people may type worse than younger ones because they learn com-puter late or could have hand diseases. A study in 1984 (at this moment people were not used with computers as today) shows that typing behavior is differ-ent between young and old people [35]. So, we think it may affect recognition performance. This information can be provided using either (a) a list of age of involved people, (b) a histogram, or (c) mean age.
Number of individuals involved. The number of people in the dataset is one of the most important information: the bigger the population is, the more reliable the results are. The performance can decrease when the number of individuals increases, but the confidence on the results is higher. This information can be provided with an integer (e.g., here are 135 volunteers).
Number of sessions. As KD is a behavioural modality, the way of typing greatly depends on external uncontrolled parameters as the mood of the person [36], the position of the keyboard, . . . Using only one session drastically reduces the variability of the samples, and unfairly improves the recognition rate. It is commonly accepted that it is better to use at least three sessions [37], but higher is better. Of course, performance decreases when the number of sessions increases. This information can be provided with (a) an integer (e.g., there are 8 sessions) or (b) a real (e.g., there are 5.3 sessions on average per user).
Number of samples per user. If we do not have enough samples per user, we cannot test the intra class variability. Of course, performance decreases when the number of samples per user increases. This information can be provided with (a) an integer (e.g., here are 400 samples per user) or (b) a real (e.g., there are 98.5 samples on average per user).
3.2.3. The Specificities of the Password
Complex passwords are in general difficult to remember [38] and could affect the performance of keystroke dynamics systems. Other factors, specific to the password, can also impact the performance of the recognition.
Is Password imposed by the protocol, or chosen by the user ? If the password is chosen by the user, we expect a better impregnation of it, and a more stable and quick way of typing than an imposed password. This is a different information from “one password per user or one unique password”. This information can be provided with a boolean (e.g., password is chosen by the user).
Complexity of the password. Password complexity is a good indicator of the security of the authentication as a complex password is difficult to break. How-ever, it can be difficult to remember and type. As various methods can compute the complexity of a password, we selected the same as in [18]. This information can be provided with a score (e.g., the complexity of the password is 25) or the mean and standard deviation when each user has a different password.
Entropy of the password. Entropy of the password gives interesting information on its related quantity of information [18]. This information can be provided with a score (e.g., the entropy of the password is 0.25) or the mean and standard deviation when each user has a different password.
Complexity of the way of typing the password. The complexity of the way of typing could have an impact on the recognition performance. A method has been recently published concerning this aspect [39]. It remains the sole approximation method for typing complexity until today. We propose to use this method with a slightly modification in order to take into account numbers or punctuation. This information can be provided with a score (e.g., the typing complexity of the password is 0.6) or the mean and standard deviation when each user has a different password.
3.2.4. The Performance of a Dataset
To compute performance figures, it is necessary to select a certain amount of data for enrollment and another amount for testing. As all the datasets are different, it is almost impossible to use the same number of training and validating samples across datasets. A good way to ease the comparison with few bias is to use the first session for the enrollment samples and the other sessions for the validating ones (we have chosen this procedure by keeping 50% of samples for training and 50% for testing for datasets having no sessions). We can see that comparison will be greatly biased between datasets having a huge difference in the amount of samples per session; but we had to make a choice. An even better procedure would be to split the dataset in three sub-datasets, forget the first one by considering it consists of user’s practicing while the two other parts serve for training and testing ; however it would reduce the amount of samples available for training and testing, which is quite problematic as most of the datasets are quite small. The information provided by this category is related to the difficulty of the dataset.
Respect of biometric properties. Hwang et al. present various indicators in order to improve the quality of the KD samples [40] and the recognition performance. Three measures are computed for each user. Note x, y, z respectively the samples used for the enrolment of the selected user, genuine query samples and impostors query samples; m =PNx
i xi/Nx is the mean vector of the enrolled samples of the selected user; Nx, Nyand Nzrespectively present the number of samples in x, y, z. The indicators are the following ones :
• Uniqueness. It is based on the distance of impostors samples against enrollment ones (higher is better).
U niqueness = Nz X k=1 kzk− mk Nz − Nx X k=1 kxi− mk Nx (1)
• Inconsistency. It is based on the similarity between query samples against enrolled ones and depends on concentration and dexterity of the user (lower is better). Inconsistency = Ny X j=1 kyj− mk Ny − Nx X k=1 kxi− mk Nx (2)
• Discriminability. It is based on the distance between the closest impostor sample to the mean of the genuine samples and the further genuine sample (higher is better).
Discriminality = min
k kzk− mk − maxj kyj− mk (3)
Even if these three indicators have been published in 2006 [40], to our knowl-edge, nobody but their creators have ever used them. This information can be provided with (a) a list of scores, (b) its histogram, or (c) a mean value among the users. They may also depend on time (to our knowledge, it has never been verified). So, it may be useful to also compute them session per session and compute their mean value.
Performance of a baseline classifier. The aim of KDB is to compare perfor-mance of various classifiers among various conditions. It is therefore important to give the performance of a baseline classifier using the dataset. The indicators can be the EER and the Area Under the Curve (AUC). The ROC Curve by itself is hardly interpretable by an automatic comparison tool. The EER gives a functional point often used in the literature to compare classifiers even if it is not an operational functional point of the algorithm (lower is better). The AUC is the area under the ROC curve and gives a more global performance in-formation on the classifier (higher is better). As we characterize a dataset and not a recognition method, we do not think it is necessary to use more metrics. However, it would even be better to compute a confidence interval of the EER, because it can be quite wide. Note that this performance measure depends on the chosen baseline algorithm.
Performance degradation over time. It is interesting to know if a dataset is more subject to performance degradation over time [5] by (i) computing the performance (EER) of each session using the samples of the first one for enroll-ment; a,d (ii) computing the slope of the regression line of the EER among the sessions. The larger the slope is, the larger the degradation over time.
We consider all these criteria to compare the six benchmark datasets in the literature in the following section.
4. Comparative Study of Keystroke Dynamics Datasets
This section presents a comparative study of the keystroke dynamics (KD) benchmark datasets (KDB) publicly available. Reported evaluations come from different sources: (a) the original paper presenting the dataset; and (b) various computations made by us on the dataset. To reduce tables size and legend’s size in figures, we use a symbol per dataset (Table 1).
Several datasets have not been captured with the notion of sessions, in this case we have artificially created sessions in order to use the first session of each dataset for building the biometric reference. . . Others provide different pass-words, but still common for all users, so we apply the characterization procedure for each password. Concerning PRESSURE{0,1,2}, we selected only users hav-ing provided 15 samples per password (more than 15 samples would reduce the number of users). For WEBGREYC{A,B} we selected only the users involved in at least 10 sessions and kept their first 10 ones. For GREYC-NISLAB we selected the subdataset typed with the two hands in order to reduce the number of subdatasets extracted from this source.
4.1. Acquisition Procedure
Table 2 presents the acquisition information for each dataset. Several co-variables stay unknown to us (they are symbolised with “??”). We observe the following points:
• Among the public datasets, WEBGREYCB is the sole dataset to pro-vide one password per user whereas it is the closer case to an operational scenario, where each user has its own password.
• No dataset allowed individuals to correct their typing mistakes without re-typing the password from scratch.
• Clock resolution is not often specified, whereas it is known to be impor-tant [32].
• As only one dataset provides the FTAR, it is hard to know if this high rate is normal for such a modality, or related to the acquisition scenario for this specific dataset. However, our experience with keystroke dynamics tends to prove that the FTAR is commonly high.
Table 3 presents the description of the population of each dataset. Even if some papers [17, 19] give the distribution of some information on the population, these data are not publicly present for each individual of the datasets (i.e., we know the histogram of age, but not the age of each user). So, we are not able to analyze or correlate performances depending on these facts. We observe the following points:
• Few datasets provide information about users, and when it is the case the population is not well balanced (e.g. there is not 50% of males and 50% of females). This is a problem because we do not know which kind
of population is really represented by the KDB. However, this issue is understandable and recurrent in biometric authentication studies.
• Most of the time, the number of users involved in the study is quite small (less than 50, and even less than 25). UID program [41] shows that there is an also a big difference of size of iris of fingerprint datasets used in research experiments and with the number of users involved in real life, but these experimental datasets stays bigger than the ones for keystroke dynamics.
However, due to the high error rates of keystroke dynamics, this modality could only applied on small size populations. Thus, it should be better if the number of users in a dataset would be in the same order of magnitude as the number of users of the future deployed system. This information should be specified in future works of this field.
• The quantity of data provided by the datasets is really different, with regard to the number of users or samples per users.
4.2. Datasets Characterization
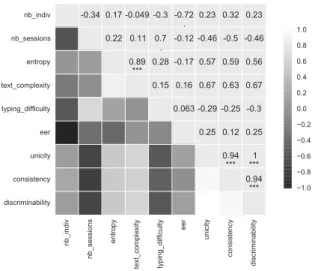
After having described the meta-data present in the datasets, it is interesting to analyze their content. Table 4 and Figure 1 present the information regarding the template ageing, while Figure 2 summarises the correlation between the various criteria. We observe the following points:
• The Pearson correlation factor between entropy and text complexity is 0.89. So, it would be better to only use the entropy which is well defined in comparison to the text complexity.
• Passwords are totally different between datasets, as well as their complex-ity and difficulty. This is a good point, which can allow testing various factors depending on these values. There is almost no correlation between the entropy or the text complexity with the typing difficulty (resp. 0.28 and 0.15). So the “strong” passwords for standard password authentica-tion are not necessarily “strong” passwords for KD.
• There is a huge impact on the number of sessions used in the dataset and the degradation of the EER. This clearly shows that keystroke dynam-ics authentication systems are subject to template ageing and this point should be systematically treated in any industrialised system.
Table 5 and Figure 1 give the information related to the performance of each dataset. The baseline classifier we use is trained using user’s gallery samples (no need of impostors’ samples). It computes a distance score as explained in [42]. The reference of user i of dataset j consists of θij = (µji, σij) with µji and σji, the mean and standard deviation of the gallery’s samples. When there are several sessions, we use the first session for training, otherwise we use half of
the samples. The distance computation method between the biometric reference θij and a query sample qjk is the following one:
b(θji, qjk) = 1 N N X i=1 exp −|µ j i− q j k| σij ! (4)
with N the size of the feature vector (it depends on the size of the password). We can observe the following points:
• EER with the baseline classifier is really different between the datasets. Its value varies from 10% to 42%, so we can observe a relative difference of 76% between the best (BA) and the worst (EB) dataset with the same authentication method. This emphasizes the importance of using various datasets in order to validate algorithms. We could also test several algo-rithms because one algorithm can be more efficient on a specific dataset which corresponds to specific constraints well managed by the algorithm.
• The decreasing of performance over time is linked to the number of sessions (the Pearson correlation coefficient between the number of session and the degradation of EER is 0.73). This emphasizes two different aspects:
– The typing changes over time are significants.
– Once again, it is mandatory to evaluate KD methods with datasets captured under several sessions.
• The Pearson correlation coefficient between the inconsistency property and the EER degradation is about 0.901 except on WEBGREYCB (the dataset with one password per user), and is about 0.55 with WEBGREYCB. This asserts the interest of this measure in order to control the performance of user recognition (remember this measure has been created in order to ask users to create stable patterns). However, it is less true when each user has its own password.
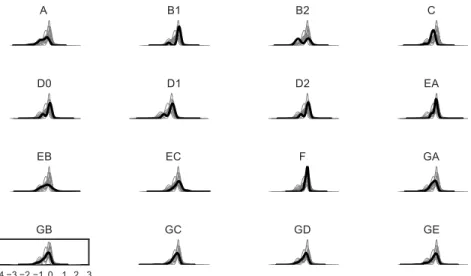
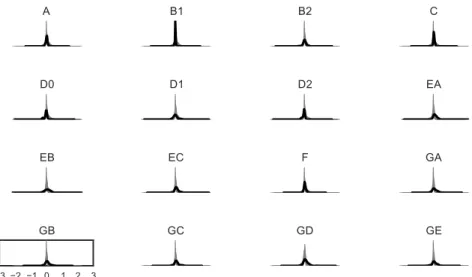
Figures 3, 4 and 5 respectively present the distribution of the uniqueness, discriminability and inconsistency values of users for each dataset. They have been computed after normalising each dataset of score using the zscore method (zscore(sjk) = s j k−µ j σj , with s j
k the sample to normalize, and µ
j and σj the mean samples and standard deviation sample estimated on the whole dataset). It would be interesting to compare the obtained values with the ones provided by the creators of these indices, but sadly, the dataset they used is not public. The confusion matrix of the p-value of a Kolmogorov-Smirnof test [43] between the different distribution of the datasets is also presented in order to analyse if the distribution of values is different between the datasets (values close to 0 mean the distributions are different). We can note a correlation for datasets EA, EB and several subdatasets of G for the uniqueness, D0, D1, D2 and several subdatasets of G for the discriminability and D0, D1, D2 and EA, EB, EC and
the subdatasets of G for the inconsistency. Thus acquisition protocol, or the involvement of the user influence these metrics.
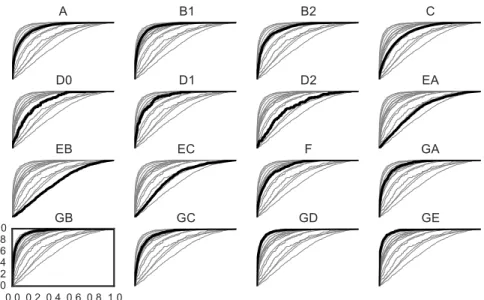
Figure 6 presents the ROC curve of each system. The biometric reference of each user is computed using some of its samples (the number is shown in Ta-ble 3). The other samples are used to make verification comparisons. Analysing the global performance on the ROC curves, we see in figure 6 that a large part of the area available for the ROC curves (from the worst at the middle line to the best at the top left corner) is used to display the complete set of ROC curves of each dataset. This figure is sufficient by itself to prove that it is mandatory to use several datasets to test new authentication methods. Otherwise researchers could develop methods which work well only on their own dataset and not on other ones.
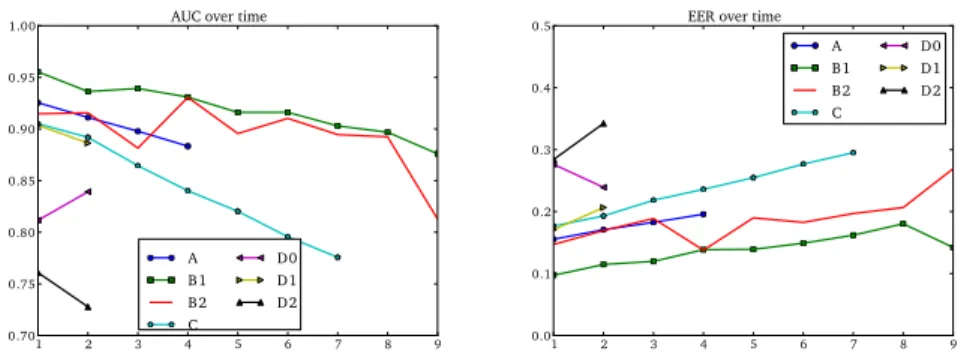
Figures 7a and 7b respectively present the AUC and EER evolution over sessions of each dataset providing several sessions. The first session is used to build the references of each user. The samples of the other sessions are used to compute the performance of their session against the biometric reference of the first session. So, three sessions are needed before being able to compute evolution over time. We make the following observations:
• The performance on all datasets, except D2 (Pressure with the password “pr7q1z”), decreases over time, even when the number of samples is quite small. It shows the necessity to take into account biometric reference ageing or instability over time. An additional analysis (probably with an-other dataset) would be necessary in order to understand why we observe a different behaviour on one dataset.
• The decreasing speed of performance is not the same for all the datasets. As a conclusion, individuals and session delays are important factors in this decrease (each dataset has been captured with sessions separated by various amount of time).
4.3. Discussion
This analysis shows that these KDB are all different and do not share lots of common properties. This lack of common properties does not ease the task of comparison and dataset selection for assessing performance of a KD recognizer. Table 2 showed that for almost all datasets we do not have at disposal the re-quired information about the acquisition process. No assumption can therefore be made between the performance of authentication by KD and the way the data is acquired. Table 3 showed, once again, that a lot of information is miss-ing about the users properties. No assumption can therefore be made between KD users and KD authentication performance. By the way, most datasets have few individuals and samples. Moreover, results showed that the performance of the baseline classifier differs a lot among the various datasets.
Table 6 presents a comparison between the tested KDB. It aims at quickly showing some properties of the datasets in order to select which ones are inter-esting to use in a new KD study. As there is no generic and objective ways of constructing such kind of table, we have built it by considering our own concerns about KDB:
• The dataset must contain as many users as possible in order to have the most accurate error rate. 50 users seems to be an acceptable minimum, even if it is still a low number.
• The number of samples per user must be greater than 20. Indeed, we need enough samples for computing the biometric reference of the user and the recognition scores without using a Leave One Out (or similar sampling method) which would not allow keeping the sample chronology.
• The number of acquisition sessions must be greater or equal to 3 [37]: one session can therefore be used for computing the model parameters and two sessions to compute the different evaluation measures. It is a nonsense to only work with samples captured on a short time span as it is known that template ageing is quite important for KD.
With our criteria, the datasets are ranked as follows: DSL2009, GREYC, WEBGREYC, KEYSTROKE100, GREYC-NISLAB, PRESSURE, BIOCHAVES. Note that other researchers with other criteria could obtain a different ranking.
Of course, these best ranked datasets are not sufficient for all the possible studies. That is why it will be necessary, for researchers who work on specific parts not presented in Table 6, to acquire new datasets. These new datasets should match all the requirements of Table 6 as well as the additional require-ments specifics to their own study. For example, a study on the impact of the shape of a keyboard on the recognition rate, should add criteria on the number of different keyboards used during the acquisition.
5. Conclusion
We have presented in this paper a review of all the public benchmark datasets in the literature for keystroke dynamics with static password. We defined a set of criteria aiming at characterizing existing and expected keystroke dynamics datasets allowing easily choosing the adequate dataset for a particular study, or helping to build high quality keystroke dynamics datasets. We have used these criteria for characterizing all the public datasets for keystroke dynamics available in the literature. We have shown that the requirements to obtain a strong password are not compatible with the requirements to obtain a good password for keystroke dynamics. As it was expected, we have this way shown that there are differences in the meta-data of these datasets, but we have also shown there are differences of performance on a baseline authentication method for keystroke dynamics. There is a relative difference of 76% in EER between
the two extreme datasets where the baseline performs the best and the worst. This result points out a huge problem as, in each keystroke dynamics paper, the keystroke authentication method is evaluated on a single dataset which is not always public. The obtained performance on this dataset can be really different from a result which would be obtained on another dataset which is more close to the targeted population. Ranking datasets of keystroke dynamics remains quite difficult because of the huge amount of differences between them (num-ber of users, samples, presence of sessions or not, delay between sessions, . . . ). We have seen that each dataset has few strong points (according to the ideal dataset) and a lot of weaknesses. Scientists are far to have at their disposal the best datasets as possible, and we suggest that they use our criteria in order to collect the dataset which fits the need of their studies. The software provided by the GREYC lab13 could help for that.
We therefore hope that the characterization criteria that we have provided in this paper will help to build future interesting datasets. This way, we can expect a better evaluation of the on-coming works on keystroke dynamics as well as an increase of their quality.
Acknowledgment
The authors would like to thank the authors of the various datasets used in this paper.
13
http://www.epaymentbiometrics.ensicaen.fr/index.php?option=com_content&view= article&id=18&catid=2&Itemid=101
A GREYC B WEBGREYC C DSL2009
D PRESSURE E BIOCHAVES F KEYSTROKE100
G GREYC-NISLAB
T able 2: There is a great disparit y in the acquisition proto col of eac h dataset, and information concerning the acquisition pro cedure remains partial (“??” sym b olizes a fact not presen ted in the original pap er, “Y” stands for “y e s” and “N” stands for “no”). Information A BA BB C D { 0-2 } EA EB EC F G { A-E } Duration 3 mon ths 17 mon ths 17 mon ths > 8 da ys ?? 1 mon th 1 w eek ?? ?? ?? Error N N N N ?? N N N N N Acquisition stable N N ?? ?? ?? ?? ?? ?? ?? ?? Acquisition con trolled Y N N Y ?? ?? ?? ?? ?? ?? Unique passw ord Y Y N Y 3 Y Y Y Y Y OS win. xp bro wsers bro wsers win ?? ?? ?? ?? ?? win xp. Keyb oard 1 no con-trol no con-trol 2 ?? 3 v arious no con trol ?? 4 Clo c k 10 milli-seconds ?? ?? 200 µseconds ?? ?? ?? ?? ?? 10 milli -seconds FT AR ≈ 20% ?? ?? ?? ?? ?? ?? ?? ?? ?? F eatures PP , PR, RP , RR PP , PR, RP , RR PP , PR, RP , RR PP , PR, RP , RR PP PP PP PP PP PP , PR, RP , RR 1 2 AZER TY (laptop + USB), 2 1 QWER TY laptop 3 Brazilian k eyb oard 4 AZER TY or QUWER TY
T able 3: The distribution of the individuals v aries also b et w een the v arious data se ts. Once again, some information are missing. 8 datasets out of 11 ha v e less than 50 users. Dataset A BA BB C D0 D { 1,2 } EA EB EC F G { A-E } Gender (% of males) 73 80 80 59 ?? ?? ?? ?? ?? ?? 70 Keyb oard mastering ?? ?? ?? ?? ?? ?? 1 2 1 ?? ?? Handness (% of righ t) ?? ?? ?? ? ? ?? ?? ?? ?? ?? ?? 89 Age 19-56 20-40 20-40 18-70 ?? ?? ?? ?? ?? ?? 15-65 # individual s 97 32 32 51 13 14 10 8 14 100 110 # sessions 5 10 10 8 3 3 2 2 ?? 1 1 # samples p er user 60 94.81 89 400 15 15 10 10 10 10 10 1 not all famili ar 2 studen ts in electrical engineering and computer science
T able 4: All but one datasets ha v e passw ords imp osed b y the proto col. The passw ords presen t s a great disparit y in term of size, complexit y and difficult y . Mean a nd standar d deviation are presen ted for BB (as there is one p assw ord p er user), “Y” stands for “y es” and “N” stands for “no”. Dataset A BA BB C D0 D1 D2 EA EB EC F GA GB GC GD GE Imp osed b y proto col Y Y N Y Y Y Y Y Y Y Y Y Y Y Y Y V alue 1 2 3 4 5 6 7 8 8 9 10 11 12 13 14 15 En trop y 3.3 3.9 3.4 (0.3) 3.3 2.5 3.0 2.6 3.7 3.7 3.3 3.0 3.4 3.4 3.3 3.5 3.6 T ext com-plexit y 120 246 184 (71.78) 187 7 102 40 324 324 132 126 156 156 132 204 216 T yping dif-ficult y 8.71 13.3 9.4 (1.8) 11.1 8.1 7.5 7.6 8.2 8.2 9.8 9.3 6.7 6.6 9.6 6.6 6.8 1 “greyc lab oratory”, 2 “lab oratoire greyc” + “s ´esame”, 3 Eac h user has chos en a differen t one, 4 “.tie5Roanl”, 5 “drizzle”, 6 “jeffrey allen” , 7 “pr7q1z”, 8 “c ho colate, zebra, banana, taxi”, 9 “computador calcula”, 10 “try4-m bs” 11 “leonardo dicaprio” 12 “the rolling stones” 13 “mic hael sc h umac her” 14 “red hot chilli p epp ers” 15 “united states of america”
T able 5: The same baseline authen ti ca ti o n metho d g iv es differen t results among the datasets. There is a relativ e difference in EER o f 76% (100 ∗ |w or st − best | w or st )b e tw ee n the b est p erforming dataset and the w orst p erforming one. All dataset, but one, h a v e a p erformance decrease amon g sessions. ∅ is used when w e cannot compute the required v alue. Dataset A BA BB C D0 D1 D2 EA EB EC F GA GB GC GD GE Uniqueness (mean) 0.17 0.00 0.26 0.22 − 0.00 0.03 − 0.01 0.60 0.48 0.44 0.25 0.35 0.36 0.32 0.40 0.42 Uniqueness (std) 0.09 0.03 0.12 0.06 0.11 0.08 0.08 0.13 0.25 0.21 0.10 0.15 0.16 0.15 0.16 0.18 Inconsistency (mean) 0.02 0.00 0.02 0.05 − 0.03 0.02 − 0.03 0.13 0.08 0.10 0.04 0.10 0.08 0.09 0.10 0.08 Inconsistency (std) 0.06 0.03 0.10 0.04 0.08 0.13 0.07 0.10 0.14 0.11 0.06 0.15 0.15 0.15 0.15 0.15 Discriminabilit y (mean) 0.17 0.00 0.26 0.22 − 0.00 0.03 − 0.01 0.60 0.48 0.44 0.25 0.35 0.36 0.32 0.40 0.42 Discriminabilit y (std) 0.09 0.03 0.12 0.06 0.11 0.08 0.08 0.13 0.25 0.21 0.10 0.15 0.16 0.15 0.16 0.18 Classifier EER 0.18 0.14 0.18 0.24 0.25 0.18 0.31 0.36 0.42 0.34 0.20 0.16 0.11 0.16 0.10 0.10 Classifier AUC 0.90 0.93 0.89 0.84 0.82 0.90 0.74 0.69 0.61 0.70 0.89 0.92 0.95 0.92 0.96 0.97 Classifier EER degra-dation 74.86 93.34 56.93 49.98 − 26.90 28.00 17.17 ∅ ∅ ∅ ∅ ∅ ∅ ∅ ∅ ∅ Classifier AUC degra-dation − 71.60 − 109.34 − 50.94 − 44.67 36.15 − 57.75 − 30.20 ∅ ∅ ∅ ∅ ∅ ∅ ∅ ∅ ∅
Table 6: Comparison and ranking of the datasets for selecting the adequate dataset. The results show that most of the dataset do not match enough requirements to be used efficiently. For each score or rank line, the best(s) dataset is (are) presented in bold.
Dataset A B C D E F G Nb users ≥ 50 Y N1 Y N N Y Y Nb of samples/user ≥ 30 Y Y Y N N N N Nb of session ≥ 3 Y Y Y Y N N N Score 3 2 3 1 0 1 1 I = Rank by score 1 3 1 4 7 4 4
II = Rank per number of valid users 3 5 4 7 6 2 1
III = Rank per number of samples/user 3 2 1 4 5 5 5
IV = Rank per number of sessions 3 1 2 4 5 5 5
V = Rank sum (II+III+IV) 8 7 6 14 15 11 11
VI = Total rank sum (I + V) 9 10 7 18 21 15 15
1At least with the subset of 10 sessions we have selected. Using less sessions would have increased the number of users.
0 2 4 6 8 10 12 Number of sessions 0.05 0.10 0.15 0.20 0.25 0.30 0.35 0.40 0.45 EER A BA BB C D0 D1 D2 EA EB EC F GA GB GC GD GE
(a) EER vs number of sessions
2 3 4 5 6 7 8 9 10 11 Number of sessions 40 20 0 20 40 60 80 100 EER degradation A BA BB C D0 D1 D2
(b) EER degradation vs number of sessions
nb_indiv nb_sessions entropy text_complexity typing_difficulty eer unicity consistency discriminability nb_indiv nb_sessions entropy text_complexity typing_difficulty eer unicity consistency discriminability -0.34 0.17 -0.049 -0.3 -0.72 . 0.23 0.32 0.23 0.22 0.11 0.7 . -0.12 -0.46 -0.5 -0.46 0.89 *** 0.28 -0.17 0.57 0.59 0.56 0.15 0.16 0.67 0.63 0.67 0.063 -0.29 -0.25 -0.3 0.25 0.12 0.25 0.94 *** ***1 0.94 *** 1.0 0.8 0.6 0.4 0.2 0.0 0.2 0.4 0.6 0.8 1.0
A B1 B2 C
D0 D1 D2 EA
EB EC F GA
−3 −2 −1 0 1 2 3
GB GC GD GE
(a) Distribution (smoothed with kernel density estimation)
A B1 B2 C D0 D1 D2 EA EB EC F GA GB GC GD GE
A
B1
B2
C
D0
D1
D2
EA
EB
EC
F
GA
GB
GC
GD
GE
0.0
0.1
0.2
0.3
0.4
0.5
0.6
0.7
0.8
0.9
1.0
(b) KS p-valueA B1 B2 C
D0 D1 D2 EA
EB EC F GA
−4 −3 −2 −1 0 1 2 3
GB GC GD GE
(a) Distribution (smoothed with kernel density estimation)
A B1 B2 C D0 D1 D2 EA EB EC F GA GB GC GD GE
A
B1
B2
C
D0
D1
D2
EA
EB
EC
F
GA
GB
GC
GD
GE
0.0
0.1
0.2
0.3
0.4
0.5
0.6
0.7
0.8
0.9
1.0
(b) KS p-valueFigure 4: The “discriminability” distribution between the various datasets most often differs. The discriminability distribution of the sub-datasets of the PRESSURE dataset are similar.
A B1 B2 C
D0 D1 D2 EA
EB EC F GA
−3 −2 −1 0 1 2 3
GB GC GD GE
(a) Distribution (smoothed with kernel density estimation)
A B1 B2 C D0 D1 D2 EA EB EC F GA GB GC GD GE
A
B1
B2
C
D0
D1
D2
EA
EB
EC
F
GA
GB
GC
GD
GE
0.0
0.1
0.2
0.3
0.4
0.5
0.6
0.7
0.8
0.9
1.0
(b) KS p-valueFigure 5: The “inconsistency” distribution between some sub-datasets sharing the same users is similar. This property may be user dependant.
A B1 B2 C D0 D1 D2 EA EB EC F GA 0.0 0.2 0.4 0.6 0.8 1.0 0.0 0.2 0.4 0.6 0.81.0 GB GC GD GE
Figure 6: ROC curves for the same baseline keystroke dynamics authentication method on the different datasets. Its performance on one dataset is even close to random.
1 2 3 4 5 6 7 8 9 0.70 0.75 0.80 0.85 0.90 0.95
1.00 AUC over time
A B1 B2 C D0 D1 D2
(a) AUC evolution over sessions (higher is bet-ter). 1 2 3 4 5 6 7 8 9 0.0 0.1 0.2 0.3 0.4
0.5 EER over time
A B1 B2 C D0 D1 D2
(b) EER evolution over sessions (lower is bet-ter).
Figure 7: Performances are likely to decrease with time (i.e. AUC decreases while EER increases). The more recent the samples are, the less similar to the biometric reference they are.
[1] R. Giot, M. El-Abed, C. Rosenberger, Keystroke dynamics overview, in: D. J. Yang (Ed.), Biometrics / Book 1, Vol. 1, InTech, 2011, Ch. 8, pp. 157–182.
URL http://www.intechopen.com/articles/show/title/
keystroke-dynamics-overview
[2] N. Poh, S. Bengio, Database, protocols and tools for evaluating score-level fusion algorithms in biometric authentication, Pattern Recognition 39 (2) (2006) 223– 233.
[3] A. J. Mansfield, J. L. Wayman, Best practices in testing and reporting perfor-mance of biometric devices, Centre for Mathematics and Scientific Computing, National Physical Laboratory Teddington, Middlesex, UK, 2002.
[4] A. K. Jain, D. Petrovska-Delacr´etaz, G. Chollet, B. Dorizzi, Guide to biometric
reference systems and performance evaluation, Springer, 2009.
[5] R. Giot, B. Dorizzi, C. Rosenberger, Analysis of template update strategies for keystroke dynamics, in: IEEE Symposium Series in Computational Intelli-gence 2011 (SSCI 2011). Workshop on Computational IntelliIntelli-gence in Biomet-rics and Identity Management (CIBIM). Special Session on Adaptive Classi-fication Systems for Biometric Recognition., Paris, France, 2011, pp. 21–28. doi:10.1109/CIBIM.2011.5949216.
URL http://hal.archives-ouvertes.fr/hal-00587106/
[6] P. Kang, S.-s. Hwang, S. Cho, Continual retraining of keystroke dynamics based authenticator, in: S.-W. Lee, S. Li (Eds.), Proceedings of ICB 2007, Vol. 4642 of Lecture Notes in Computer Science, 2007, pp. 1203–1211.
[7] R. Gaines, W. Lisowski, S. Press, N. Shapiro, Authentication by keystroke timing: some preliminary results, Tech. Rep. R-2567-NSF, Rand Corporation (May 1980). [8] R. Spillane, Keyboard apparatus for personal identification, IBM Technical
Dis-closure Bulletin (Apr. 1975).
[9] D. Umphress, G. Williams, Identity verification through keyboard characteristics, Internat. J. ManMachine Studies 23 (1985) 263–273.
[10] F. Monrose, A. Rubin, Keystroke dynamics as a biometric for authentication, Future Generation Computer Syststems 16 (4) (2000) 351–359.
[11] K. Revett, F. Gorunescu, M. Gorunescu, M. Ene, S. d. M. Tenreiro, H. M. D. Santos, A machine learning approach to keystroke dynamics based user authenti-cation, International Journal of Electronic Security and Digital Forensics 1 (2007) 55–70.
[12] H. Lee, S. Cho, Retraining a keystroke dynamics-based authenticator with im-postor patterns, Computers & Security 26 (4) (2007) 300–310.
[13] R. Giot, M. El-Abed, B. Hemery, C. Rosenberger, Unconstrained keystroke dy-namics authentication with shared secret, Computers & Security 30 (6-7) (2011) 427–445. doi:10.1016/j.cose.2011.03.004.
[14] K. S. Killourhy, R. A. Maxion, Should security researchers experiment more and draw more inferences?, in: 4th Workshop on Cyber Security Experimentation and Test (CSET’11), 2011, pp. 1–8.
[15] M. Schuckers, Computational Methods in Biometric Authentication, Springer, 2010.
[16] P. S. Teh, A. B. J. Teoh, S. Yue, A survey of keystroke dynamics biometrics, The Scientific World Journal 2013.
[17] R. Giot, M. El-Abed, C. Rosenberger, Greyc keystroke: a benchmark for
keystroke dynamics biometric systems, in: IEEE International Conference on Biometrics: Theory, Applications and Systems (BTAS 2009), 2009, pp. 1–6. [18] R. Giot, M. El-Abed, C. Rosenberger, Web-Based Benchmark for Keystroke
Dy-namics Biometric Systems: A Statistical Analysis, in: The Eighth International Conference on Intelligent Information Hiding and Multimedia Signal Processing (IIHMSP 2012), 2012.
[19] K. Killourhy, R. Maxion, Comparing anomaly-detection algorithms for keystroke dynamics, in: IEEE/IFIP International Conference on Dependable Systems & Networks, 2009. DSN’09, 2009, pp. 125–134.
[20] J. D. Allen, An analysis of pressure-based keystroke dynamics algorithms, Mas-ter’s thesis, Southern Methodist University, Dallas, TX (May 2010).
[21] J. R. M. Filho, E. O. Freire, On the equalization of keystroke timing histograms, Pattern Recognition Letters 27 (2006) 1440–1446.
[22] J. Montalvao, C. Almeida, E. Freire, Equalization of keystroke timing histograms for improved identification performance, in: Telecommunications Symposium, 2006 International, IEEE, 2006, pp. 560–565.
[23] J. Montalvao Filho, E. Freire, Multimodal biometric fusion–joint typist
(keystroke) and speaker verification, in: Telecommunications Symposium, 2006 International, 2006, pp. 609–614.
[24] C. C. Loy, W. K. Lai, C. P. Lim, Keystroke patterns classification using the artmap-fd neural network, in: International Conference on Intelligent Information Hiding and Multimedia Signal Processing, pp. 61-64, Taiwan, 2007 (IIHMSP 2007), 2007, pp. 61–64.
[25] S. Syed Idrus, E. Cherrier, C. Rosenberger, P. Bours, Soft biometrics database: A benchmark for keystroke dynamics biometric systems, in: Biometrics Special Interest Group (BIOSIG), 2013 International Conference of the, 2013, pp. 1–8. [26] S. Mau, F. Dadgostar, I. Cullinan, A. Bigdeli, B. Lovell, A face biometric
bench-marking review and characterisation, in: BeFIT 2011 First IEEE International Workshop on Benchmarking Facial Image Analysis Technologies (In conjunction with the ICCV 2011), 2011.
[27] S. Li, C. Jin, H. Kim, S. Elliott, Assessing the difficulty level of fingerprint datasets based on relative quality measures, in: Hand-Based Biometrics (ICHB), 2011 International Conference on, 2011, pp. 47–51.
[28] G. Veres, M. Nixon, J. Carter, Is enough enough? what is sufficiency in biometric data?, in: Image Analysis and Recognition, Springer, 2006, pp. 262–273. [29] S. Sarkar, P. Phillips, Z. Liu, I. Vega, P. Grother, K. Bowyer, The humanid gait
challenge problem: Data sets, performance, and analysis, Pattern Analysis and Machine Intelligence, IEEE Transactions on 27 (2) (2005) 162–177.
[30] P. Bours, V. Komanpally, Performance of keystroke dynamics when allowing typ-ing corrections, in: Biometrics and Forensics (IWBF), 2014 International Work-shop on, IEEE, 2014, pp. 1–6.
[31] P. Narainsamy, S. Sunjiv, N. Shrikaant, Investigating & improving the reliability and repeatability of keystroke dynamics timers, International Journal of Network Security & Its Applications (IJNSA), 2 (3) (2010) 70–85.
[32] K. Killourhy, R. Maxion, The effect of clock resolution on keystroke dynamics, in: Proceedings of the 11th international symposium on Recent Advances in Intrusion Detection, Springer, 2008, pp. 331–350.
[33] R. Giot, C. Rosenberger, A new soft biometric approach for keystroke dynamics based on gender recognition, International Journal of Information Technology and Management (IJITM). Special Issue on : ”Advances and Trends in Biometrics by Dr Lidong Wang 11 (1/2) (2012) 35–49.
[34] S. Z. S. Idrus, E. Cherrier, C. Rosenberger, P. Bours, Soft biometrics for keystroke dynamics, in: Image Analysis and Recognition, Springer, 2013, pp. 11–18. [35] T. Salthouse, Effects of age and skill in typing., Journal of Experimental
Psychol-ogy: General 113 (3) (1984) 345.
[36] C. Epp, Identifying emotional states through keystroke dynamics, Master’s thesis, University of Saskatchewan, Saskatoon, CANADA (2010).
[37] F. Cherifi, B. Hemery, R. Giot, M. Pasquet, C. Rosenberger, Behavioral Bio-metrics for Human Identification: Intelligent Applications, IGI Global, 2009, Ch. Performance Evaluation Of Behavioral Biometric Systems, pp. 57–74.
[38] J. Yan, A. Blackwell, R. Anderson, A. Grant, The memorability and security of passwords-some empirical results, Technical Report-University Of Cambridge Computer Laboratory.
[39] S. Mondal, P. Bours, S. Z. Syed Idrus, Complexity measurement of a password for keystroke dynamics: Preliminary study, in: 6th International Conference on Security of Information and Networks (SIN) 2013, 2013.
[40] S. Cho, S. Hwang, Artificial rhythms and cues for keystroke dynamics based authentication, in: Proceedings of the International Conference on Biometrics (ICB), 2006, pp. 626–632.
[41] A. Gelb, J. Clark, Performance lessons from indias universal identification pro-gram (2013).
[42] S. Hocquet, J.-Y. Ramel, H. Cardot, User classification for keystroke dynamics authentication, in: The Sixth International Conference on Biometrics (ICB2007), 2007, pp. 531–539.
[43] F. Massey Jr, The kolmogorov-smirnov test for goodness of fit, Journal of the American statistical Association (1951) 68–78.