HAL Id: hal-00077588
https://hal.archives-ouvertes.fr/hal-00077588
Submitted on 31 May 2006
HAL is a multi-disciplinary open access
archive for the deposit and dissemination of
sci-entific research documents, whether they are
pub-lished or not. The documents may come from
teaching and research institutions in France or
abroad, or from public or private research centers.
L’archive ouverte pluridisciplinaire HAL, est
destinée au dépôt et à la diffusion de documents
scientifiques de niveau recherche, publiés ou non,
émanant des établissements d’enseignement et de
recherche français ou étrangers, des laboratoires
publics ou privés.
To cite this version:
Johann Laurent, Nathalie Julien, Eric Martin. High Level Power Analysis for Embedded DSP
Soft-ware. 2000, pp 100. �hal-00077588�
High Level Power Analysis for Embedded DSP Software
Johann LAURENT Nathalie JULIEN
Eric MARTIN
LESTER South Brittany University E-mail: [email protected]
Centre de recherche rue Saint Maudé 56325 LORIENT cedex France
Abstract
We introduce here a high level power estimation method; the power consumption of a whole algorithm is evaluated at a behavioral level instead of the classical study conducted at the instruction level. We present non exhaustive results on the energy models elaborated for a Texas Instruments DSP. This original energy estimation method has been applied to a classical algorithm (FIR) and validated by measurements; promising results provide an error of less than 8% .
1.
Introduction
In embedded applications, power dissipation is currently a major parameter. Power consumption optimization allows to reduce both the weight and the size of a circuit through minimizing the batteries (or increasing their duration) as well as moderating the importance of cooling systems. These reductions are essential for all portable applications (GSM) or spatial tele-communications.
To control the power consumption, it is well-known that algorithm transformations are more efficient than technologic optimizations [1]; furthermore, such modifications are less expensive and allow to restrict the time-to-market. So it is very important to evaluate the application consumption at the early stage of the system design.
Especially for the new information and communication technologies, like real time image coding, the processing needs are always higher and therefore require more computation capacities. In such complex applications, the new generation of Digital Signal Processors (DSP) are usually used. They are characterized by elaborated architectures: a deep pipeline, VLIW instructions, memory caches and possibly superscalar architectures.
Differing of all other recent works on power consumption optimization for DSP which operate at the instruction level [2], we have chosen to conduct the study at a behavioral level. Such a methodology can also take into account the other architectural components (i.e. memories) and may include optimizations through compiler directives and high level code transformations.
Until now, the estimation of an algorithm consumption was conducted using an instruction level model [3]. In the first place, measures of all the instruction set and all interactions between these instructions had to be realized. This step is very expensive in time and must be started again even when the DSP architecture is slightly modified. Moreover, with new DSP generations, the instruction set increases significantly and the parallelism possibilities have to be taken into account. For the memory aspect, it’s well-known that the power consumption part due to the external memory access is a more and more important problem in latest applications [1-4]. Even if there are some works on memory optimization, they are poorly related to an estimation method able to predict the power consumption of a whole algorithm.
Section 2 will present the framework of the methodology leading to the general functional analysis we proposed and then its implementation to a specific DSP. Afterwards, section 3 develops some examples of the power characterization for functional block such as memory and fetch stages. From adequate measurements, experimental energy variations are computed for each part of the architecture. Finally, a whole signal processing application is provided as example of the method, and the estimates are validated by the measures.
2.
Methodology and functional analysis
A.
Framework of the methodology
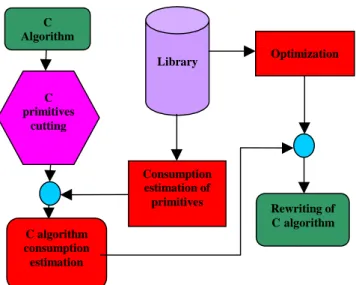
The purpose is to develop power optimization strategies on DSP programming for an algorithm in C language. The complete methodology proposed is presented in Figure 1.
First the C algorithm is divided in different C primitives (i.e. if, do, while...). We then use a toolbox called Consumption estimation to estimate the power consumption of all the different primitives and, by combining these estimates, to evaluate the power consumption of the entire algorithm. The next toolbox Optimization is used for rewriting the C algorithm.
Figure 1: Methodology of power estimation and optimization
Both the toolboxes Consumption estimation and Optimization require the construction of a complete library, enclosing accurate power estimates validated by precise measurements.
B.
General functional analysis
For realizing first this library, we use a functional analysis, based on a power consumption study of the architecture and the pipeline of recent DSP. The processor can have an elaborated architecture since it can integrate a deep pipeline, VLIW instructions, internal memories that can be used in cache mode and parallelism possibilities for the instructions.
We start to cluster the architectural components according to their impact on energy dissipation and their interactions. The general representation presented in Figure 2 can be modified for a particular DSP, by adding some clusters and removing some others.
In a second time, we determine the interactions between the different clusters and qualify them in terms of power consumption. Generally, there are interactions between the CU (Control Unit) and all other clusters because it integrates all the control registers. In addition, there are interactions between the MMU (Memory Management Unit) and the PU (Processing Unit) through the loading of data from an external memory via the DMA (Direct Memory Access). We also find relations between the IMU (Instructions Management Unit) and the PU because after the instruction loading in the IMU, these are then executed in the PU. Finally, there is a last interaction between the MMU and the IMU which is generated by the link between the DMA and fetch stages. Generally, interactions between the CU and the others clusters are
looked upon as negligible for our domain of interest (image and audio processing applications).
MMU: Management Memory Unit CU: Control Unit
IMU: Instructions Management Unit PU: Processing Unit
Figure 2: Functional analysis example
C.
Specific functional analysis
We develop in this paragraph an example of the functional analysis applied to the TMS320C6201, one of the last generation of TEXAS INSTRUMENTS DSP. This processor uses a complex architecture since it has a deep pipeline (11 stages), VLIW instructions, parallelism possibilities (up to 8 parallel instructions) and its internal program memory can be used as cache memory.
In Figure 3, we present the application of our functional analysis methodology for this particular type of DSP. For more clearness, only interactions between clusters are reported; inter-clusters interactions, although studied, are not represented here.
An important interaction for all the clusters has come out that is the Clock Tree which in effect acts upon the power consumption especially at the nominal frequency (F = 160 MHz) of this circuit.
It could be noticed that the DECODE stage of the pipeline is now separated into two steps: the dispatching part (DP) of the instructions is included in the IMU and only the instruction decoding (DC) is remaining in the PU.
This type of DSP contains a specific block which is the External Memory InterFace (EMIF), used for all the external access of both the program memory (in the IMU) and the data memory (in the PU). So we have chosen to make it occur in each involved part.
C Algorithm C primitives cutting C algorithm consumption estimation Consumption estimation of primitives Library Optimization Rewriting of Calgorithm DMA MMU CTRL registers Peripheral bus PLL Interruptions CU FETCH stages CTRL/MEM PRG IMU REGISTERS UAL / MPY DECODE stages CTRL/MEM DATA PU
Figure 3: Interactions for the TMS320C6201
In addition, the DSP contains two different register files and multiplexers allow to cross over the datapath. It also appears as a new cluster.
Afterwards, the qualification of different interactions is characterized by the consumption laws presented below. These laws allow us to estimate the power consumption for each part of a program and subsequently, for a whole algorithm.
3.
Power characterization of functional
blocks
To validate the estimates of energy dissipation for the primitives and work up the library, we have first to realize measurements for each functional block or cluster of blocks. Indeed, these measures will permit to elaborate consumption laws who will be used for generating our energy models.
Two kinds of measures are done, one for measuring the average current dissipated by the DSP core Icore and another for measuring the execution time of the program Texe. Knowing these two parameters and the core supply voltage Vdd (2.5 V) allow us to determine the average energy E thanks to the following expression (1):
E = Icore * Texe * Vdd (1)
To qualify the different interactions and the clusters, we have defined scenarii; they are program sets that stimulate just one cluster or one block, in order to measure the absolute or relative part of this element in the total power dissipation. So far, these programs have been written in assembler but in further works, all the study will be conducted for C language algorithms. These scenarii are composed of an unbounded loop that allows to perform the measures and E is calculated for one iteration. The effect
of the loop to the dissipation is ensured negligible relative to all the rest of the scenario. Based on these measures, we determine the evolution of the consumption for a functional block or cluster.
We will present in this section some typical examples of the achieved work on the TMS320C6201, especially on the memory and on the fetch stages.
A.
Memory modes
First, we will expose the results for the 4 different modes of the internal program memory. The first one is the MAPPED mode where all the program is in the internal memory. For the CACHE mode, external accesses are done when instructions are not in the cache memory (case of a cache miss). The FREEZE mode is similar to the CACHE mode except that the cache is only read and never written. At least, in the BYPASS mode, all instructions are read in external memory.
Figure 4 summarizes the variations with the frequency of both the average current of DSP core and the energy for one iteration of the program. As the operating scenario generates no cache miss, the results for the FREEZE mode are here identical to those for the CACHE mode.
First, we can confirm that the current is not a sufficient criteria. Actually, the BYPASS mode absorbs less current than the CACHE mode (about –16%) but it consumes more energy (about +250%). In fact, it is the energy optimization for a given task that allows to increase portable circuit autonomy. Moreover, for each memory mode, the energy is stable with the frequency. The most efficient mode is, of course, the MAPPED one. All the others can be characterized relatively to it with about +35% of energy cost for the cache management and around +400% for the BYPASS mode.
MEMORY MODE CURRENT (mA) ENERGY (µjoule) F = 40MHz MAPPED 281 70 CACHE 448 112 BYPASS 369 369 F = 133MHz MAPPED 886 66 CACHE 1399 105 BYPASS 1224 367 F = 160MHz MAPPED 1040 65 CACHE 1560 98 BYPASS 1464 366
Figure 4: Characteristics of memory modes
DMA MMU FETCH / DP CTRL/MEM PRG EMIF IMU REGISTERS MULTIPLEXORS DC/UAL/MPY CTRL/MEM DATA EMIF PU Ex te rn al /i nte rn al m em o ry acce ss Decoding Clock tree
B.
Memory cache
As explained before, the increasing complexity of the embedded applications needs more and more memory space. But the internal memory size is limited so, to execute these applications, we may often use external memory. In order to know how the energy evolves when the cache miss varies, measures have been done for a same scenario. The parallelism rate α must be taken into account; when α = 1, the parallelism is maximum and 8 instructions are executed in parallel and when α = 1/8, all the instructions are executed sequentially.
In Figure 5, the measured average energy for the same scenario is represented as a function of the cache miss in percentage and α for F = 160 MHz.
Figure 5: Cache miss energy
We can see that there is an over-consumption of more than 2000% between a program which generates 0% of cache miss and a program which generates 100% of cache miss. Moreover, the energy variations with the parallelism rate are less predominant; at 0% of cache miss rate, the energy dissipated for α= 1 is 300% lower than for α = 1/8. This gap shrinks when the cache miss rate increases (about –15% at 100% of cache miss rate). In conclusion, it is crucial to first avoid the cache miss before using the parallelism possibilities.
C.
FETCH stages
The last example presented concerns the FETCH stages. In our case, this consumption can not be over-looked as the processor uses VLIW instructions and therefore loads several instructions in the same time (8 instructions for the TMS320C6201).
To realize these measures, we program a scenario in the MAPPED mode that excites only the FETCH stages in the DSP architecture. Indeed, this excitation changes with
the parallelism rate because, when α = 1 the excitation is maximum and 8 instructions are loaded at each cycle time. When α = 1/8, the excitation is minimum and so 8 instructions are loaded all the 8 cycle times.
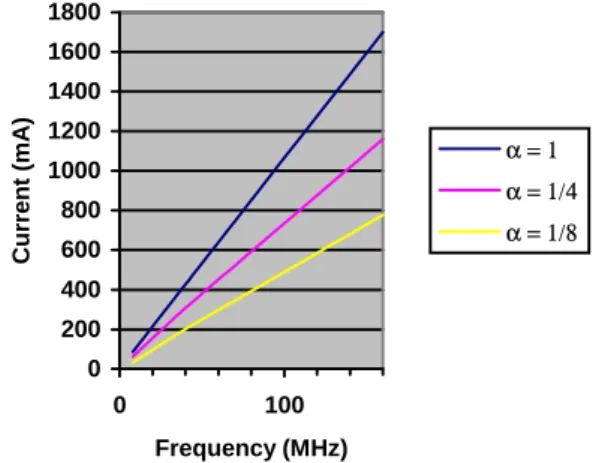
Figure 6 presents the results of these measures. It confirms that the current is linear with the frequency and that it increases when the parallelism rate increases. It has to be noticed that this current ICLK+FETCH+PRG represents the current used by the FETCH stages IFETCH, the current used by the clock tree ICLK and also the current used by the program memory IPRG.
Figure 6: Current used by the FETCH stages
From these measures, we infer an experimental consumption law given by the expression (2):
ICLK+FETCH+PRG = (aα + b) F + cα + d (2)
ICLK+FETCH+PRG: average current (in mA) F: frequency (in MHz)
a = 5.21 mA/MHz; b = 4.19 mA/MHz c = 42.4 mA; d = 7.6 mA
Such a procedure has been used for the other blocks of the architecture in order to deduce the energy evolution laws of the entire DSP.
4.
Algorithm estimation
In this section, we present the original method used to estimate a whole algorithm (for the moment at the assembler level) and its application for a typical signal processing algorithm, the FIR. These results, compared to the measurements, allow to validate our method.
0 200 400 600 800 1000 1200 1400 1600 1800 0% 50% 100%
CACHE MISS RATE
ENERGY by iteration (µjoule) α = 1 α = 1/4 α = 1/8 0 200 400 600 800 1000 1200 1400 1600 1800 0 100 Frequency (MHz) Current (mA) α = 1 α = 1/4 α = 1/8
A.
Estimation method
The estimation method is based on the specific functional analysis presented above and uses the energy laws obtained through the experiments. Figure 7 synthesizes the different parameters to take into account for each functional block of our architecture.
Figure 7: Estimation functional parameters
For the IMU, we have to consider which memory mode is operating. If the CACHE mode is used, we add the cache management cost and we analyze the cache miss rate; we also can add the cache miss cost. In this cluster, we study also the parallelism rate α that determines the FETCH stages cost. It could be reminded that the cost of both the clock tree and the program memory are also included in the FETCH stages cost.
For the PU, the processing unit cost is determined from the average number of used processing units per cycle time. We also study where the data are stored if either DMA or external access are needed.
The global cost of the application can now be evaluated by addition of all the different costs we have determined.
B.
Estimation example
The considered application is a FIR filter that uses 16 coefficients and for which all the samples and coefficients are in internal data memory. Energy results are presented in Figure 8 for two cases: both samples and coefficients are simple (Simple case) and then complex (Complex case).
FIR 16 IMU PU Global Estimates Measures Error (%) Simple 130.4 21.4 151.8 162 6.2 Complex 130.4 21.4 151.8 164.4 7.7
Figure 8: FIR16 energy estimations and measures (in µJoule per iteration)
The first remark is that the estimates are independent of the considered case; in fact, as our method is operating at high level of abstraction, the data variations are not taken into account and it is obvious in this example that it is not the predominant source of power dissipation in complex architecture: only 1.5% of the whole consumption is here due to the data variations.
The estimation error is less than 8% in the worst case but it could be noticed that the energy estimation is always lower than the measured value. Actually, this is due to the estimation of the PU: when many loads are made in the program, it generates more cycle time to operate them and then the average number of processing units per cycle time becomes improper. It would be efficient to divide this functional block into two parts, one for the load aspect and the other only for the processing. Future works will precise the functional estimation laws in order to eliminate this problem.
As few works actually exist on power estimation, we have not found any possible comparison on this example with another estimation method. One of the next works will be to validate our method with a more complex application and, if possible, to compare the results with those of an instruction level model.
5.
Conclusion
We have introduced a high level power estimation method providing the energy estimates of an entire algorithm through a behavioral analysis of the DSP architecture instead of the usual approach conducted at the instruction level. This method has been implemented on one of the last generation of Texas Instruments DSP (TMS320C6201), built around a complex architecture. The results obtained for a FIR algorithm, at the assembler level, are validated by measurements with an error of less than 8%. In future works, after having improved this promising method for other applications, the final purpose of the project will be to extend it to the estimation of C language algorithms.
DMA
MMU
UAL/MPY/DC/ REGISTER
- Processing unit cost (unit number/cycle time)
DATA MEMORY
- External access cost
- Internal access cost
MEMORY MODE
- Cache management cost
- External access cost
- Internal access cost
CACHE MISS RATE PARALLELISM RATE
- FETCH stages cost
IMU
References
[1] J.M. Rabaey, M. Pedram "Low power design methodologies" Kluwer Academic Publishers 1996.
[2] Vivek Tiwari, Sharad Malik, Andrew Wolfe "Power analysis
of embedded software: a first step towards software power minimisation." IEEE Transactions on VLSI Systems, December
1994.
[3] Mike Tien-Chien-Lee, Vivek Tiwari, Sharad Malik and Masahiro Fujita "Power Analysis and Minimisation Techniques
for Embedded DSP Software." IEEE Transactions on VLSI
Systems Vol5 N°1 March 1997.
[4] P. Vanoostende et al. "Issues in low power design for telecom" IEEE 1995 pp 591-593.
[5] Berkeley Design Technology, inc.
www.bdti.com/articles/lowpower.htm 1994.
[6] M.C Rinard "Compiling for low power consumption"