Paper ID: 12
THE USE OF PREDICTIVE MODELS IN THE CONTEXT OF FOOD SPOILAGE: THE CASE OF WHITE PUDDING.
Emilie Cauchie 1 *, Nicolas Korsak 1, Mariem Ellouze 2 *, Laurent Delhalle 1, Bernard Taminiau 1, Fall Papa Abdoulaye 3 and Georges Daube 1
1 University of Liège, Fundamental and Applied Research for Animal & Health (FARAH), Faculty of
Veterinary Medicine, Food Science Department, Quartier Vallée, Avenue de Cureghem 10, B-4000 Liège, Belgium.
2 Nestlé Research Center, Food Safety Microbiology, route du Jorat 57, 1000 Lausanne, Switzerland. 3 Quality Partner, rue Hayeneux 63, 4040 Herstal, Belgium.
* Corresponding authors: [email protected] and [email protected]
ABSTRACT
Food spoilage is a major issue for the food industry and consumers as products become unacceptable for human consumption leading to significant food waste and economic losses. This study combines the use of predictive microbiology and metagenetics in order to predict bacterial evolution in Belgian white pudding. The ecology of the product was studied at several times during the storage at constant temperatures, and under three different packaging (food wrap, modified atmosphere 30% CO2 – 70% N2 and vacuum packaging), by association of classical microbiological plate counting and 16S rRNA metagenetic analysis on each sample. The bacterial evolution could thus be deduced for the two major spoilage populations in the product, Brochothrix thermosphacta and Pseudomonas spp. The growth parameters were estimated using the nlsMicrobio package from R and then used to simulate the microbial behavior in dynamic conditions with three different softwares: ComBase, Sym’Previus and baranyi growth function in R. These results are compared with validation curves, obtained from these durability studies. A relatively good agreement was obtained between the validation data set and the simulations, showing that the approach combining the metagenetics and the simulations based on an accurate database is promising. Performance factors (bias and accuracy factors) indicated no significant structural deviation of the maximal growth rates simulations between observed and predicted values with R and Sym’Previus. An overestimation was mainly observed with R, while an underestimation was generally observed with Sym’Previus and ComBase. None of predictive simulations give an identical microbial curve that the validation data set, but all models show relatively good statistical fittings. This work gives a proof of concept on the feasibility to combine predictive models and metagenetics in order to predict bacterial evolution using different predictive tools. In the future, predictive models needed to be more accurate by taking into account as many growth parameters as possible.
KEYWORDS
Metagenetics, predictive microbiology, white pudding, Pseudomonas spp., Brochothrix thermosphacta.
1 INTRODUCTION
Around a third of all food produced for human consumption on Earth is lost or wasted. In Europe, the losses of meat primary production represent 20%; and more than half of this occurs at the animal production, slaughtering, processing and distribution steps (Food and Agriculture Organization, 2011). Thus, food spoilage is a major issue for consumers and the food industry as products become unacceptable for human consumption, leading to significant food waste and economic losses. The reasons for food loss and waste are the contamination of the food matrix with spoilage bacteria. These
Paper ID: 12
features underline the importance of managing the microbiological quality of food products and raw materials. Fresh products provide a favorable environment for the survival and growth during storage of certain undesirable microorganisms (Garnier et al., 2017).
Classical microbiology is not sufficient for a clear and complete understanding of the mechanisms that lead to the spoilage of food products. High throughput sequencing methods have allowed a more detailed and deeper description of bacterial species present in food and have revealed new bacterial species responsible for food spoilage. These techniques made it possible the identification and quantification of culturable and non-culturable organisms (Chaillou et al., 2014, Parente et al., 2016, Riquelme et al., 2015). Among the culture-independent techniques, 16S rRNA metagenetics has emerged as a powerful tool for studying the bacterial composition of various ecosystems (Elizaquivel et al., 2015, Parente et al., 2016). However, few studies have described the evolution of a whole microbiota in a food matrix by taking into account the storage parameters (Ercolini et al., 2011; Nieminen et al., 2012).
Predictive microbiology is a research discipline of food microbiology that applies mathematical models to describe the growth and survival of microorganisms undergoing complex physical, chemical and biological changes during processing, transportation, distribution and storage of food (Huang, 2014; Pla et al., 2015). Predictive microbiology can be used in combination with 16S rRNA metagenetics to improve food quality and reduce food losses. At present, various models are available to predict the effects of temperature, pH, aw, organic acids, modified atmosphere and other factors on microbial behavior (Li et al., 2017; Martinez-Rios et al., 2016). Unfortunately, few models describe the responses of spoilage bacteria owing to the fact that the majority of models have been developed for foodborne pathogens (Alfaro et al., 2013; Membré and Lambert, 2008).
The objective of this work is to combine metagenetics results with predictive microbiological models on perishable foods under different environmental conditions through the case study of a typical Belgian pork meat product. We aim to (i) provide a proof of concept that combining plate count techniques and metagenetics analysis, with predictive modelling, can be a valuable tool to better explore the evolution of microorganisms present in perishable food within different environmental conditions, (ii) and to use these results to predict the dynamics of the evolution of the dominant microbial community in food products, as spoilage bacteria, and compare these results with some of the available models and software applications such as ComBase, Sym’Previus and growth packages from the open source R software.
2 MATERIAL AND METHODS 2.1 White pudding sample preparation
Fresh white pudding (WP) packed under air with a food wrap film was obtained from a local Belgian manufacturer. The water activity of this product was 0.98 ± 0.02 and the pH value was 6.00 ± 0.20. WP samples were put (300 g) in three different packaging, in triplicate: in a tray under modified atmosphere (MAP, CO2 30% / N2 70%) using packaging wrap; in a tray under food wrap packing (FW) (cling film); and in vacuum packaging (VP) using bags.
2.2 Durability studies
Durability studies were performed according to the standard for implementing microbiological durability tests of chilled perishable and highly perishable foodstuffs (AFNOR, NF V01-003, 2010). WP samples in FW packaging were stored during 12 days of shelf life and during 28 days under MAP and VP packaging, at constant temperature of 4°C, 8 °C or 12°C in temperature-controlled incubators. At each day of the trials, total psychrotrophic viable counts and 16S rRNA metagenetics analysis were carried out on all the samples.
Paper ID: 12
Each day during the storage period, 25 g of product were put into a Stomacher bag with a mesh screen liner under aseptic conditions. Physiological water (225 mL) was automatically added to each bag and the samples were homogenized for 2 min in a Stomacher. From this primary suspension, decimal dilutions in peptone water (1.0 g/L peptone, 8.5 g/L sodium chloride) were prepared for microbiological analysis, and 0.1 mL aliquots of the appropriate dilutions were plated onto media for each analysis in triplicate. Total viable counts (TVC) for the psychrotrophic flora were performed on plate count agar (PCA) after incubation for 48 h at 22°C.
2.2.2 Total DNA extraction
Bacterial DNA was extracted from each primary suspension, previously stored at – 80°C, using the DNeasy Blood & Tissue DNA Extraction kit. The resulting DNA extracts were eluted in DNAse/RNAse free water and their concentration and purity were evaluated by means of optical density using the NanoDrop ND-1000 spectrophotometer. The quality and quantity of the products were confirmed by Picogreen double-stranded DNA (dsDNA) quantitation assay. DNA samples were stored at – 20°C until used for 16S rRNA amplicon pyrosequencing.
2.2.3 Bacterial 16S rRNA gene amplification and barcoded pyrosequencing
16S rRNA PCR libraries targeting the V1-V3 hypervariable region were generated. Primers E9-29 and E514-430, specific for bacteria, were selected for their ability to generate the lowest amplification bias relative to amplification capability among the various bacterial phyla. The oligonucleotide design included 454 Life Sciences A or B sequencing titanium adapters (Roche Diagnostics, Vilvoorde, Belgium) and multiplex identifiers (MIDs), fused to the 5’ end of each primer. The amplification mix contained 5 units (U) of FastStart high fidelity polymerase (Roche Dianostics, Vilvoorde, Belgium), 1 x enzyme reaction buffer, 200 µM deoxynucleotide triphosphates (dNTPs) (Eurogentec, Liège, Belgium), 0.2 µM of each primer and 100 ng of genomic DNA in a final volume of 100 µL. Thermocycling conditions consisted of a denaturation step of 4 min at 94°C, followed by 25 cycles of denaturation (15 sec at 94°C), annealing (45 s at 56°C) and extension (60 s at 72°C), with a final elongation step (8 min at 72°C). These amplifications were performed on an EP Mastercycler Gradient System device (Eppendorf, Hamburg, Germany). The PCR products of approximately 650 nucleotides were run on 1% agarose gel electrophoresis and the DNA fragments were plugged out and purified using a Wizard SV PCR purification kit (Promega Benelux, Leiden, Netherlands). The quality and quantity of the products were assessed by Picogreen dsDNA quantitation assay (Isogen, St-Pieters-Leeuw, Belgium). Equal amounts of each of the PCR products were pooled and subsequently amplified by emulsion PCR. Pyrosequencing was performed with the Illumina sequencer (Illumina, Eindhoven, Netherlands) (2 x 300 bp). A mean of 60,000 reads for all days and all temperatures were analyzed for each FW packaging condition.
2.3 Bioinformatics analysis
The 16S rRNA gene sequence reads were processed with MOTHUR. The sequence reads were denoised using the Pyronoise algorithm implemented in MOTHUR. The sequences were checked for the presence of chimeric amplification using ChimeraSlayer. The obtained read sets were compared to a reference dataset of aligned sequences of the corresponding region derived from the SILVA database of full-length rRNA gene sequences implemented in MOTHUR. The final reads were clustered into operational taxonomic units (OTUs), using the nearest neighbor algorithm using MOTHUR with a 0.03 distance unit cut off. A taxonomic identity was attributed to each OTU by comparison to the SILVA database, using an 80% homogeneity cut off. As MOTHUR is not dedicated to the taxonomic assignment beyond the genus level, all unique sequences for each OTU were compared to the SILVA data set 111, using a BLASTN algorithm (Delcenserie et al., 2014). For each OTU, a consensus detailed taxonomic identification was given based upon the identity (< 1% mismatch with the aligned sequence) and the metadata associated with the best hit (validated bacterial species or not) (Delcenserie et al.,
Paper ID: 12
2014). As used by Cauchie et al. (2017) (Eq.1), the percentage of each OTU was finally converted as a proportion of the total viable count, obtained by classical microbiological analysis, in order to obtain estimate counts for each species (in log CFU/g).
Cbacterial species = (Ctotal flora x Preads of bacterial species) / 100 (1)
Where Cbacterial species is the estimated abundance concentration in the sample (log CFU/g), Ctotal flora is the bacterial concentration per samples in the PCA analysis (log CFU/g), and Preads of bacterial species is the proportion of reads for the bacterial species per samples in the metagenetic analysis (expressed in % of the total number reads in the sample).
According to this, a lower diversity of results was observed in the FW packaging and we selected this packaging to carry out the proof of concept and run the predictive microbiology analysis only on those results.
2.4 Predictive microbiology: fittings
Growth kinetics of the dominant spoilage flora were deduced from TVC counts and the OTU proportions. The primary growth model of Baranyi and Roberts (1994) was used to fit the data and estimate the growth parameters: lag-time (lag), initial bacterial concentration (N0), maximal bacterial concentration (Nmax) and maximal growth rate (µmax). A reparametrized version of the square root secondary model (Eq. 2) was then used to assess the effects of temperature on the growth rates. µ"#$= µ&'( )*)
+,-)./0*) +,-1
(2)
Where µref is the reference growth rate obtained at Tref = 20°C, T is the temperature and Tmin is the minimal temperature for growth found in the scientific literature. All fittings were performed using the nlsMicrobio package from the open source R software (R Core Team, 2016). These fittings were realized only on duplicate data sets from the durability study, the third dataset was kept for validation. 2.5 Simulation and validation
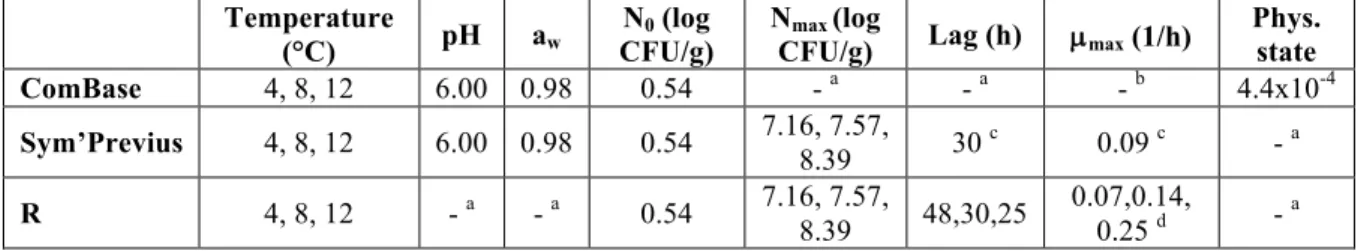
Simulations were run at 4°C, 8°C and 12°C for each species, using three independent software programs: the ComBase Predictor, Sym’Previus and R software. To run the simulations, information about the initial micro-organism load (N0), the temperature and the physico-chemical characteristics (pH, aw) were set to the observed values during the durability studies and introduced in the different software. Table 1 gives an overview of the simulations hypothesis only for Brochotrix thermosphacta as a proof of concept in this article.
Table 1: Simulation hypothesis used for Brochothrix thermosphacta with the three predictive software programs Temperature
(°C) pH aw CFU/g) N0 (log NCFU/g) max (log Lag (h) µmax (1/h) Phys. state
ComBase 4, 8, 12 6.00 0.98 0.54 - a - a - b 4.4x10⁻⁴ Sym’Previus 4, 8, 12 6.00 0.98 0.54 7.16, 7.57, 8.39 30 c 0.09 c - a R 4, 8, 12 - a - a 0.54 7.16, 7.57, 8.39 48,30,25 0.07,0.14, 0.25 d - a
a not taken into account in the model, b calculated by polynomial model of the tool, c calculated by model of the
tool for a reference at 8°C, d model based on the reparametrized version of the square root secondary model. The analysis of covariance (ANCOVA) test was used to evaluate if the results were significantly different between the validation data set and each of the simulation results at each time using R software. All tests were considered as significant for a p-value of < 0.05.
Paper ID: 12
The predicted growth rate parameters were evaluated using the bias factor (Bf) and accuracy factor (Af) (Lee et al., 2014), using Eqs. 3 and 4 respectively, in R software:
𝐵3 = 10 678 (;<./=,>?/=;@AB/.C/=) -,EF - (3) 𝐴3 = 10 678 H(;<./=,>?/=;@AB/.C/=) -,EF - (4)
Where xpredicted is the value obtained from simulations with R, ComBase and Sym’Previus, respectively, and xobserved is the value from the validation data set.
The bias factor (Bf) is a measure of average variation between the observed and predicted values. The Af indicates the spread of results about the prediction by disregarding whether the difference is positive or negative. A value factor close to 1 indicated that the model used in this work has high capability to fit the number of bacteria on WP.
3 RESULTS
3.1 WP ecosystem characterization and identification of major species
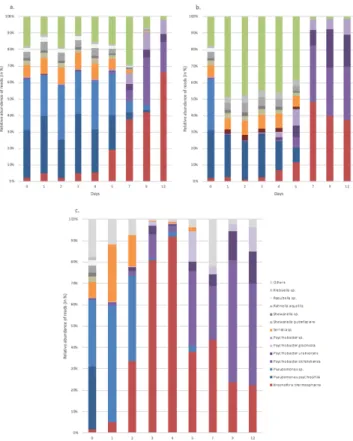
Figure 1 shows the relative abundance results obtained by metagenetics analysis for FW conditions at 4°C (a.), 8°C (b.) and 12°C (c.).
Figure 1: Bar chart detailing the relative abundances of the major bacterial species naturally present in white pudding samples in food wrap packaging at 4°C (a.), 8°C (b.) and 12°C (c.). Only the most abundant bacterial
species are in colour. Others species represent the total percentage of reads less than 1%.
The distribution of read percentages shows that the major bacterial spoilage microorganisms were Brochothrix thermosphacta, Pseudomonas spp., Psychrobacter spp., Serratia spp. and Shewanella spp.
Paper ID: 12
For all temperature conditions B. thermosphacta and Psychrobacter spp. were the major bacterial species at the end of the product shelf life and therefore used in the rest of the study.
3.2 WP kinetics and fittings results
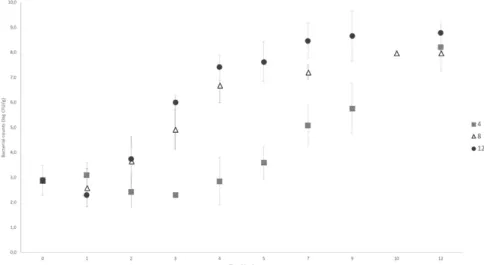
Figure 2 shows the PCA results from naturally contaminated Belgian white pudding at different temperatures (4, 8 and 12°C) in FW packaging, stabilized between 8.0 and 9.0 log CFU/g.
Figure 2: Enumeration of the total psychrotrophic aerobic microorganisms from naturally contaminated Belgian white pudding in food wrap packaging and stored at 4°C (squares), 8°C (diamonds) and at 12°C (triangles).
The bacterial growth parameters also showed different dynamic changes depending on storage temperature: a high storage temperature is correlated to a high growth rate during exponential phase and a lower lag-time.
3.3 FW packaging simulations and validation
Figure 3 shows the comparison between the observations from the validation data set obtained in the durability studies and simulations by the three software programs for Brochothrix thermosphacta as an example.
Figure 3: Observed (x) and predicted results (lines) in FW for Brochothrix thermosphacta, at 4 (a.), 8 (b.) and 12°C (c.). The predicted data obtained by the three software tools are indicted by lines: ComBase ( , dotted
line), Sym’Previus ( , dashed line) and the open source R software ( , broken line).
For the overall plot, a relatively good agreement is obtained between the observations and the simulations, showing that the approach combining the metagenetic and simulations based on an accurate database is promising. However, higher variability could be observed between simulations.
Paper ID: 12
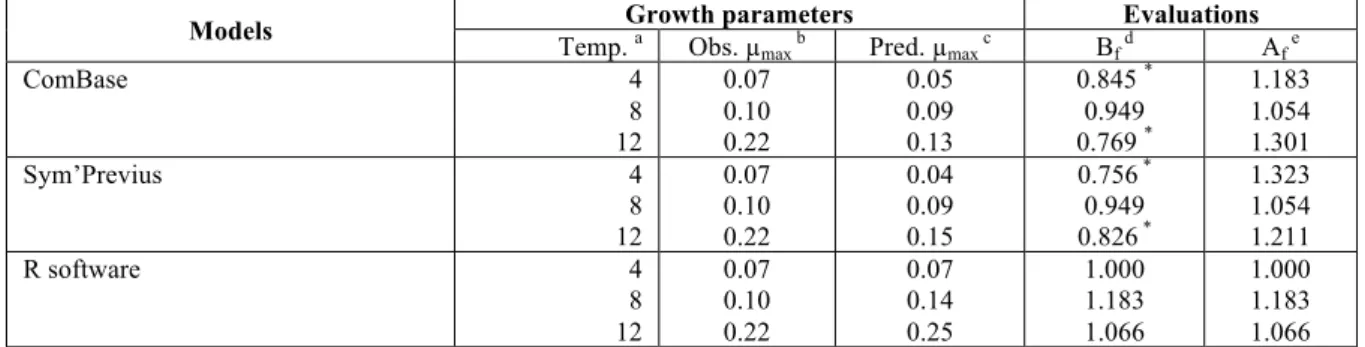
The correlation of the observed values obtained by the validation dataset with the predicted values obtained by simulations were performed for growth rates (Table 2).
Table 2: Correlation of the predicted growth rate with the observed values for Brochothrix thermosphacta in FW using Sym’Previus, ComBase and the open source R software.
Models Temp. Growth parameters a Obs. µ Evaluations
max b Pred. µmax c Bf d Af e
ComBase 4 8 12 0.07 0.10 0.22 0.05 0.09 0.13 0.845 * 0.949 0.769 * 1.183 1.054 1.301 Sym’Previus 4 8 12 0.07 0.10 0.22 0.04 0.09 0.15 0.756 * 0.949 0.826 * 1.323 1.054 1.211 R software 4 8 12 0.07 0.10 0.22 0.07 0.14 0.25 1.000 1.183 1.066 1.000 1.183 1.066
a temperature (°C), b the observed maximal growth rate (µ
max, 1/h), c the predicted maximal growth rate value
(µmax, 1/h), d bias factor, e accuracy factor, * unacceptable model performances < 0.85 or >1.25 (Mejholm and
Dalgaard, 2015).
As previously suggested for spoilage bacteria, the performance of a new model can be considered acceptable for Bf values in the range of 0.85 to 1.25 for lactic acid bacteria (Mejholm and Dalgaard, 2015). The most unacceptable performances were observed with ComBase and Sym’Previus simulations. Perfect fit of 1 was mainly observed with R software.
4 DISCUSSION
In this experiment, the total microbial load was estimated by using the plate count agar medium to observe the development of a whole ecosystem on Belgian white pudding. Although this method is widely used to follow the microbial evolution in food matrix, these results are not informative enough to describe bacterial communities. Metagenetics tools could be used as a supplementary technique to elucidate the detailed dynamics of the microbial population during spoilage, as shown in our results. However, this technique is not sufficient because it gives only relative results, which need to be associated with quantitative estimates, to assess the microbial load. In this study, the growth of bacteria was assessed daily at the same time, by combining classical microbiology and 16S rRNA metagenetics analysis, to provide a clear picture of the microbial community, to closely follow the obtaining of quantitative results for each bacterium during aging tests, and to determine the dominant bacterium within different environmental conditions. By integrating metagenetics with traditional microbiological analysis it was possible to extend this view of a highly quantitative characterization of dynamic changes that occur during chilled storage. These data may also contribute to set a database on food ecosystem composition.
In addition to predictive microbiology, these data enabled us to simulate the growth of each dominant bacterium. In this work, the data used as input for predictive models only concerned B. thermosphacta and Pseudomonas spp. as spoilage bacteria, with three different available models and predictive software. B. thermosphacta was then used as a proof of concept. The comparison of simulations showed a good fitting with validation curves obtained from durability studies. But it should be noted that an overestimation was mainly observed with the baranyi growth function in R, while an underestimation was more frequently observed with Sym’Previus and ComBase. These observations may be influenced by the condition of storage and/or the bacterial species. None of the predictive simulations gave an identical microbial curve to the validation kinetics obtained by the aging-test, even if all of the models showed good statistical fits with these data. The best performance factors were mainly observed with R and Sym’Previus. According to these results, some hypothesis can explain these differences. Indeed, the simulations did not take into account the effect of the competitive flora present in the product and only focused on one or two targeted species. Indeed, our study only concerned the two major bacterial species, Brochothrix thermosphacta and Pseudomonas spp., but as mentioned in the results section, others species are also present such as Psychrobacter spp. So, significant statistical
Paper ID: 12
differences for simulations are probably due to an interaction between bacterial species, compared to the evolution of each isolated bacterium in the same food matrix. On this basis, it would be worth including the possibility of considering microbial interactions between different types of microorganisms, to better predict microbial growth or inactivation in white pudding, and in complex food ecosystems (Tenenhaus-Aziza and Ellouze, 2015). Furthermore, as shown in the simulation hypothesis, the growth parameters used in the three software are not the same, which could explain the variability between simulations. Indeed, the food matrix may have an effect on the bacterial evolution, but only ComBase and Sym’Previus software applications took into account the intrinsic parameters of the Belgian white pudding, such as pH and water activity, which can explain why the R simulations sometimes showed an overestimation of the kinetics. It is possible to add intrinsic parameters with R simulations, but more cardinal values about the spoilage microorganisms are needed (Tmin, Tmax, Topt, aw(min), aw(opt), aw(max), pHmin, pHopt, pHmax, …). Finally, all bacteria chosen were in an internal database of ComBase but it was not possible to select a precise bacterial strain or food matrix for these simulations.
5 CONCLUSIONS
Compared to culture-based methods on selective media and previous independent culture techniques, metagenetics analysis combined with predictive microbiology gave more valuable information, and its use could be considered as a technique for quality control or for accurately determining shelf life. Microbiological ecology studies have shown that the microbiota of food is much more diverse than the cultivated group of bacteria studied by the use of culture media. The use of these new technologies will open a new era for modelling and predictive microbiology.
ACKNOWLEDGEMENTS
Our sincere thanks go to Proof-Reading Service (Devonshire Business Center, United Kingdom) for the support in English editing of the manuscript. This research did not receive any specific grant from funding agencies in the public, commercial, or not-for-profit sectors.
REFERENCES
AFNOR (2010). Hygiène des aliments, Lignes directrices pour la réalisation de tests de vieillissement microbiologique, Aliments périssables et très périssables réfrigérés, NF V01-003. France : Association française de normalisation.
Alfaro, B., Hernandez, I., Le Marc, Y., & Pin, C. (2013). Modelling the effect of the temperature and carbon dioxide on the growth of spoilage bacteria in packed fish products. Food Microbiology, 29, 429-437. https://doi.org/10.1016/j.foodcont.2012.05.046.
Baranyi, J., & Roberts, T.A. (1994). A dynamic approach to predicting bacterial growth in food. International Journal of Food Microbiology, 23, 277-294. https://doi.org/10.1016/0168-1605(94)90157-0.
Cauchie, E., Gand, M., Kergourlay, G., Taminiau, B., Delhalle, L., Korsak, N., & Daube, G. (2017). The use of the 16S rRNA gene metagenetic monitoring of refrigerated food products for understanding the kinetics of microbial subpopulations at different storage temperatures: the example of white pudding. International Journal of Food Microbiology, 247, 70-78. https://doi.org/10.1016/j.ijfoodmicro.2016.10.012.
Chaillou, S., Chaulot-Talmon, A., Caekebeke, H., Cardinal, M., Christieans, S., Denis, C., Desmonts, M.H., Dousset, X., Feurer, C., Hamon, E., Joffraud, J.J., La Carbona, S., Leroi, F., Leroy, S., Lorre, S., Macé, S., Pilet, M.F., Prévost, H., Rivollier, M., Roux, D., Talon, R., Zagorec, M., &Champomier-Vergès, M.C. (2014). Origin and ecological selection of core and food-specific bacterial communities associated with meat and seafood spoilage. ISME Journal, 9, 1105-1118. https://doi.org/10.1038/ismej.2014.202.
Paper ID: 12
Delcenserie, V., Taminiau, B., Delhalle, L., Nezer, C., Doyen, P., Crevecoeur, S., Roussey, D., Korsak, N., & Daube, G. (2014). Microbiota characterization of a Belgian protected designation of origin cheese, Herve cheese, using metagenomic analysis. Journal of Dairy Science, 97, 6046-6056. https://doi.org/10.3168/jds.2014-8225.
Elizaquivel, P., Pérez-Cataluna, A., Yépez, A., Aristimuno, C., Jiménez, E., Cocconcelli, P. S., Vignolo, G., & Aznar, R. (2015). Pyrosequencing vs. culture-dependent approaches to analyze lactic acid bacteria associated to chicha, a traditional maize-based fermented beverage from Northwestern Argentina. International Journal of Food Microbiology, 198, 9-18. https://doi.org/10.1016/j.ijfoodmicro.2014.12.027.
Ercolini, D., Ferrocino, I., Nasi, A., Ndagijimana, M., Vernocchi, P., La Storia, A., Laghi, L., Mauriello, G., Guerzoni, M.E., & Villani, F. (2011). Monitoring of microbial metabolites and bacterial diversity in beef stored under different packaging conditions. Applied and Environmental Microbiology, 77, 7372-7381. https://doi.org/10.1128/AEM.05521-11.
Food And Agriculture Organization of the United Nations (FAO), 2011. Global food losses and food waste – extent, causes and prevention. Romanticism.
Garnier, L., Valence, F., Pawtowski, A., Auhustsinava-galerne, L., Frotté, N., Baroncelli, R., Deniel, F., Coton, E., & Mounier, J., 2017. Diversity of spoilage fungi associated with various French dairy products. International Journal of Food Microbiology, 241, 191-197. https://doi.org/10.1016/j.ijfoodmicro.2016.10.026.
Huang, L. (2014). IPMP 2013 – A comprehensive data analysis tool for predictive microbiology.
International Journal of Food Microbiology, 171, 100-107.
https://doi.org/10.1016/j.ijfoodmicro.2013.11.019.
Lee, Y.J., Jung, B.S., Yoon, H.J., Kim, K-T., Paik, H-D., & Lee, J-Y. (2014). Predictive model for the growth kinetics of Listeria monocytogenes in raw pork meat as a function of temperature. Food Control, 44, 16-21. http://dx.doi.org/10.1016/j.foodcont.2014.03.024.
Li, L., Cepeda, J., Subbiah, J., Froning, G., Juneja, V.K., & Thippareddi, H. (2017). Dynamic predictive model for growth of Salmonella spp. in scrambled egg mix. Food Microbiology, 64, 39-46. https://doi.org/10.1016/j.fm.2016.12.007.
Martinez-Rios, V., Ostergaard, N.B., Gkogha, E., Rosshaug, P.S., & Dalgaard, P. (2016). Modelling and predicting growth of psychrotolerant pseudomonads in milk and cottage cheese.
International Journal of Food Microbiology, 216, 110-120.
https://doi.org/10.1016/j.ijfoodmicro.2015.09.020.
Mejholm, O., & Dalgaard, P. (2015). Modelling and predicting the simultaneous growth of Listeria monocytogenes and psychrotoleran lactic acid bacteria in processed seafood and mayonnaise-based seafood salads. Food Microbiology, 46, 1-14. http://dx.doi.org/10.1016/j.fm.2014.07.005.
Membré, J.M., & Lambert, R.J.W. (2008). Application of predictive modelling techniques in industry: from food design up to risk assessment. International Journal of Food Microbiology, 128, 10-15. https://doi.org/10.1016/j.ijfoodmicro.2008.07.006.
Nieminen, T.T., Koskinen, K., Laine, P., Hultman, J., Säde, E., Paulin, L., Paloranta, A., Johansson, P., Björkroth, J., & Auvinen, P. (2012). Comparison of microbial communities in marinated and unmarinated broiler meat by metagenomics. International Journal of Food Microbiology, 157, 142-149. https://doi.org/10.1016/j.ijfoodmicro.2012.04.016.
Parente, E., Cocolin, L., De Filippis, F., Zotta, T., Ferrocino, I., O’Sullivan, O., Neviani, E., De Angelis, M., Cotter, P.D., & Ercolini, D. (2016). FoodMicrobionet: a database for the visualisation and exploration of food bacterial communities based on network analysis. International Journal of Food Microbiology, 219, 28-37. https://doi.org/10.1016/j.ijfoodmicro.2015.12.001.
Pla, M.L., Oltra, S., Esteban, M.D., Andreu, S., & Palop, A. (2015). Comparison of primary models to predict microbial growth by the plate count and absorbance methods. Biomed Research International, 2015, 1-14. https://doi.org/10.1155/2015/365025.
R Core Team (2016). R: A language and environment for statistical computing. R Foundation for Statistical Computing, Vienna, Austria. https://www.R-project.org/
Riquelme, C., Câmara, S., Enes Dapkevicius, M. de L.N., Vinuesa, P., da Silva, C.C.G., Malcata, F.X., & Rego, O.A. (2015). Characterization of the bacterial biodiversity in Pico cheese (an artisanal Azorean food). International Journal of Food Microbiology, 192, 86-94. https://doi.org/10.1016/j.ijfoodmicro.2014.09.031
Paper ID: 12
Tenenhaus-Aziza, F., & Ellouze, M. (2015). Software for predictive microbiology and risk assessment: a description and comparison of tools presented at the ICPMF8 Software Fair. Food Microbiology, 45, 290-299. https://doi.org/10.1016/j.fm.2014.06.026.