Sediment dynamics in paired High Arctic lakes revealed
from high-resolution swath bathymetry
and acoustic stratigraphy surveys
A. Normandeau1,2, S. F. Lamoureux1, P. Lajeunesse3, and P. Francus4,5
1
Department of Geography and Planning, Queen’s University, Kingston, Ontario, Canada,2Now at Geological Survey of Canada, Bedford Institute of Oceanography, Dartmouth, Nova Scotia, Canada,3Centre d’études nordiques and
Département de géographie, Université Laval, Quebec City, Quebec, Canada,4Institut National de la Recherche Scientifique, Centre Eau Terre Environnement, Quebec City, Quebec, Canada,5GEOTOP, Montreal, Quebec, Canada
Abstract
High Arctic lakes are commonly used for paleoclimatic reconstructions because they are particularly sensitive to climate variability. However, the processes leading to sediment deposition and distribution in these lakes are often poorly understood. Here for thefirst time in the Canadian High Arctic, we present original data resulting from swath bathymetry and subbottom surveys carried out on two lakes at Cape Bounty, Melville Island. The results reveal the dynamic nature of the lakes, in which mass movement deposits and bedforms on the deltas reflect frequent slope instabilities and hyperpycnal flow activity. The analysis of the mass movement deposits reveals that small blocky debrisflows/avalanches, debris flows, and a slide occurred during the Holocene. These mass movements are believed to have been triggered by earthquakes and potentially by permafrost thawing along the shoreline. Altogether, these mass movement deposits cover more than 30% of the lakefloors. Additionally, the river deltas on both lakes were mapped and reveal the presence of several gullies and bedforms. The presence of gullies along the delta front indicates that hyperpycnalflows generated at the river mouth can transport sediment in different trajectories downslope, resulting in a different sediment accumulation pattern and record. The dynamic nature of these two lakes suggests that further analysis on sedimnt transport and distribution within Arctic lakes is required in order to improve paleoclimatic reconstructions.1. Introduction
High Arctic lakes are sensitive environments to climate change, and their lacustrine sedimentary archives can record climate variability over several hundred to thousand years [Overpeck et al., 1997; Chutko and Lamoureux, 2008; Lapointe et al., 2012]. Their sensitivity to climate has drawn the attention of limnogeologists and paleolimnologists for many decades with the aim of reconstructing past and recent climate change [Kaufman et al., 2009; Lamoureux, 2000; Melles et al., 2006]. These reconstructions are valuable to understand the rates to which different aspects of climate have changed over time. Such reconstructions are often based on sediment cores collected in the deepest part of lakes because it is often assumed that these locations accumulate sediments that are representative of sediment inflows. However, studies on sedimentary pro-cesses in lacustrine environments have shown that sediment distribution can vary greatly in lakes with com-plex bottom topography, which has considerable consequences for paleoenvironmental studies [Gilbert, 2003]. Additionally, recent studies provide evidence that the deposition of sediment in lakes is sensitive to numerous internal and external forcing mechanisms that are often difficult to differentiate from the analysis of sediments. For example, it was demonstrated thatflood deposits are not consistently related to the highest rainfall event, as frequently inferred [Kämpf et al., 2015]. Hence, understanding sedimentary processes within lakes is critical in assessing the hydroclimate record of sediments.
The logistics of performing research in High Arctic environments generally restrains the ability of using cutting-edge technology. These environments are often only reachable by small aircraft, which makes it very expensive to transport subbottom profilers and multibeam echosounders. Therefore, a wide range of studies in the High Arctic rely solely on the interpretation of sediment cores [e.g., Cuven et al., 2011; Lamoureux and Bradley, 1996]. High-resolution Chirp subbottom profilers were previously used in High Arctic environments [Gilbert and Desloges, 2005; Lamoureux et al., 2002], while swath bathymetry has never been carried out because of the difficulty of transporting complex instrumentation to these remote and isolated locations
PUBLICATIONS
Journal of Geophysical Research: Earth Surface
RESEARCH ARTICLE
10.1002/2016JF003873
Special Section:
The Arctic: An AGU Joint Special Collection
Key Points:
• First high-resolution bathymetric investigation of High Arctic lakes • High Arctic lakes are dynamic,
reflecting sediment inflows and mass movements
• Acoustic surveys support interpreting sedimentary processes and paleoenvironmental records
Correspondence to:
A. Normandeau,
Citation:
Normandeau, A., S. F. Lamoureux, P. Lajeunesse, and P. Francus (2016), Sediment dynamics in paired High Arctic lakes revealed from high-resolution swath bathymetry and acoustic strati-graphy surveys, J. Geophys. Res. Earth Surf., 121, 1676–1696, doi:10.1002/ 2016JF003873.
Received 23 MAR 2016 Accepted 4 AUG 2016
Accepted article online 9 AUG 2016 Published online 24 SEP 2016
©2016. American Geophysical Union. All Rights Reserved.
and deploying them from small inflatable boats. However, swath bathymetry, in combination with high-resolution Chirp subbottom profilers, can provide a very detailed framework of the geological settings and processes acting on sediment distribution [Hilbe and Anselmetti, 2014; Normandeau et al., 2013].
This paper presents for thefirst time an investigation of processes from two High Arctic lakes based on high-resolution swath bathymetry and subbottom profiler surveys carried out during the summer of 2015. A preliminary survey was conducted during the summer of 2013 [Normandeau et al., 2016] on only half of East Lake because of the presence of ice during late July, which limited significantly the overall understand-ing of sedimentary processes. Based on a high-resolution lakefloor morphostratigraphic analysis, this study aims at providing a comprehensive framework on the geomorphology and sedimentary processes of two High Arctic lakes. Specifically, this study aims at (1) documenting the basin-wide distribution of the lacustrine infill through a detailed acoustic stratigraphy analysis, (2) describing the various surface expressions of internal lake processes such as mass movements deposits (MMDs), (3) identifying the frequency and causes of such extreme events, and (4) linking process studies on hydroclimate-driven sediment transport to the lakes to the geomorphic expression on the lakefloor. This study sheds new light on subaqueous processes occurring in High Arctic lakes and shows how swath bathymetry and subbottom profiles is a necessary com-plement to the analysis of a paleoclimate record.
2. Regional Settings
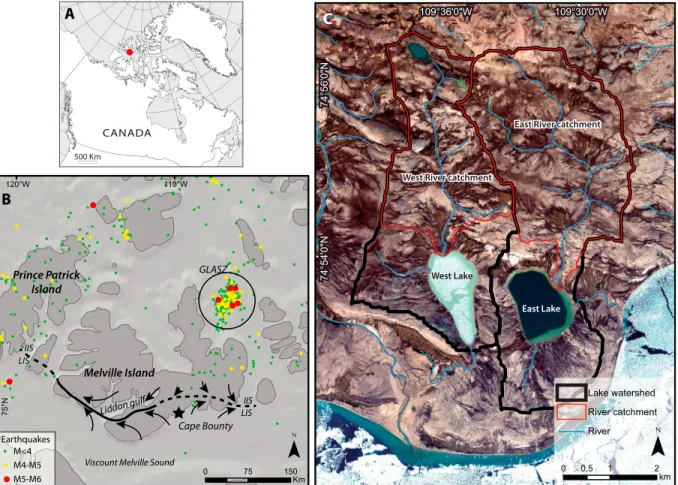
The East and West Lakes (unofficial names; 74°53′N, 109°32′W and 7453′N, 109°36′W, respectively) are located at Cape Bounty on the south-central coast of Melville Island in the Canadian High Arctic (Figure 1). The two lakes are small (~1 × 2 km), having depth of approximately 30 m. Both lakes are approximately 5 m above sea
Figure 1. (a) Location of Melville Island, in the Canadian High Arctic. (b) Location of Cape Bounty, on Melville Island, as well as historic earthquakes from the Gustaf-Lougheed Arch Seismic Zone (GLASZ) and the limit between the Innuitian Ice Sheet (IIS) and the Laurentide Ice Sheet (LIS). (c) Location of East and West Lakes (Cape Bounty, Melville Island) and their respective watersheds.
level (asl), indicating that they were located below Holocene sea level during deglaciation. During the Last Glacial Maximum, the Laurentide Ice Sheet (LIS) and the Innuitian Ice Sheet (IIS) coalesced along the southwestern shore of Melville Island near this location [England et al., 2009]. On eastern Melville Island, the positions of both the LIS and the IIS margin are speculative but tentative maps suggest that the ice sheets coalesced inland, approximately 25–50 km north of the Viscount Melville Sound [England et al., 2009]. The deglaciation began around 13.5 ka cal B.P. on the southern sector of Melville Island. At the time of deglaciation, relative sea level (RSL) was approximately 75 m asl in southern Melville Island and glacial retreat led to the relatively slow initial postglacial emergence (≤1 m/century) before increasing by 11.5 ka cal B.P. Near Cape Bounty, sea level is thought to have attained approximately 10 m asl by 8 ka cal B.P. [Nixon et al., 2014]. Near East and West Lakes, glacio-isostatic rebound led to the formation of an estuary near 4145 B.P. and to full limnic conditions by 1700 B.P. based on the varved sedimentary record in East Lake [Cuven et al., 2011].
In 2003, hydrological and limnological studies of East and West Lakes began as part of the Cape Bounty Arctic Watershed Observatory. Research on hydrological conditions of both East and West Rivers reveals that snow-water equivalence is generally the most important factor controlling runoff and suspended sediment concentrations in the rivers [Cockburn and Lamoureux, 2008a]. Monitoring of sedimentary processes in both lakes during the early to mid-2000s indicated that depositional rates are dependent on short-lived inflow events occurring during high suspended sediment concentration (SSC) events in East River [Cockburn and Lamoureux, 2008b]. These high SSCs were observed mostly during the nival snowmelt [Cockburn and Lamoureux, 2008b] but in other years were accentuated during major rainfall events [Dugan et al., 2009]. Rainfall runoff response and SSC were shown to be dependent on antecedent soil moisture conditions [Favaro and Lamoureux, 2014] and the presence and morphology of disturbances (e.g., active layer detach-ments) in the watersheds [Lamoureux and Lafrenière, 2009; Lamoureux et al., 2014]. Disturbances were shown to mainly affect the chemical conditions of the lakes, while sediment transport from the disturbances only had a short-lived impact [Dugan et al., 2012]. Sediment cores collected in East Lake also allowed linking hydroclimate variability to the physical and geochemical properties of the varves present in East Lake. For example, Lapointe et al. [2012] documented a recent increase in coarse particles being deposited in East Lake, which they linked to an increase in summer rainfall intensity since 1920. This increase in rainfall is suggested to be a response to the ongoing warming of the Arctic.
3. Material and Methods
High-resolution bathymetric maps were produced for both East and West Lakes from a hydroacoustic survey undertaken in August 2015. A GeoAcoustics GeoSwath Plus Compact interferometric bathymetric sonar (250 kHz) was deployed on a 2.5 m Zodiac inflatable boat and allowed imaging water depths greater than 1–2 m. The sonar was coupled with a Hemisphere DGPS that had approximately 1 m horizontal resolution and a SMC motion sensor. Sound velocity profiles were collected routinely, but the absence of water stratifi-cation within the lakes at that time facilitated the survey. The data were then processed using the Caris Hips and Sips® software where vessel calibration and sound velocity profiles collected in the water column allowed to correct the raw sounding data. This software was also used for backscatter processing. The high-resolution bathymetric maps were then exported to ArcGIS® and Fledermaus® from which geomorphological properties of the lakefloors could be extracted.
A total of 48 km of subsurface data was acquired in both lakes (24 km in each lake) using a 12 kHz Knudsen 3212 subbottom profiler from the same inflatable boat. The lines followed a 100 m grid (Figure 2), which pro-duces a very high spatial resolution image of the sedimentary record of both lakes. The data were analyzed with the Kingdom Suite® software to produce isopach maps, and pseudo-3-D fence diagrams of acoustic units were produced with the SonarWiz® software.
4. Results
4.1. Lake Floor Geomorphology 4.1.1. Lake Morphology
The East and West Lakes form basins with maximum depth of 31 and 34 m, respectively (Figure 3). In both cases, the greatest depths are located near the front of the deltas that prograde into the lakes. More than half
of the lakes have depths greater than 15 m, West Lake having a larger and deeper basin at the front of its delta than the East Lake. Depths become progressively shallower away from the deltas. The slopes are gen-erally steep along the lake margins, reaching in some areas more than 20° (Figure 4a). In both lakes, the slopes are especially steep at the delta fronts. The lakefloor of East Lake is generally smoother compared to West Lake. In East Lake, the gentler slopes are concentrated along the southern shore and they are relatively steep
Figure 3. Swath bathymetry of East and West Lakes. Note the sandy nearshores surrounding East Lake.
Figure 2. Subbottom profile acquisition paths spaced 100 m apart in East and West Lakes. The bold lines represent the subbottom profiles presented in Figures 10 and 12.
elsewhere. In West Lake, the entire lakeshore is generally composed of steep slopes. Additionally, in both lakes, slopes sometimes reach values≥10° near their center. In West Lake, this is mainly due to a hummocky lakefloor, whereas in East Lake, the higher slopes are reflected by a notable scarp.
The vector ruggedness measure (VRM), which is a measure of the variation in three dimensions of the orien-tation of grid cells within a neighborhood [Sappington et al., 2007], differs slightly in both lakes. High values of VRM are attributed to mass movement deposits (MMDs), blocky debris, scarps, and ridges. In East Lake, the VRM is generally smooth compared to the more rugged surface of West Lake (Figure 4b), indicating the more widespread presence of disturbances in the latter lake.
4.1.2. Mass Movement Deposits
Mass movement deposits (sometimes referred in the literature as landslide deposits or mass transport depos-its) are widespread in both East and West Lakes, covering approximately 30% and 42% of their respective area.
Figure 4. (a) Slope map and (b) vector ruggedness measure (VRM), where higher VRM values indicate more rugged lake floor surface and distribution of the different types of MMDs.
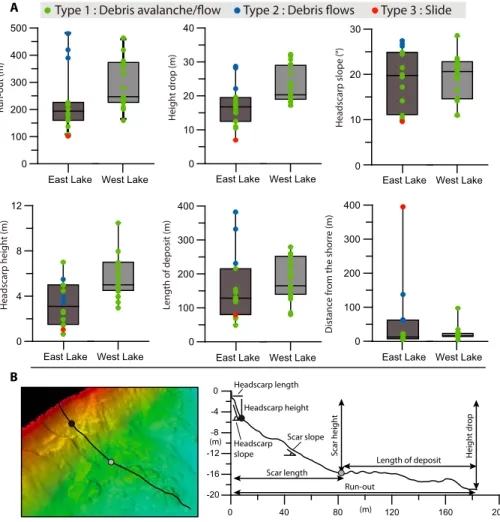
These values were obtained by identifying MMDs that have a surface expression and do not include those that are buried, with no surface expression. Three types of MMDs are observed and differentiated based on their morphological properties and on their distinctive surface expression. Properties described here follow the terminology used by McAdoo et al. [2000] and Moernaut and De Batist [2011] and are outlined in Figure 5b.
Figure 5. (a) Morphological properties of the three types of mass movement deposits observed in both East and West Lakes. The dots represent the values obtained for each type of MMD. (b) The graphs explaining how the MMD
measurements were obtained.
Figure 6. (a) Onshore headscarp of a sublacustrine mass movement deposit (see handheld GPS for scale). (b) Typical material observed on the shoreline surrounding both lakes (see shotgun for scale). Photographs taken on August 2015 (A. Normandeau).
Types 1 MMDs have headscarps located close to the shoreline (mean distance of 11 m and 20 m in East and West Lakes, respectively; Figure 5), which is composed of coarse material, typically sand and gravel with boulders (Figure 6). One of these MMDs can also be correlated to a headscarp located above lake level (Figure 6a). Type 1 MMDs are characterized by blocky debris and strong surficial deformation (Figure 7a), visi-ble by the strong VRM values over the deposits (Figure 4b). They have little to noflow structures. They are the most common type and represent 34% of the MMDs area in East Lake (but 71% of the number of MMDs) and 100% of the MMDs present in West Lake. The runout distances and height drops of these type 1 MMDs are typically greater in West Lake compared to East Lake (Figure 5), while other parameters such as headscarp slope and length of deposit are more similar (Figure 5).
Type 2 MMDs are located exclusively in East Lake and are represented by three deposits (Figures 4b and 5). The headscarps of these mass movements are located farther away from the shoreline than the type 1 (mean of 88 m). On the satellite imagery, a shallow,flat-bottom sandy shoal is observed above the headscarps (Figures 3–7b), which indicates the presence of relatively fine sediments in the source area. The runout dis-tances and height drops of these deposits are generally greater than type 1, having means of 430 m and 26 m, respectively (Figure 5). The headscarp slopes and maximum lengths of the deposits are also greater. Type 2 MMDs are also characterized by lower values of VRM in the distal position of the deposits, indicating less debris (Figure 4b). However, their distal portion is characterized by pressure ridges (frontal thrusting), which is exclusively observed in type 2 MMDs. Their proximal portions consist of boulder-sized debris (Figure 7b), which increase the VRM values near the headscarps (Figure 4b).
Figure 7. Swath bathymetry images of the three types of mass movement deposits observed in East and West Lakes. (a) Type 1 interpreted as small blocky debris avalanches/flows from the eastern shore of West Lake. (b) Type 2 inter-preted as debrisflows with pressure ridges from the northern shore of East Lake. (c) Type 3 interpreted as a slide deposit from East Lake. See Figure 3 for the location of images.
There is only one MMD that is classified as type 3, and it consists of a mounded deposit that does not present intense deformation (low VRM values) and does not present frontal thrusting (Figures 4b–7c). However, this deposit is buried under 1 m of sediment (although it is still visible on the bathymetry data), which is possibly the reason why the VRM values are low. It was initiated 400 m away from the shoreline at a depth of 20 m (Figure 5). Its runout distance, height drop, and headscarp slope are the lowest of the MMDs in both lakes.
4.1.3. Deltas
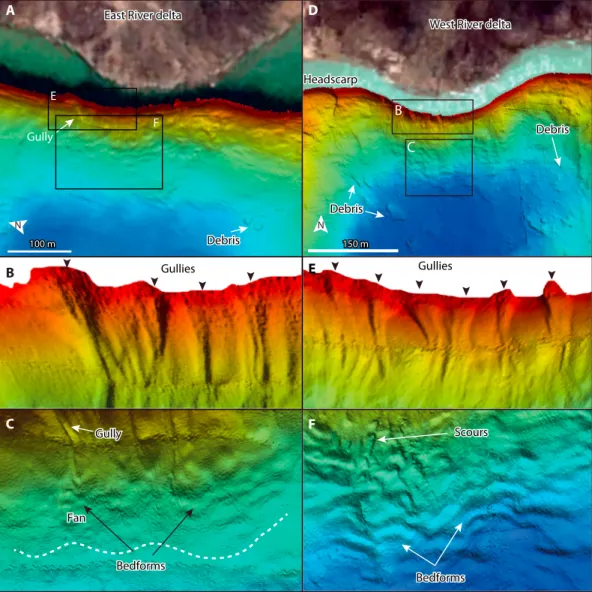
The West Lake delta has a steep upper slope, with a mean angle of 27°, sometimes reaching as much as 30° locally, but the overall slope to the delta base is lower (approximately 10°). On the steepest slopes, near the river mouth, the delta front is interrupted by six small gullies (Figures 8d and 8e). These gullies have approxi-mately 10 m wide heads and a narrow channel evolving downslope on a length of 10–15 m. The local relief of these gullies is less than 1 m. Farther downslope, gullies are absent and are replaced by unchannelized bed-forms and small scours (10–20 m wavelength) that are observed starting at a depth of approximately 15 m, located closer to the delta base (Figure 8f).
Figure 8. Swath bathymetry images of the (a–c) West and (d–f) East River deltas. Figure 8b denotes the gullies at the front of the East River delta. Figure 8c denotes the small fan and bedforms at the base of the East River delta slope. Figure 8e denotes the gullies on the West River delta front. Figure 8f denotes the scours and bedforms near the base of the delta slope on the West River delta.
The East Lake delta has a similar overall shape as the West Lake delta. The upper slope also ranges between 25° and 30°, and the total slope is approximately 12°. The gullies observed near the rollover point (limit between delta front and delta slope) are 10 m wide except one that has a larger head, reaching 30 m wide (Figures 8a and 8b). This larger gully has a length of over 50 m, until a depth of 16 m. At the base of the delta slope, a fan-shaped accumulation of sediment is observed with small bedforms (10 m wavelength) on it (Figure 8c). To the south, bedforms are also observed at the delta base with wavelengths of 10–20 m (Figure 8a).
4.2. Reflectivity of the Lake Floors
The backscatter (or reflectivity) is a good indicator of sediment type and texture of the lake floors [Collier and Brown, 2005]. In both lakefloors, it is mainly characterized by low intensities (Figure 9a). In East Lake, higher intensities are observed off the East River delta and along the western shore. The area of higher intensities off the delta covers the deepest basin, restricted between topographic highs, and has an area of approximately 0.13 km2(Figures 9a and 9b). The West River delta also has higher intensities near the shore, but unlike East Lake, these higher intensities do not extend offshore to the deep basin. The higher intensities related to the MMDs have different appearances in both lakes. In East Lake, the higher intensities on the western shore represent blocky debris and are sparsely located along intensities similar to background sediments (Figure 9c). In West Lake, the highest intensities are more widespread and homogenous and are also located where MMDs are present (Figure 9d).
Most of the MMDs in both lakes are clearly visible on the reflectivity imagery, although some of the type 2 MMDs in the East Lake are difficult or impossible to discern from the background intensities (Figure 9). The absence of distinct intensities suggests that they are covered by a thin sediment drape or that they are composed of similar grain size than the background sediments.
Figure 9. Reflectivity of the lake floors: (a) backscatter intensity of East and West Lakes. The black triangles indicate the viewpoint for Figures 9b–9d. The north-south parallel lines are the artifacts and represent the nadir of the swath sonar. (b) Higher backscatter intensity concentrated in the deeper basin of East Lake, at the front of the East River delta. (c) Mass movement deposits (type 1, debris avalanches) on the western shore of East Lake. (d) Mass movement deposits (type 1, blocky debris avalanches/flows) on the western and northern shores of West Lake.
4.3. Acoustic Stratigraphy—Description and Interpretations
The acoustic stratigraphy of both lakes reveals two very similar sedimentary infills that are composed of three main units. Additionally, one acoustic facies that is observed within the two upper units is described sepa-rately as mass movement deposits. The reader is referred to Cuven et al. [2011] for a detailed sedimentological description of the sedimentary sequence.
4.3.1. Unit 1—Acoustic Basement
The lowermost acoustic Unit 1 is the acoustic basement. It has a relatively smooth to rolling surface morphol-ogy. In West Lake, this unit has a hummocky morphology in its central part, while it appears smoother in East Lake (Figure 10).
The absence of acoustic penetration through these sediments indicates that they are composed either of coarse material, likely sand and/or gravel, or compacted and indurated sediment. The hummocky relief in West Lake is interpreted as till deposited from an in situ melting ice front. Based on the morphology of Unit 1, it is assumed that the entire acoustic basement is made of till and/or coarse sediments of glacial origin. This unit was not reached by the sediment core described in Cuven et al. [2011].
4.3.2. Unit 2—Glacimarine to Marine Sediments
Acoustic Unit 2 overlies conformably Unit 1 and is mostly transparent (reflection-free). It is bounded by a lower high-amplitude reflection (top of Unit 1), while its upper contact is more gradual toward the high-amplitude reflections of the overlying Unit 3 (Figure 10). In the northern part of East Lake, a high-amplitude reflection is observed halfway through this unit (Figure 10a) and is absent in West Lake. This high-amplitude reflector is flat on the lake margin and becomes chaotic at the base of the slope. The reflection-free unit is assumed to be covering the entire bottom of both lakes, although the lack of acoustic penetration in some areas prevents imaging the entire unit. In both lakes, mean thickness of Unit 2 is approximately 2.4 m (STD
Figure 10. North-south subbottom profiles of (a) East and (b) West Lakes illustrating the three acoustic units and mass movement deposits. Note the smooth bottom topography of East Lake in comparison with West Lake.
of 0.8 m, calculated assuming a speed of sound of 1500 m/s; Figure 11a). Unit thickness is relatively similar over the entire lakes (where observed in acoustic stratigraphy) except in the northern part of East Lake where thickness is greater due to the presence of an internal transparent but chaotic lense (mass movement deposit facies; Figures 9a and 10a). Cuven et al. [2011] cored this acoustic unit in 2006 and described the sediments as
Figure 11. (a) Isopach map of acoustic Unit 2. (b) Isopach map of acoustic Unit 3. (c) Distribution of recent MMDs located at the top of Unit 3, buried MMDs located within Unit 3 and a buried MMD located within Unit 2.
massive compacted grey mud, which is consistent with the reflection-free appearance in the subbottom profiles.
The reflection-free appearance indicates the presence of homogenous mud. Its stratigraphic position above the sediments interpreted to be of glacial origin (Unit 1) suggests that this unit is glacimarine to marine. Similar acoustic units were observed in other glacimarine and marine environments in southern Canada [Normandeau et al., 2013; Praeg et al., 1992]. Unit 2 would thus have been deposited during the retreat of the LIS and IIS after 13 ka B.P., when RSL was falling from marine limit at 75 m asl [Cuven et al., 2011; Nixon et al., 2014].
4.3.3. Unit 3—Postemergence Laminated Sediments
Acoustic Unit 3 is acoustically stratified and consists of high-amplitude reflections that drape the underlying Unit 2 conformably (Figure 10). Similar to the underlying units, it covers most of both lake basins and thins toward the steep slopes close to shore (Figure 10). The thickness of this unit varies between the lakes, with
Figure 12. Subbottom profiles illustrating mass movement deposits facies: (a) upper sequence MMD and its gliding plane in East Lake, (b) coeval MMDs located approximately 1 m below the East Lakefloor, (c) recent and buried MMDs in West Lake, and (d) stacking of MMDs in West Lake.
a mean thickness of 3.7 m in West Lake and 2.9 m in the East Lake (Figure 11b). Maximum thicknesses of 8 m in East Lake and 7 m in West Lake occur in the deep basins near the river deltas (Figure 11b). Thickness is generally greater near the West River delta and thins toward the lake outflow (Figure 10), at the southern end of the lake. Sediment cores collected over the lake bottom of both lakes reveal that Unit 3 consists of laminated silty-sandy sediments intercalated withfine mud [Cuven et al., 2010, 2011; Lapointe et al., 2012]. In the deepest basins, these laminated sediments were shown to be varves [Cuven et al., 2011; Lapointe et al., 2012], where the coarse fraction was deposited during the summer months and thefine mud during ice-covered winter months. However, this may not be the case in shallower areas where the laminated sediments could represent intervals with high sediment deposition. Nonetheless, according to Cuven et al. [2011], these laminated sediments were deposited in estuarine and lacustrine environments.
4.3.4. Mass Movement Deposit Facies
Units 2 and 3 are internally disturbed by chaotic to transparent acoustic lenses (Figure 11c). The chaotic appearance of this facies and its occurrence below mass movements deposits described in swath bathy-metry (Figures 12 and 13) indicate that they are MMDs. Similar acoustic facies were described in other lakes worldwide [e.g., Charlet et al., 2007; Schnellmann et al., 2007]. The acoustic appearance of the MMDs is similar between the different types identified with the swath bathymetry and could not help dif-ferentiate them. Figure 13 illustrates the three different types of MMDs and their swath bathymetry and acoustic stratigraphy appearance.
In East Lake, afirst appearance of these chaotic facies occurs within Unit 2, in the northern part of the lake (Figures 10a–13). It is bounded upward by a high-amplitude reflection previously described. A second appearance of this chaotic facies is observed at approximately 1 m below the lakefloor (Figures 10, 12a, and 13), and three of the deposits are correlated throughout the lake. These three MMDs could be correlated because recent MMDs are not present above them in the sedimentary record. Other MMDs may be correlated to these ones but are not visible due to more recent MMDs attenuating the underlying reflections. The third appearance of MMD facies in East Lake is located at the top of the sequence and is more widespread (Figures 12a, 12b, and 13). These MMD facies appear to have been deposited during a single event, although they could also have been deposited at a few years interval, which is not resolvable with the acoustic data. In West Lake, the MMD history is complicated by their more widespread presence over the lakefloor (Figure 11c). Most of the MMDs observed in the acoustic stratigraphy are located in the upper sequence (Figures 12c and 12d), similar to those observed in East Lake, suggesting that they were deposited during the same event or interval. However, the buried MMDs are more difficult to correlate since they often lay
Figure 13. The 3-D view of the three different types of MMDs and their acoustic stratigraphic expression in East Lake. Location of view in Figure 3.
under the more recent ones and are consequently obscured. Additionally, the limited thickness of sediment accumulation prevents imaging individual MMDs in some cases (Figure 12d).
5. Discussion
5.1. Holocene Sedimentary Record
The morpho-stratigraphic analysis reveals two very similar basins in terms of sediment accumulation, consist-ing of three acoustic units: till or glacially derived sediments (U1) overlain by glacimarine to marine sediments (U2) and laminated postemergence sediments (U3). Within this sedimentary sequence, MMDs remobilized parts of U2 and U3. This similarity between both lakes indicates that both basins share a similar origin and Holocene evolution. Regional late Quaternary history suggests that the bottom of the lakes would have likely been covered by the LIS [England et al., 2009]. In West Lake, the hummocky bathymetry observed in the center of the lake is similar to hummocky moraines related to the melting of stagnant ice identified in other locations [e.g., Eyles et al., 1999].
Following the deposition of till, glacimarine inundation at 13.5 ka cal B.P. led to the deposition of approxi-mately 2.5 m of massive mud (U2) both in the lakes and up to a maximum altitude of 75 m asl, the marine limit of the region. Massive mud can be observed in glacimarine settings, reflecting either suspension settling where tides and/or seasonal changes are too weak to produce laminations or where biological activity reworks the sediment [e.g., Gilbert et al., 2002]. Cuven et al. [2011] associated the massive mud in U2 to oxic conditions due to evidence of bioturbation. Bioturbation is common in sediments deposited when the ice margin is in a distal position [Gilbert et al., 1990]. The blanket-like draping indicates that the sediments were deposited by suspension settling instead of high-energy turbidity currents, which is consistent with the gen-eral absence of high-amplitude reflections, indicating little variation in sediment transport capacity. The transition from a glacimarine/marine setting to a limnic environment appears to have taken place gradually. Medium-amplitude reflections probably correlate with this transition from marine to lacustrine environments, whereas the upper high-amplitude reflections indicate the deposition of laminated sediments (varves). Cuven et al. [2011] observed, in a core collected in East Lake, diffuse and veryfine laminations (their Unit 2), which can be correlated with this transition between U2 and U3 based on the depth of the units. While glacio-isostatic rebound forced marine regression, brackish waters favored the deposition offine and diffuse laminae. Terrestrial runoff also increased as lowering RSL favored the deposition of terrigenous and laminated sediments [Cuven et al., 2011]. When the lake isolation took place by 1700 ka B.P., full limnic conditions then allowed enhanced underflow deposition [e.g., Nutz et al., 2013] and the deposition of lacus-trine varved sediments in the deep basins and laminated sediments in shallower settings. While this Holocene history of the lakes is simple, it has wider implications for the presence and generation of mass movement deposits.
5.2. Mass Movement Deposits
5.2.1. Nature of Mass Movements Deposits
Mass movement deposits are widespread across both East and West Lakes, covering>30% and >42% of the lakefloors, respectively. Most of the MMDs share similar morphological properties (type 1), characterized by blocky debris at the base of the slope with occasional outrunner blocks. This morphological expression sug-gests that they are small blocky debrisflows/avalanches [e.g., Gardner et al., 2000]. Debris avalanches occur where coarse cohesionless material travels downslope and where energy dissipation is made by grain con-tact [Masson et al., 2006]. They are relatively thin mass movements with a clear headwall and the presence of blocky debris in a distal position (Figure 9c) [Moore et al., 1989]. Debris avalanches are characterized by lobate deposits withoutflow structures, large blocks, and their random distribution [Masson et al., 2006]. This description is consistent with the type 1 MMDs observed throughout both lakes. Some of the MMDs have faintflow structures, which are rather associated with blocky debris flows (Figure 7a). The headscarps of the MMDs are consistently located close to shore (10–20 m from the shore) or even in one case, onshore (Figure 6a). The shores of the lakes are mostly composed of sand, gravel, and boulders (Figure 6), which would explain the blocky nature of these deposits, the high reflectivity values observed on the lake floor, and the absence of acoustic penetration over most of them. In East Lake, these deposits are the most fre-quent type of MMDs (71% of the MMDs) but are much less significant in terms of sediment transport, cover-ing only 34% of the lake surface affected by MMDs.
Type 2 MMDs, which also contain blocky debris in a proximal position but have longer runout distances as well as distal pressure ridges, suggest a downslope evolution into a debrisflow. Debris flows are laminar cohesiveflows containing clasts in a fine-grained matrix [Masson et al., 2006]. The penetration of the subbot-tom acoustic signal and lower values of backscatter intensities over type 2 MMDs support the presence of a fine-grained matrix typical of debris flows. A fine-grained matrix will disintegrate easily and produce morpho-logical features typical of subaqueous debrisflows such as pressure ridges.
There is only one example of type 3 MMD located in East Lake. This mass movement was generated at a depth of 20 m, which is unusual in the lakes. The morphological expression of this MMD is greatly reduced due to an approximately 1 m of sediment drape, but it can still be delimited in the swath bathymetry. Based on its morphological properties, the MMD can be classified as a slide. Slides have sliding zones parallel to the surface slope where sediments are displaced downslope and generally have limited displacement of mass [Mulder and Cochonat, 1996] that, in this case, could be due to the lower slope angle and height drop that in turn limit its runout distance.
5.2.2. Lake Sensitivity to Mass Movements
Lake sensitivity to mass movements has been the object of numerous studies [e.g., Schnellmann et al., 2005; Hilbe et al., 2011; Kremer et al., 2015a]. The instability of lake sediment has been attributed mainly to slopes, sediment thickness/accumulation, and the presence of weak layers [Masson et al., 2006]. According to recent studies, the main factor responsible for slope failures (or stability) is the availability of sediments and sedimentation rates [Wilhelm et al., 2015]. Generally, the sedimentation rates and thus the availability of sediments in nearshore environments are reduced due to high-angle slopes and distance from the source of sediment supply. At Cape Bounty, the high Holocene RSL [Nixon et al., 2014] favored the deposi-tion of a substantial amount (≤4 m) of marine and estuarine sediments, thus allowing sediment to be deposited on slopes far from afluvial input. Although modern sedimentation rates appear to be low on the margins, the Holocene RSL history allowed substantial amount of sediments to be deposited on slopes that are now prone to failure.
A second important factor controlling lake sensitivity to mass movements is the slope angle, which defines the gravitational forces acting on sediment. Steep slopes will generally tend to increase lake sensitivity to slope failures because of destabilizing loading forces. However, Wilhelm et al. [2015] demonstrated that slopes steeper than 20° did not generally accumulate sufficient amount of sediments and therefore reduced the sensitivity of these high slopes to mass movements. A 10–20° slope would appear ideal according to these authors. These values are consistent with the values of undisturbed maximum slopes observed near the scars in West and East Lakes. Moreover, it is clear from the distribution of the mass movements that failure occurs where slopes are steepest. For example, very few mass movements were observed on the southern shore of East Lake, where slopes are<5°. In contrast, they are frequent on its steeper eastern shore. It is, how-ever, surprising that there is limited evidence of slope failures on the delta fronts. In these sectors, slopes are steep and sedimentation rates are high as well, which would in principle increase the sensitivity to mass movements [e.g., Hughes Clarke et al., 2014]. The low sensitivity of the delta front to slope failures could be attributed to coarser grain sizes (i.e., sand) deposited at their angle of repose and that are consistently remo-bilized by hyperpycnalflows.
A third factor that appears to control slope failures is the stratigraphy of the lake sediments. Acoustic profiles collected over the MMDs reveal that the laminated sand and silt unit (U3) in some cases slid over the under-lying massive marine mud (U2). The massive muds act as a gliding plane for the overunder-lying laminated sedi-ments. In other cases, the gliding plane is located within the laminated sequence of Unit 3. Similar types of sediments are observed in modern marine environments and also act as gliding planes [e.g., Baeten et al., 2014]. The abrupt change in sediment physical properties related to changes in sedimentation rates, compac-tion, source, and grain size between U2 and U3 and within U3 acts to reduce slope stability and favors the generation of slope failures. A thin waterfilm can develop along these weak layers, which increases instability during a destabilizing event [e.g., Cauchon-Voyer et al., 2008].
In short, the Holocene history of the region contributed to the development of late Holocene mass movements in East and West Lakes. Marine waters invaded the region depositingfine mud. Lacustrine sedi-ments that contrast sharply in terms of grain size and density with underlying marine mud favored slope instability.
5.2.3. Chronology of Mass Movements
MMDs are located almost exclusively within the laminated sediments (Unit 3), indicating that they were trig-gered during the late Holocene. Only one MMD is observed within Unit 2 and corresponds to an arcuate mound in the swath bathymetry imagery (Figures 3 and 14). This arcuate mound is thus the surface expres-sion of a buried MMD that was triggered during the early to middle Holocene in a glacimarine to marine setting. In general, lakes located within former glacial environments exhibit numerous MMDs dated to degla-cial times that are triggered in response to glacio-isostatic rebound [e.g., Beck, 2009; Desiage et al., 2015; Normandeau et al., 2013; Brooks, 2016]. The low abundance of MMDs during glacio-isostatic rebound in the Cape Bounty’s lakes is rather surprising but could be attributed to slow postglacial emergence in the region [Nixon et al., 2014] and to insufficient sedimentation rates in the lakes that prevented failure [e.g., Wilhelm et al., 2015]. Additionally, the massive muds are compact [Cuven et al., 2011] and do not show sharp internal sediment transitions that could act as weak layers. To produce failure, a strong shaking would have likely been needed in this case.
Within Unit 3, the MMDs are mainly located along two acoustic stratigraphic levels. In the deepest part of East Lake, the oldest MMDs are buried under approximately 1 m of laminated sediments, which according to pre-vious dating from sediment cores would correspond approximately to 1300 A.D. [Cuven et al., 2011; Lapointe et al., 2012]. However, in areas close to the shore, there appears to be more than one buried MMD, suggesting that there could be multiple events that occurred along the shores during that time.
The MMDs located in the upper acoustic sequence appear to have been triggered more recently. These events appear to be synchronous based on their stratigraphic position (Figures 12 and 13). Cores from each of the MMDs would be needed to constrain their ages. In the long sedimentary record from East Lake, Cuven et al. [2011] and Lapointe et al. [2012] did not report abnormally thick or coarse turbidites that could have been unequivocally linked to the distal turbidite of a MMD. Therefore, no age can be reported for these MMDs, but their location in the upper acoustic sequence nevertheless suggests a relatively young age.
5.2.4. Possible Triggers of Mass Movements
Several triggers are discussed in the literature for initiating mass movements. Among them, the most common are earthquakes [e.g., Strasser et al., 2006], sediment loading [Girardclos et al., 2007; Hughes Clarke et al., 2014], rapid water-level change [Mullins and Halfman, 2001], and cyclic loading by waves and tides [Xu et al., 2009]. The widespread distribution of the MMDs throughout both lakes indicates that high sedi-mentation rates and sediment loading associated with a prograding delta [Girardclos et al., 2007; Hughes Clarke et al., 2014] cannot be responsible for triggering them. Rapid water-level changes are also excluded since there is no indication that lake-level changed abruptly during the last millennium, during the initiation of most MMDs. On the contrary, according to Nixon et al. [2014], RSL has remained near its current position
Figure 14. The dynamic nature of East Lake in relation to the location of the core presented in previous studies [Cuven et al., 2011; Lapointe et al., 2012]. Note the different pathways of hyperpycnalflows triggered at the delta front and the presence of MMDs near the core location.
since 4 ka cal B.P., limiting the role of RSL change as a trigger. Cyclic loading by waves is also excluded since such small lakes cannot produce large waves capable of triggering MMDs. Assuming extreme wind speeds of 100 km/h and a maximum fetch of 2 km, the maximum wave heights would only be approximately 1 m high [Brestschneider, 1952].
In Arctic environments, another possible mechanism is related to permafrost thawing. One of the recent MMDs headscarp is located onshore (Figure 6a), above lake level, which suggest that terrestrial processes can be responsible for at least this one event. At Cape Bounty, active layer detachments are observed throughout the region and appear to be especially increased in the last decades due to climate warming [Rudy et al., 2013]. Permafrost thawing could thus have affected the shores of the lakes and potentially con-tributed to at least one of the MMDs in West Lake. Small debris avalanches located on the western shore of East Lake could also have been triggered by permafrost thawing. The headscarps of these MMDs are located less than 50 m from the shore at very shallow depth (less than 2 m). During the winter months, 2–2.5 m thick ice forms, which is likely in contact with the shallow nearshore depths of the lakes. This contact between lake ice and the nearshore could favor the formation of frozen ground which would thaw during the spring. The thawing could in turn produce small-debris avalanches. This hypothesis is speculative but would need to be explored in further studies.
The widespread distribution of MMDs in both lakes and their apparent synchronicity suggest that an exter-nal forcing mechanism acted on sediment remobilization. One of the oldest MMDs in East Lake (type 3) was triggered at a water depth of 20 m (Figure 7c). This mass movement would have needed a trigger such as seismic shaking to fail. The presence of the Gustaf-Lougheed Arch seismic zone (GLASZ; Figure 1), one of the most active seismic zone in the High Arctic located 150–200 km northeast of the lakes, makes that hypothesis plausible. During the last century, moderate to large earthquakes (M> 5) occurred in this zone northeast of Melville Island [Hasegawa, 1977]. Previous studies on lake sediments have suggested that a minimum intensity of VI–VII [e.g., Monecke et al., 2004] is required in order to trigger slope failures. Considering the distance of the lakes from the GLASZ, the earthquake magnitude would have needed to be higher than M7 [Bakun and Wentworth, 1997] to be responsible for the mass movements in the Cape Bounty lakes. No such high-magnitude earthquakes have been recorded in the GLASZ in the last century, but prior events are possible. However, other studies in marine environments have shown that smaller-magnitude earthquakes (M3 and M4) could also generate slope failures capable of breaking submarine cables [Pope et al., 2016]. Earthquakes are thus a reasonable hypothesis for the failure of some of the MMDs observed in the lakes. The earthquakes could have been generated in the GLASZ and have been very strong (M≥ 7) or could have been produced more locally and have had lower magnitudes. Earthquake shaking could have caused significant strength reduction in the laminated sediments and caused slipping of Unit 3 over Unit 2.
5.3. Lacustrine Sedimentary Processes and Accumulation
Sedimentary processes in both East and West Lakes have been studied in the past by direct observations using conductivity-temperature-depth casts, moorings, and sediment traps [Cockburn and Lamoureux, 2008a; Dugan et al., 2009]. In these studies, it was shown that the accumulation of sediments occurred over several days to a maximum of 2 weeks during spring snowmelt [Cockburn and Lamoureux, 2008a]. Sediment delivery is significantly reduced following this nival melt period. Therefore, short-lived hydrological events are mostly responsible for the sediment accumulation in the lakes. In general, high sediment accumulation ratios between the lower and upper traps as well as sudden changes in bottom water temperature suggest that hyperpycnalflows were responsible for sediment accumulation.
The morphology of the deltas in both lakes reflects the mechanisms of sediment transport. According to pre-vious monitoring studies, hyperpycnalflows occur quite frequently [Cockburn and Lamoureux, 2008a] at the river mouths, which is confirmed by the presence of gullies and bedforms on the delta slope. Known turbidite thickness in East Lake (millimeter scale) and the runoff of the river which attains peaks of 1–2 m3/s during snowmelt (peak discharge) also suggest that the hyperpycnalflows are rather dilute. These low-energy hyperpycnalflows are not erosive enough to produce large canyon-channel systems that can concentrate flows downslope [e.g., Kremer et al., 2015a, 2015b; Normandeau et al., 2016]. Instead, the flows being trig-gered at the delta front remain largely unconfined. Additionally, gullies with small levees are observed on the upper slopes, suggesting that they are depositional features rather than erosive ones.
Undulating bedforms as well as small scours are also observed on both deltas and confirm that hyperpycnal flows are present [e.g., Turmel et al., 2015]. The observed scours could be the product of small hydraulic jumps during the evolution of the hyperpycnalflows, indicating the occasional presence of stratified flows. The more symmetric bedforms would likely be linked to sediment waves consistent with more diluteflows. Because discharge from the river is low, it is more likely that sediment densityflows are rather dilute and of low density.
A particularity of East Lake is the presence of a large area with higher-intensity backscatter values directly at the mouth of the river. This high backscatter area is interpreted to be the result of relatively coarse par-ticles (i.e., coarse silt and sand) originating from hyperpycnalflows delivered from the East River [e.g., Hilbe et al., 2011]. This area is confined to the deepest part of the lake, indicating that it is generated by hyper-pycnal flows rather than overflows that would be dispersed throughout the lake and independent of bathymetry. Therefore, the backscatter intensity values indicate that hyperpycnalflows are indeed present at the mouth of the East River delta and that they control sediment dispersal within the lake. On the West Lake delta, stronger values are observed on the slope and the deep basin is interrupted by higher values related to MMDs. However, there is no clear relationship between backscatter intensities and hyperpycnal flow activity.
The presence of gullies, sediment waves, small scours, and higher backscatter values at the front of the deltas all indicate that hyperpycnalflows are predominant in the distribution of sediment in the deep basins of the lakes. The geomorphological analysis presented here is thus consistent with earlier process studies that showed that short-lived hydrological events are responsible for most of the sediment transport and accumu-lation [Cockburn and Lamoureux, 2008a].
5.4. Implications for Arctic Paleoenvironmental Reconstructions
Both lakes have rather simple bathymetries, where sediment accumulation is mostly concentrated at the front of the deltas and in the deeper waters. This type of sediment accumulation is believed to be ideal for sediment coring and paleoenvironmental reconstructions. In this respect, the core that was collected and analyzed in previous studies [Cuven et al., 2010, 2011; Lapointe et al., 2012] appears to have been collected in an ideal location, even though the knowledge of the spatial variability of sediment accumulation was limited at the time of core collection. There are a few points of concern, however, that arise from the geomor-phological and stratigraphic analysis presented in this study and that can be applied to other studies that deal only with the physical properties of sediment cores in High Arctic lakes.
First, the bathymetry of both lakes clearly shows the presence of gullies and bedforms at different locations, which indicate that hyperpycnalflows have different pathways down the delta slope (Figure 14). These different pathways necessarily impact the distribution of sediments in the deeper basin, which, in turn, surely has an impact on the grain-size distribution and thickness of sediment layers in the lake [e.g., Kremer et al., 2015a] and can affect a paleoclimatic reconstruction based on the latter parameters.
Second, both lakes reveal the widespread presence of MMDs that also have an impact on the distribution of sediment in the lakes. The identification of these layers will be important because they are linked to internal lake processes rather than climate variability. Again, a paleoclimate interpretation based on grain-size analy-sis or varve thickness can be altered by these events. Fortunately, these extreme events related to internal lake processes appear to be relatively infrequent in comparison to sediment transport from the rivers, the latter having a hydroclimatic significance. They should thus have a negligible impact on the previous overall climate interpretations.
The dynamic nature of the East and West Lakes are believed to be common in the High Arctic. Indeed, MMDs are widespread in numerous lakes around the world and are caused by various internal and external forcing mechanisms. The identification of these sedimentary processes in the High Arctic will be important in future studies dealing with paleoclimate since they can potentially alter climate reconstructions.
6. Conclusions
For thefirst time, a high-resolution geomorphological analysis of High Arctic lakes has been accomplished using swath bathymetry. The maps produced for High Arctic East and West Lakes (Cape Bounty, Melville Island) reveal the previously unknown morphological features and dynamic nature of these environments.
It was shown that more than 30% of the lake bottoms are affected by MMDs and that they were triggered during at least three different time intervals during the Holocene. Based on the locations of the MMDs and their apparent synchronous age, it is suggested that most of them were triggered by seismic activity. However, the presence of permafrost in the region could also have affected the generation of slope failures, especially along the steep slopes located near the shoreline.
Additionally, it was shown, solely based on a morphological analysis of the deltas, that sediment accumula-tion in the lakes is primarily controlled by relatively dilute hyperpycnalflows. These hyperpycnal flows are not consistently triggered at the same location on the delta, nor do they follow the same pathway every time they are triggered. This inconsistency in hyperpycnalflow pathways can have important implications on paleoclimatic interpretations that are based on grain-size analysis and varve thickness. Therefore, when bathymetric or subbottom investigations are not possible, collecting several cores at different locations is recommended and has previously shown valuable insights into paleoclimate reconstructions [Lamoureux, 1999; Jenny et al., 2014].
High-resolution morpho-stratigraphic analysis brings new insight into paleolimnological analysis of High Arctic lakes. It allows researchers to better understand the dynamic nature of Arctic lakes and to increase the reliability of paleoclimatic reconstructions. Therefore, the use of swath bathymetry and stratigraphic ana-lysis can help integrate process sedimentology to refine and certify the interpretation of paleoclimate studies. This type of morphostratigraphic analysis is shown to be possible, even in very remote regions, and provides valuable insight into the dynamic nature of High Arctic lakes.
References
Baeten, N. J., J. S. Laberg, M. Vanneste, C. F. Forsberg, T. J. Kvalstad, M. Forwick, T. O. Vorren, and H. Haflidason (2014), Origin of shallow submarine mass movements and their glide planes—Sedimentological and geotechnical analyses from the continental slope off northern Norway, J. Geophys. Res. Earth Surf., 119, 2335–2360, doi:10.1002/2013JF003068.
Bakun, W. H., and C. M. Wentworth (1997), Estimating earthquake location and magnitude from seismic intensity data, Bull. Seismol. Soc. Am., 87, 1502–1521.
Beck, C. (2009), Late Quaternary lacustrine paleo-seismic archives in north-western Alps: Examples of earthquake-origin assessment of sedimentary disturbances, Earth Sci. Rev., 96(4), 327–344.
Brestschneider, C. L. (1952), The generation and decay of wind waves in deep water, Eos Trans. AGU, 33(3), 381–389.
Brooks, G. R. (2016), Evidence of late glacial paleoseismicity from submarine landslide deposits within Lac Dasserat, northwestern Quebec, Canada, Quat. Res., doi:10.1016/j.yqres.2016.06.005.
Cauchon-Voyer, G., J. Locat, and G. St-Onge (2008), Late-Quaternary morpho-sedimentology and submarine mass movements of the Betsiamites area, Lower St. Lawrence Estuary, Quebec, Canada, Mar. Geol., 251(3–4), 233–252.
Charlet, F., M. Batist, E. Chapron, S. Bertrand, M. Pino, and R. Urrutia (2007), Seismic stratigraphy of Lago Puyehue (Chilean Lake District): New views on its deglacial and Holocene evolution, J. Paleolimnol., 39(2), 163–177.
Chutko, K. J., and S. F. Lamoureux (2008), Identification of coherent links between interannual sedimentary structures and daily meteorological observations in Arctic proglacial lacustrine varves: Potentials and limitations, Can. J. Earth Sci., 45(1), 1–13.
Cockburn, J. M. H., and S. F. Lamoureux (2008a), Inflow and lake controls on short-term mass accumulation and sedimentary particle size in a High Arctic lake: Implications for interpreting varved lacustrine sedimentary records, J. Paleolimnol., 40(3), 923–942.
Cockburn, J. M. H., and S. F. Lamoureux (2008b), Hydroclimate controls over seasonal sediment yield in two adjacent High Arctic watersheds, Hydrol. Processes, 22(12), 2013–2027.
Collier, J. S., and C. J. Brown (2005), Correlation of sidescan backscatter with grain-size distribution of surficial seabed sediments, Mar. Geol., 214, 431–449.
Cuven, S., P. Francus, and S. F. Lamoureux (2010), Estimation of grain size variability with micro X-rayfluorescence in laminated lacustrine sediments, Cape Bounty, Canadian High Arctic, J. Paleolimnol., 44(3), 803–817.
Cuven, S., P. Francus, and S. Lamoureux (2011), Mid to Late Holocene hydroclimatic and geochemical records from the varved sediments of East Lake, Cape Bounty, Canadian High Arctic, Quat. Sci. Rev., 30(19–20), 2651–2665.
Desiage, P.-A., P. Lajeunesse, G. St-Onge, A. Normandeau, G. Ledoux, H. Guyard, and R. Pienitz (2015), Deglacial and postglacial evolution of the Pingualuit Crater Lake basin, northern Québec (Canada), Geomorphology, 248, 327–343.
Dugan, H. A., S. F. Lamoureux, M. J. Lafrenière, and T. Lewis (2009), Hydrological and sediment yield response to summer rainfall in a small high Arctic watershed, Hydrol. Processes, 23(10), 1514–1526.
Dugan, H. A., S. F. Lamoureux, T. Lewis, and M. J. Lafrenière (2012), The impact of permafrost disturbances and sediment loading on the limnological characteristics of two high arctic lakes, Permafrost Periglac. Processes, 23(2), 119–126.
England, J. H., M. F. A. Furze, and J. P. Doupé (2009), Revision of the NW Laurentide Ice Sheet: Implications for paleoclimate, the northeast extremity of Beringia, and Arctic Ocean sedimentation, Quat. Sci. Rev., 28(17–18), 1573–1596.
Eyles, N., J. I. Boyce, and R. W. Barendregt (1999), Hummocky moraine: Sedimentary record of stagnant Laurentide Ice Sheet lobes resting on soft beds, Sediment. Geol., 123, 163–174.
Favaro, E. A., and S. F. Lamoureux (2014), Antecedent controls on rainfall runoff response and sediment transport in a High Arctic catchment, Geogr. Ann. Ser. A, Phys. Geogr., doi:10.1111/geoa.12063.
Gardner, J. V., L. Mayer, and J. Hughes Clarke (2000), Morphology and processes in Lake Tahoe (California-Nevada), Geol. Soc. Am. Bull., 112(5), 736–746.
Gilbert, R. (2003), Spatially irregular sedimentation in a small, morphologically complex lake: Implications for paleoenvioronmental studies, J. Paleolimnol., 29, 209–220.
Journal of Geophysical Research: Earth Surface
10.1002/2016JF003873
Acknowledgments
This work was supported by a postdoc-toral fellowship from the Fond de recherche du Québec–Nature et Technologies to A.N. and research grants from NSERC to S.F.L., P.L., and P.F. as well as CFI and Ministère de l’éducation du Québec instruments grants to P.L. Logistical support was provided by the Polar Continental Shelf Programme, Natural Resources Canada. Special thanks to B. Amann and F. Lapointe for their fruitful discussions and to K. Roberts, M. Gillman, S. Arruda, A. Rudy, and G. Joyal for theirfield assistance. The data for this paper are available by contacting the corre-sponding author.
Gilbert, R., and J. R. Desloges (2005), The record of Glacial Lake Champagne in Kusawa Lake, southwestern Yukon Territory, Can. J. Earth Sci., 42(12), 2127–2140.
Gilbert, R., D. L. Naldrett, and V. V. Horvath (1990), Holocene sedimentary environment of Cambridge Fjord, Baffin Island, Northwest Territories, Can. J. Earth Sci., 27, 271–280.
Gilbert, R., N. Nielsen, H. Moller, J. R. Desloges, and M. Rasch (2002), Glacimarine sedimentation in Kangerdluk (Disko Fjord), West Greenland, in response to a surging glacier, Mar. Geol., 191, 1–18.
Girardclos, S., O. T. Schmidt, M. Sturm, D. Ariztegui, A. Pugin, and F. S. Anselmetti (2007), The 1996 AD delta collapse and large turbidite in Lake Brienz, Mar. Geol., 241(1–4), 137–154.
Hasegawa, H. S. (1977), Focal parameters of four Sverdrup Basin, Arctic Canada, earthquakes in November and December of 1972, Can. J. Earth Sci., 14, 2481–2494.
Hilbe, M., and F. S. Anselmetti (2014), Signatures of slope failures and river-delta collapses in a perialpine lake (Lake Lucerne, Switzerland), Sedimentology, 61(7), 1883–1907.
Hilbe, M., F. S. Anselmetti, R. S. Eilertsen, L. Hansen, and W. Wildi (2011), Subaqueous morphology of Lake Lucerne (Central Switzerland): Implications for mass movements and glacial history, Swiss J. Geosci., 104(3), 425–443.
Hughes Clarke, J., C. R. Vidiera Marques, and D. Pratomo (2014), Imaging active mass-wasting and sedimentflows on a Fjord Delta, Squamish, British Columbia, in Submarine Mass Movements and Their Consequences, Advances in Natural and Technological Hazards Research, edited by S. Krastel et al., pp. 249–260, Springer, Cham, Switzerland.
Jenny, J. P., B. Wilhelm, F. Arnaud, P. Sabatier, C. Giguet Covex, A. Mélo, B. Fanget, E. Malet, E. Ployon, and M. E. Perga (2014), A 4D sedimentological approach to reconstructing theflood frequency and intensity of the Rhône River (Lake Bourget, NW European Alps), J. Paleolimnol., 51(4), 469–483.
Kämpf, L., P. Mueller, H. Höllerer, B. Plessen, R. Naumann, H. Thoss, A. Güntner, B. Merz, and A. Brauer (2015), Hydrological and sedimento-logical processes offlood layer formation in Lake Mondsee, The Depositional Record, 1(1), 18–37.
Kaufman, D. S., et al. (2009), Recent warming reverses long-term Arctic cooling, Science, 325, 1236–1239.
Kremer, K., M. Hilbe, G. Simpson, L. Decrouy, W. Wildi, and S. Girardclos (2015a), Reconstructing 4000 years of mass movement and tsunami history in a deep peri-Alpine lake (Lake Geneva, France-Switzerland), Sedimentology, 62(5), 1305–1327.
Kremer, K., J. P. Corella, M. Hilbe, F. Marillier, D. Dupuy, G. Zenhäusern, and S. Girardclos (2015b), Changes in distal sedimentation regime of the Rhone delta system controlled by subaquatic channels (Lake Geneva, Switzerland/France), Mar. Geol., 370, 125–135.
Lamoureux, S. (2000), Five centuries of interannual sediment yield and rainfall-induced erosion in the Canadian High Arctic recorded in lacustrine varves, Water Resour. Res., 36(1), 309–318, doi:10.1029/1999WR900271.
Lamoureux, S. F. (1999), Catchment and lake controls over the formation of varves in monomictic Nicolay Lake, Cornwall Island, Nunavut, Can. J. Earth Sci., 36, 1533–1546.
Lamoureux, S. F., and R. S. Bradley (1996), A late Holocene varved sediment record of environmental change from northern Ellesmere Island, Canada, J. Paleolimnol., 16, 239–255.
Lamoureux, S. F., and M. J. Lafrenière (2009), Fluvial impact of extensive active layer detachments, Cape Bounty, Melville Island, Canada, Arct. Antarct. Alp. Res., 41(1), 59–68.
Lamoureux, S. F., R. Gilbert, and T. Lewis (2002), Lacustrine sedimentary environments in High Arctic Proglacial Bear Lake, Devons Island, Nunavut, Canada, Arct. Antarct. Alp. Res., 34(2), 130–141.
Lamoureux, S. F., M. J. Lafrenière, and E. A. Favaro (2014), Erosion dynamics following localized permafrost slope disturbances, Geophys. Res. Lett., 41, 5499–5505, doi:10.1002/2014GL060677.
Lapointe, F., P. Francus, S. F. Lamoureux, M. Saïd, and S. Cuven (2012), 1750 years of large rainfall events inferred from particle size at East Lake, Cape Bounty, Melville Island, Canada, J. Paleolimnol., 48(1), 159–173.
Masson, D. G., C. B. Harbitz, R. B. Wynn, G. Pedersen, and F. Lovholt (2006), Submarine landslides: Processes, triggers and hazard prediction, Philos. Trans. Ser. A Math. Phys. Eng. Sci., 364(1845), 2009–2039.
McAdoo, B. G., L. F. Pratson, and D. L. Orange (2000), Submarine landslide geomorphology, US continental slope, Mar. Geol., 169, 103–136.
Melles, M., J. Brigham-Grette, O. Y. Glushkova, P. S. Minyuk, N. R. Nowaczyk, and H.-W. Hubberten (2006), Sedimentary geochemistry of core PG1351 from Lake El’gygytgyn—A sensitive record of climate variability in the East Siberian Arctic during the past three glacial– interglacial cycles, J. Paleolimnol., 37(1), 89–104.
Moernaut, J., and M. De Batist (2011), Frontal emplacement and mobility of sublacustrine landslides: Results from morphometric and seismostratigraphic analysis, Mar. Geol., 285(1–4), 29–45.
Monecke, K., F. S. Anselmetti, A. Becker, M. Sturm, and D. Giardini (2004), The record of historic earthquakes in lake sediments of Central Switzerland, Tectonophysics, 394, 21–40.
Moore, J. G., D. A. Clague, R. T. Holcomp, P. W. Lipman, W. R. Normark, and M. E. Torresan (1989), Prodigious submarine landslides on the Hawaiian Ridge, J. Geophys. Res., 94(17), 465–484, doi:10.1029/JB094iB12p17465.
Mulder, T., and P. Cochonat (1996), Classification of offshore mass movements, J. Sediment. Res., 66(1), 43–57.
Mullins, H. T., and J. D. Halfman (2001), High-resolution seismic reflection evidence for middle Holocene environmental change, Owasco Lake, New York, Quat. Res., 55(3), 322–331.
Nixon, F. C., J. H. England, P. Lajeunesse, and M. A. Hanson (2014), Deciphering patterns of postglacial sea level at the junction of the Laurentide and Innuitian Ice Sheets, western Canadian High Arctic, Quat. Sci. Rev., 91, 165–183.
Normandeau, A., P. Lajeunesse, and G. Philibert (2013), Late-Quaternary morphostratigraphy of Lake St-Joseph (southeastern Canadian Shield): Evolution from a semi-enclosed glacimarine basin to a postglacial lake, Sediment. Geol., 295, 38–52.
Normandeau, A., G. Joyal, P. Lajeunesse, P. Francus, S. Lamoureux, and F. Lapointe (2016), Late-Holocene mass movements in High Arctic East Lake, Melville Island (Western Canadian Arctic Archipelago), in Submarine Mass Movements and Their Consequences, edited by G. Lamarche et al., pp. 311–320, Springer, Cham, Switzerland.
Normandeau, A., P. Lajeunesse, A. G. Poiré, and P. Francus (2016), Morphological expression of bedforms formed by supercritical sediment densityflows on four fjord-lake deltas of the south-eastern Canadian Shield (eastern Canada), Sedimentology, doi:10.1111/sed.12298. Nutz, A., J.-F. Ghienne, M. Schuster, R. Certain, N. Robin, C. Roquin, O. Raynal, F. Bouchette, P. Duringer, and P. A. Cousineau (2013),
Seismic-stratigraphic record of a deglaciation sequence: From the marine Laflamme Gulf to Lake Saint-Jean (late Quaternary, Québec, Canada), Boreas, 43(2), 309–329.
Overpeck, J., et al. (1997), Arctic environmental change of the last four centuries, Science, 278(5341), 1251–1256.
Pope, E. L., P. J. Talling, and L. Carter (2016), Which earthquakes trigger submarine mass movements: Insights from a global record of submarine cable breaks?, Mar. Geol., doi:10.1016/j.margeo.2016.01.009.
Praeg, D., B. d’Anglejan, and J. P. M. Syvitski (1992), Seismostratigraphy of the Middle St. Lawrence Estuary: A late Quaternary glacial marine to estuarine depositional/erosional record, Géogr. Phys. Quat., 46(2), 133.
Rudy, A. C. A., S. F. Lamoureux, P. Treitz, and A. Collingwood (2013), Identifying permafrost slope disturbance using multi-temporal optical satellite images and change detection techniques, Cold Reg. Sci. Technol., 88, 37–49.
Sappington, J. M., K. M. Longshore, and D. B. Thompson (2007), Quantifying landscape ruggedness for animal habitat analysis: A case study using bighorn sheep in the Mojave desert, J. Wildlife Manage., 71(5), 1419–1426.
Schnellmann, M., F. S. Anselmetti, D. Giardini, and J. A. McKenzie (2005), Mass movement-induced fold-and-thrust belt structures in unconsolidated sediments in Lake Lucerne (Switzerland), Sedimentology, 52(2), 271–289.
Schnellmann, M., F. S. Anselmetti, D. Giardini, and J. A. McKenzie (2007), 15,000 years of mass-movement history in Lake Lucerne: Implications for seismic and tsunami hazards, Eclogae Geol. Helv., 99(3), 409–428.
Strasser, M., F. S. Anselmetti, D. Fäh, D. Giardini, and M. Schnellmann (2006), Magnitudes and source areas of large prehistoric northern Alpine earthquakes revealed by slope failures in lakes, Geology, 34(12), 1005.
Turmel, D., J. Locat, and G. Parker (2015), Morphological evolution of a well-constrained, subaerial-subaqueous source to sink system: Wabush Lake, Sedimentology, 62(6), 1636–1664.
Wilhelm, B., et al. (2015), Quantified sensitivity of small lake sediments to record historic earthquakes: Implications for paleoseismology, J. Geophys. Res. Earth Surf., 121, 2–16, doi:10.1002/2015JF003644.
Xu, G., Y. Sun, X. Wang, G. Hu, and Y. Song (2009), Wave-induced shallow slides and their features on the subaqueous Yellow River delta, Can. Geotech. J., 46(12), 1406–1417.