10519
Journal of Applied Biosciences 108: 10519-10530
ISSN 1997-5902
The spatial distribution of coastal fish assemblage in
Côte d’Ivoire’s Exclusive Economic Zone (EEZ), West
Africa.
Soumaïla SYLLA1*, Kouadio Fréderic KOUAKOU1, Christian Bernard TIA1,2, Stanislas Silvain Yao2
&Boua Célestin ATSE 1
1 Centre de Recherches Océanologiques (CRO), B.P.V 18 Abidjan, Côte d’Ivoire, Fax (225) 21 35 11 55 2 UFR Biosciences, Université Félix Houphouët Boigny Abidjan, 22 B.P. 582 Abidjan 2, Côte d’Ivoire
(*) Corresponding Author, Tel (225) 21 35 58 80, Fax (225) 21 35 11 55, E-mail: soumaila.sylla@cro-ci.org
Original submitted in on 7th October 2016. Published online at www.m.elewa.org on 31st December 2016 http://dx.doi.org/10.4314/jab.v108i1.5
ABSTRACT
Objectives: The interest of this study is double. Firstly, these results allow for the characterisation of species assemblages, to identify their spatial distribution boundaries. Secondly, these findings are relevant to define spatial or ecosystem units in order to provide background for fisheries management.
Methodology and Results: Samples were collected and studied at a grid of three zones during the cruise of investigation on board the Oceanographic Vessel ITAF DEME in March 2012. Forty- seven taxa belonging to four orders (Cephalopoda, Malacostraca, Chondrichtyes and Osteichtyes) were selected for analysis. Spatial differences in fish structure were analysed through different multivariate routines from PRIMER including between-matrix analysis of similarities (ANOSIM), species contributions to similarity/dissimilarity (SIMPER), non-metric multidimensional scaling (MDS) and group average cluster analysis. Typical or abundant species from those zones included fishes from the families Sparidae, Haemulidae, Carangidae. The most abundant species were Ariomma bondi (Ariommidae), Selene dorsalis (Carangidae), Brachydeuterus auritus and Pomadasys incisus (Haemulidae), Pagellus bellottii (Sparidae). The species Sardinella maderensis, Brachydeuterus auritus, Trachurus trecae and Selene dorsalis had the highest frequencies of occurrence. Conclusion and application: The distribution of the species halieutics is not uniform along the coast of Côte d’Ivoire. This study pointed to the fish resources of Côte d’Ivoire’s Exclusive Economic Zone. These results will be used by the fishermen and for the development of adequate measures to prevent the loss of aquatic biodiversity.
Key words: Biodiversity, Indices of diversity, Coastal zone, Côte d’Ivoire. INTRODUCTION
In many parts of the world, fish stocks are currently overexploited or have not been adequately managed. As a result, catches are declining. An essential component of successful fisheries
management is an ongoing assessment program to monitor the condition of the fish stock in the context of the aquatic ecosystem and the fishing activities that sustain the fishing community. The fishing
10520
resources in tropical coastal areas such as in the Gulf of Guinea consist of highly diverse, multi-species complexes (Longhurst & Pauly, 1987). These fisheries cannot be managed on the assumption they target single species. Therefore, managing the fisheries requires an understanding of the biological assemblage structure. An assemblage is operationally defined as the species available in the same place at the same time (Fauth et al., 1996). The fisheries have traditionally represented an important socio-economic activity for the coastal population of Côte d’Ivoire. Species catches vary greatly in space and time in association with the highly diverse environmental traits encountered in the shelf. With over ten million inhabitants in Côte d’Ivoire, the demands for fish resources are intense, and exploitation of coastal resources is often poorly regulated due to lack of resources for management. In fact, in like many African countries, where the economy is strongly dependent upon biological resources, the exploitation of natural resources and
their conservation are ambiguous (Kamdem Toham & Teugels,1999).The conservation of resources and development of countries are mutually dependent. Indeed, unless living resources and particular aquatic ones are used and managed rationally, natural production faces the risk of collapse (Yapi-Gnaoré et al., 2000). To ensure a sound management and sustainable exploitation of marine biodiversity, it is vital to develop a deeper understanding of the factors and processes that determine aquatic diversity at different spatial scales (Ibanez et al., 2007).
Several studies concerning the structure of species assemblages have been made in Gulf of Guinea (Bianchi, 1992). However, very few studies bring to light the distribution of spatial structure of coastal assemblages of Côte d’Ivoire. This paper deals with the species composition, community structure, and species diversity of coastal assemblage in Côte d’Ivoire coastal zone.
MATERIAL AND METHODS
Study area: Located in the Gulf of Guinea, with an area of 322 465 km², Cote d’Ivoire (4°30’ and 10°30’N and 2°30’ and 8°30’W) is bounded by the Atlantic Ocean in the south. The Ivorian oceanic zone is bordered to the north by the Gulf of Guinea shoreline stretching from the Cape of Palmes (7°30 W) and the Cape of Three Points (2°W). The shoreline is 566 km long and is characterised by a series of sandy beaches forming a wide arch opened to the Atlantic Ocean. Several lagoons (submersed fluvial basins) are separated from the sea by a littoral bar, formed and maintained by waves and currents. At the southern border of the oceanic area, a continental slope delimits a narrow continental shelf with a width of 25-30 km and a surface area of about 16,000 km2. The
continental slope is generally smooth but it starts sharply increasing at 120 to 150 m depth (Martin, 1973). A major
morphological feature, the Trou Sans Fond canyon, cuts the continental shelf in front of Abidjan. Depths over 1000 m are rapidly reached at few kilometres offshore. The study area covered the entire continental shelf of Cote d’Ivoire. This area was divided into three zones from the West to the East. The western half of the Cote d’Ivoire shelf, from Grand Beréby (R1) to Sassandra (R6) is irregular structure (zone 1) which is characterised by a more complex structure, where metamorphic basement reaches the sea. Rocky capes with low cliffs alternate with sandy bays. Between Sassandra (R7) and Abidjan (R11), the coastline is more than to the West (zone 2). At East, from Abidjan (R12) after canyon to Asinine (R14), the coastline is relatively flat with sandy and monotonous structures of sedimentary origin (Quaternary): zone 3 (Fig 1).
10521
Fig.1. Map of the investigated area showing the position of trawl stations Sampling Protocol : Data were collected during a
scientific trawl survey carried out in March 2002. Sampling collections covered 14 transects lines along the entire continental shelf of Cote d’Ivoire. All stations were sampled during daytime as nighttime. A total of 43 stations were sampled in the course of the above survey by the Oceanographic Vessel «ITAF DEME". The vessel was equipped with a trawl of 40 mm stretched mesh size at the cod-end. The ship were equipped with two trawls including one pelagic and a demersal enabling him to be operational in the various fishing zones of day like night (coast, broad and melts). It carries out a prospection with radials perpendiculars at the coast and separated by 20 miles taken of the isobaths from 20 to 200 m. Each haul lasted 30 min at an average speed of 3 kn. A final number of 11 hauls was available. At each haul, individuals belonging to four selected classes (Cephalopoda, Malacostraca, Osteichthyes and Chondrichthyes) were identified to species level, weighed to the nearest gram, measured to the lowest centimetre or millimetre (total length, mantle length or carapace length depending on the group) and counted onboard. Fishes were identified individually using taxonomic keys and guides as follows: Fischer et al., 1981; Schneider, 1990 and Edwards et al., 2001.
Data analysis: The fish assemblage was described through taxonomic composition, spatial richness, and frequency of occurrence (FO). Frequency of occurrence is the percentage of samples in which each taxon occurred. (Gbenyedji et al., 2011). For each species, numerical abundance (hereforth called abundance) and biomass of the different taxa were standardised to individuals or kg h -1. The species diversity, dominance, evenness and
species richness index of each station were calculated respectively using the Shannon-Wiener index (H'), Simpson index ( , Pielou index (J’) and Margalef index (d) as follows:
10522 Where S is the number of species at each station, N is the total number of individuals, and ni is the number of
individuals of the i theoretical species (i from 1 to S). K-dominance curves were plotted for the comparison of species composition at zone using Primer E v 5. Hierarchical cluster analysis and non-metric multidimensional scaling (nMDS), based on Bray–Curtis similarity were used for classification and ordination of trawl stations (Clarke & Warwick, 1994). nMDS preserves the rank order of the inter-samples distance, as opposed
to the linear relationship of classical metric scaling (i.e. principal component analysis, correspondence analysis). nMDS has the advantage of robustness being not sensitive to outliers (e.g. occurrence of one individual of large biomass in a site) and it has been widely used in the past to analyse demersal assemblages (Clark et al., 1996). Zone was examined with the Similarity Percentage (SIMPER) procedure to identify within-zones sample similarity and the species numerically responsible for zone identity. Dominating species defined by SIMPER are those with the highest contribution to the average similarity within particular zones.
RESULTS
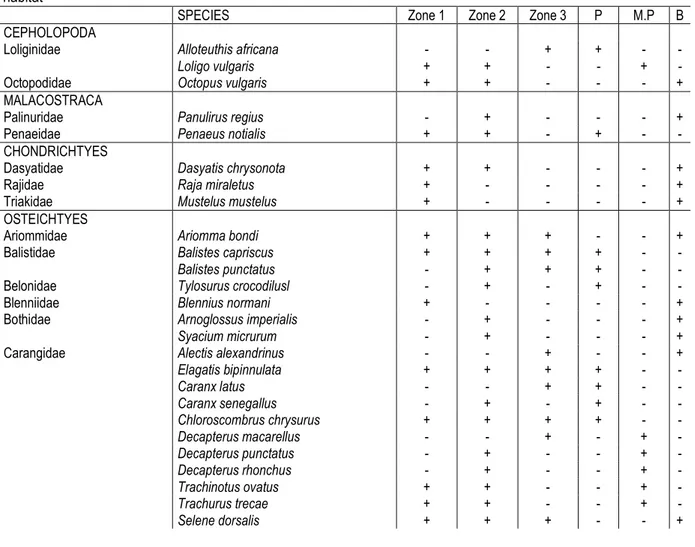
Composition of halieutics resources: The composition of halieutics resources collected during this study is shown (Table 1). A total of 80 species belonging to 47 families were captured from the various samples. Most of these species were within the Benthic and pelagic
habitats, represented by 52.56% and 35.89% species, respectively. On the other hand, the number of species belonging to Chondrichthyes, Cephalopoda, Malacostraca, was low represented by only 3, 3 and 2 species, respectively (Table 1).
Table 1: Space variation of the species halieutics of the Exclusive Economic Zone of the Côte d'Ivoire following their habitat
SPECIES Zone 1 Zone 2 Zone 3 P M.P B
CEPHOLOPODA
Loliginidae Alloteuthis africana - - + + - -
Loligo vulgaris + + - - + -
Octopodidae Octopus vulgaris + + - - - +
MALACOSTRACA
Palinuridae Panulirus regius - + - - - +
Penaeidae Penaeus notialis + + - + - -
CHONDRICHTYES
Dasyatidae Dasyatis chrysonota + + - - - +
Rajidae Raja miraletus + - - - - +
Triakidae Mustelus mustelus + - - - - +
OSTEICHTYES
Ariommidae Ariomma bondi + + + - - +
Balistidae Balistes capriscus + + + + - -
Balistes punctatus - + + + - -
Belonidae Tylosurus crocodilusl - + - + - -
Blenniidae Blennius normani + - - - - +
Bothidae Arnoglossus imperialis - + - - - +
Syacium micrurum - + - - - +
Carangidae Alectis alexandrinus - - + - - +
Elagatis bipinnulata + + + + - - Caranx latus - - + + - - Caranx senegallus - + - + - - Chloroscombrus chrysurus + + + + - - Decapterus macarellus - - + - + - Decapterus punctatus - + - - + - Decapterus rhonchus - + - - + - Trachinotus ovatus + + - - + - Trachurus trecae + + - - + - Selene dorsalis + + + - - +
10523
Clupeidae Sardinella aurita + + + + - -
Sardinella maderensis + + + + - -
Ethmalosa fimbriata - - + + - -
Congridae Paraconger notialis - + - - - +
Cynoglossidae Cynoglossus senegalensis + + + + - -
Dactylopteridae Dactylopterus volitans + + - - - +
Drepanidae Drepane africana - - + - - +
Echeneidae Remora remora - + - + - -
Elopidae Elops lacerta - - + + - -
Engrauliadae Engraulis encrasicolus - - + + - -
Exocoetidae Exocoetus volitans - - + + - -
Fistulariidae Fistularia tabacaria + + - - - +
Haemulidae Bracchydeuterus auritus + + + - + -
Pomadasys incisus + + - - - +
Pomadasys jubelini - + - - - +
Pomadasys peroteti - + - - - +
Labridae Bodianus speciosus - + - + - -
Lutjanidae Lutjanus fulgens - + - - - +
Monacanthidae Aluterus punctata - + - - - +
Stephanolepis hispidus - + - - - +
Mulidae Pseudupeneus prayensis + + - - - +
Paralichthyidae Dorsopsetta norma - + + - - +
Platycephalidae Grammoplites gruveli + + - - - +
Polynemidae Galeoides decadactylus + + + ² - -
Polydactylus quadrifilis - - + - - +
Priacanthidae Priacanthus arenatus + + - + - -
Pristigasteridae Ilisha africana + + + + - -
Sciaenidae Pseudotolithus brachygnathus - - - - +
Pseudotolithus senegalensis - + - - - +
Pseudotolithus typus - - + - - +
Ptseroscion peli + + + - - +
Umbrina canariensis + + - - - +
Scombridae Euthynnus alletteratus - + - + - -
Sepiidae Sepia officinalis hierredda + - - - - +
Sepia sp - - + - - +
Serranidae Epinephelus aeneus - + - + - -
Serranus accraensis + - - - - +
Sparidae Boops boops + + - - - +
Dentex canariensis + + - - - +
Dentex gibbosu - + - - - +
Pagellus bellottii + + - - - +
Pagrus caeruleostictus + + - - - +
Sphyraenidae Sphyraena afra + - - + - -
Sphyraena guachancho - + + + - -
Sphyraena sphyraena + - - + - -
Stromateidae Stromateus fiatola + + - - + -
Synodontidae Saurida brasiliensis - + + - - +
Tetraodontidae Ephippion guttifer - - + - - +
Lagocephalus laevigatus + + - + - -
Trachinidae Trachinus draco - + - + - -
Trichiuridae Trichiurus lepturus + + + - + -
Triglidae Chelidonichthys gabonensis + - - - - +
Zeidae Zeus faber + + - + - -
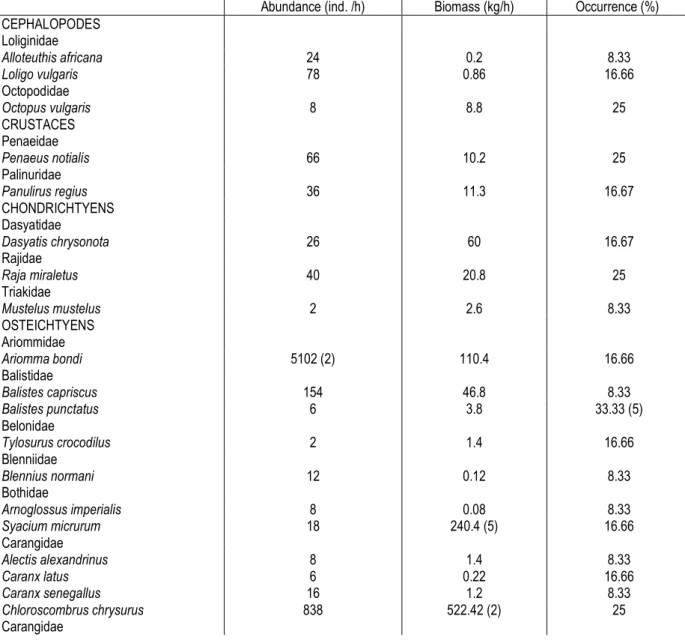
10524 Numerical abundance, biomass, diversity and number of species (global values): A total number of 48146 individuals of the considered species were captured, weighting 3589.77 kg. The five most Numerical abundance species were Brachydeuterus auritus (Haemulidae), Ariomma bondi (Ariommidae), Pagellus bellottii (Sparidae), Pomadasys incisus (Haemulidae), and Selene dorsalis (Carangidae), all constituting 75% of the numerical abundance of the 47 taxa (Table 1). The most abundant species was Brachydeuterus auritus which also ranked first in terms of biomass (24% of the biomass of the selected species) followed by Pagellus bellottii (12%). Some not very abundant taxa contributed significantly to
the pooled biomass, mainly fish species like Chloroscombrus chrysurus (Carangidae) and Syacium micrurum (Bothidae) representing 22 % of the biomass. Occurrence revealed that Sardinella maderensis (58, 33 %) was the most frequent followed by Brachydeuterus auritus, Trachurus trecae and Selene dorsalis 50 % for each one species (Table 2). However, some of these species showed low values of numerical abundance (e.g. Caranx latus; Decapterus macarellus; Pseudupeneus prayensis; Lagocephalus laevigatus; Sardinella maderensis; Trachurus trecae ; Trichiurus lepturus) but have important percentage of occurrence (table 2).
Table 2: Standardised average abundance, biomass and constancy of the 47 taxa analysed, with indication (in brackets, decreasing order) of the 5 most important species for each variable
Abundance (ind. /h) Biomass (kg/h) Occurrence (%) CEPHALOPODES Loliginidae Alloteuthis africana 24 0.2 8.33 Loligo vulgaris 78 0.86 16.66 Octopodidae Octopus vulgaris 8 8.8 25 CRUSTACES Penaeidae Penaeus notialis 66 10.2 25 Palinuridae Panulirus regius 36 11.3 16.67 CHONDRICHTYENS Dasyatidae Dasyatis chrysonota 26 60 16.67 Rajidae Raja miraletus 40 20.8 25 Triakidae Mustelus mustelus 2 2.6 8.33 OSTEICHTYENS Ariommidae Ariomma bondi 5102 (2) 110.4 16.66 Balistidae Balistes capriscus 154 46.8 8.33 Balistes punctatus 6 3.8 33.33 (5) Belonidae Tylosurus crocodilus 2 1.4 16.66 Blenniidae Blennius normani 12 0.12 8.33 Bothidae Arnoglossus imperialis 8 0.08 8.33 Syacium micrurum 18 240.4 (5) 16.66 Carangidae Alectis alexandrinus 8 1.4 8.33 Caranx latus 6 0.22 16.66 Caranx senegallus 16 1.2 8.33 Chloroscombrus chrysurus 838 522.42 (2) 25 Carangidae
10525 Decapterus macarellus 18 1.2 16.66 Decapterus punctatus 56 4 8.33 Decapterus rhonchus 98 16.9 25 Elagatis bipinnulata 2 0.1 8.33 Selene dorsalis 2274 (5) 95 50 (2) Trachinotus ovatus 32 11.6 8.33 Trachurus trecae 448 24.1 50 (2) Clupeidae Ethmalosa fimbriata 16 1.6 8.33 Sardinella aurita 170 2.14 25 Sardinella maderensis 856 26.1 58.33 (1) Congridae Paraconger notialis 2 1.3 8.33 Cynoglossidae Cynoglossus senegalensis 10 1 25 Dactylopteridae Dactylopterus volitans 212 55.41 25 Drepaneidae Drepane africana 62 5.6 8.33 Echeneididae Remora remora 16 1.2 8.33 Elopidae Elops lacerta 2 0.8 8.33 Engraulidae Engraulis encrasicolus 1800 6 8.33 Exocoetidae Exocoetus volitans 2 0.1 8.33 Fistulariidae Fistularia tabacaria 312 15.8 25 Gerreidae Eucinostomus melanopterus 2 0.04 8.33 Haemulidae Brachydeuterus auritus 19536 (1) 863.06 (1) 50 (2) Pomadasys incisus 4340 (4) 429.26 (3) 33.33 (5) Pomadasys jubelini 68 44.4 8.33 Pomadasys peroteti 22 12.6 16.66 Labridae Bodianus speciosus 2 1.4 8.33 Lutjanidae Lutjanus fulgens 240 40 8.33 Monacanthidae Aluterus punctata 6 3.2 8.33 Stephanolepis hispidus 40 7 25 Pseudupeneus prayensis 1580 95.8 41.67 (4) Paralichthyidae Dorsopsetta norma 8 0.6 8.33 Platycephalidae Grammoplites gruveli 38 1.16 25 Polynemidae Galeoides decadactylus 244 21.6 25 Polydactylus quadrifilis 2 18 8.33 Priacanthidae Priacanthus arenatus 1800 69.4 25 Pristigasteridae Ilisha africana 314 14.3 25 Rajidae
10526 Raja miraletus 40 20.8 25 Sciaenidae Pseudotolithus brachygnathus 74 26.4 16.66 Pseudotolithus senegalensis 2 0.6 8.33 Pseudotolithus typus 22 2 8.33 Pteroscion peli 254 20.7 25 Umbrina canariensis 216 81.6 16.66 Scombridae Euthynnus alletteratus 84 11.6 8.33 Sepiidae
Sepia officinalis hierredda 20 17 25
Sepia sp 38 0.4 8.33
Serranidae
Epinephelus aeneus 34 3.8 8.33
Serranus accraensis 16 0.16 8.33
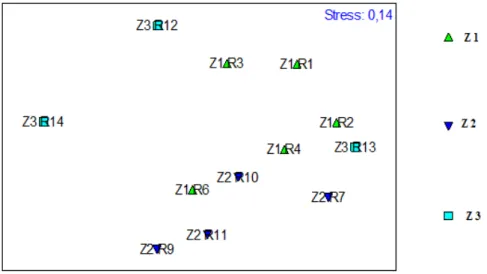
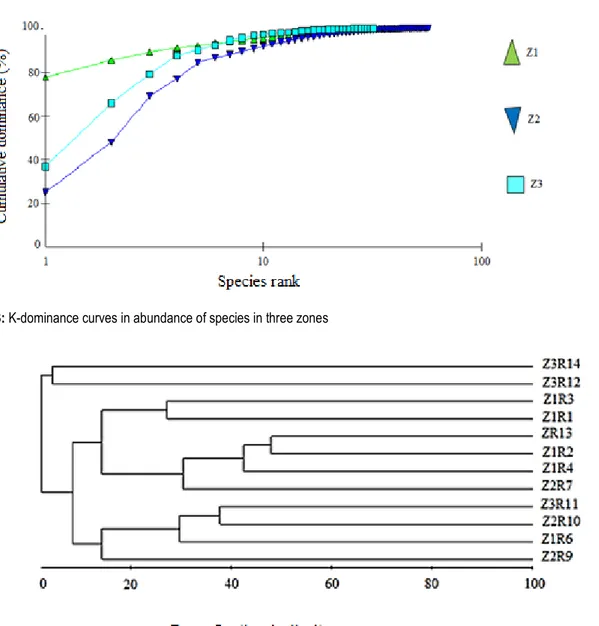
The highest value of species diversity index (H') was 3.15 at Zone 2 but the lowest value of species diversity index (H') was 1.55 at Zone 1(Table 3). The highest value of Simpson index (λ), Pielou index (J’) and Margalef index (d) of this station were 5.64 (Zone 2), 0.54 (Zone 2) and 0.61 (Zone1), respectively. By hierarchical clustering from Bray-Curtis similarities based on the species abundance between each site, relationships of 12 sites were shown (Fig 2). The K-dominance curves of the three
zones were given in Fig.3. Apparently, there were different species communities at these three zones. The dominance curve of zone 1 located above other curves, indicating the highest dominance and the lowest diversity. Conversely, the dominance of Zone 2 was the lowest, and the diversity was the highest. The Bray–Curtis cluster based on the abundance of the species and the zone of sampling revealed any groups at the level of 50% similarity (Fig 4).
Fig 2: nMDS based on species abundance
Table 3: Species diversity index, dominance index, evenness index and abundance index
S N d J’ H’ λ
Zone 1 41 21552 4.01 0.29 1.55 0.61
Zone 2 57 20374 5.64 0.54 3.15 0.17
10527 Fig. 3: K-dominance curves in abundance of species in three zones
Z: zone
Fig 4 : Bray–Curtis cluster of species distribution
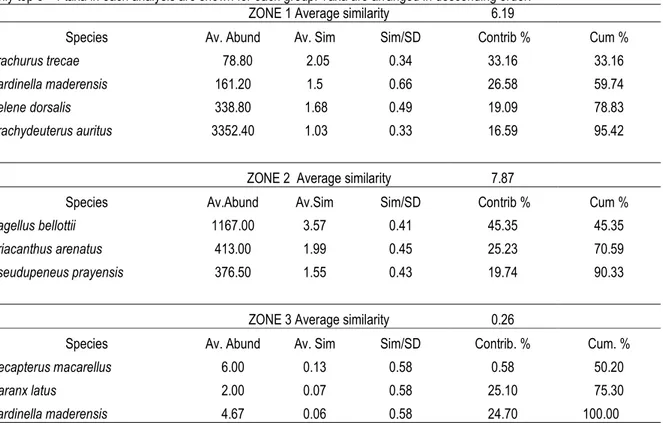
The result of SIMPER analysis indicated that only four species (zone 1) or three species (zones 2 and 3) contributing moreover 90.33 % of the average similarity. The Zone I was dominated by Trachurus trecae, Sardinella maderensis, Selene dorsalis and Brachydeuterus auritus, together contributing to 95.42 % of the average similarity. All samples collected between
Sassandra to Abidjan (zone 2), Pagellus bellottii and Priacanthus arenatus were the key species here, contributing 70.59% to the average similarity of 90.33 within this zone. SIMPER analysis indicated also that zone 3 was dominated by Decapterus macarellus, Caranx latus and Sardinella maderensis, together contributing to 100% of the average similarity (table 4)
10528
Table 4: Results of SIMPER for coastal fish assemblages in Côte d’Ivoire’s EE Z
Only top 3 - 4 taxa in each analysis are shown for each group. Taxa are arranged in descending order.
ZONE 1 Average similarity 6.19
Species Av. Abund Av. Sim Sim/SD Contrib % Cum %
Trachurus trecae 78.80 2.05 0.34 33.16 33.16
Sardinella maderensis 161.20 1.5 0.66 26.58 59.74
Selene dorsalis 338.80 1.68 0.49 19.09 78.83
Brachydeuterus auritus 3352.40 1.03 0.33 16.59 95.42
ZONE 2 Average similarity 7.87
Species Av.Abund Av.Sim Sim/SD Contrib % Cum %
Pagellus bellottii 1167.00 3.57 0.41 45.35 45.35
Priacanthus arenatus 413.00 1.99 0.45 25.23 70.59
Pseudupeneus prayensis 376.50 1.55 0.43 19.74 90.33
ZONE 3 Average similarity 0.26
Species Av. Abund Av. Sim Sim/SD Contrib. % Cum. %
Decapterus macarellus 6.00 0.13 0.58 0.58 50.20
Caranx latus 2.00 0.07 0.58 25.10 75.30
Sardinella maderensis 4.67 0.06 0.58 24.70 100.00
For each zone: Av.Abund = Average abundance; Av. Sim = Average similarity; Sim/SD= standard deviation of similarity; Contrib. % = percentage of contribution explained by each species; Cum. %= a cumulative percentage of contribution explained by each species.
DISCUSSION
The previous studies based on the data collected through the survey of R/V « Dr. Fridtjof Nansen » (MehL et al., 2006) in the Gulf of Guinea reported that more than 100 species have been sampled in Côte d’Ivoire ‘s Exclusive Economic Zone (EEZ). This work indicated 80 species. This difference could be related to the sampling season of survey (March). Besides, the smaller number by the Trawling Survey of this study was an important reason, too. The weak representation of the cephalopods and crustaceans in the capture could be due probably to fishing gear, the season of fishing and the period. Indeed, Troadec (1968) reported the fish trawl was not adapted for the capture of cephalopods and crustaceans. The high abundance and percentage of occurrence of Brachydeuterus auritus, Pomadasys incisus, Pagellus bellottii and Selene dorsalis noted are in agreement with the observations made by Caverivière (1993) and Mehl et al., (2006). He has revealed that Gulf of Guinea, Côte d’Ivoire’s EEZ in particular, is a suitable habitat for development of these species.
The higher occurrence rate of species like Sardinella maderensis, Brachydeuterus auritus, Trachurus trecae
and Selene dorsalis suggest their wide distribution in Côte d’Ivoire‘s ZEE. This aspect is probably linked to their particular life cycle. For Cury & Fontana (1988), the factor, which governs these variations, concerns the demographic strategy of these species.
There are many factors to affect the species distribution. Species richness and diversity changed from zone 1 (Grand- Bereby to Sassandra) to zone 3 (between Abidjan and Assinie) according to table 1. The fluctuations of the specific richness, from one zone to another would be due to the presence of coastal lagoon systems of Côte d’Ivoire coastline. In fact, Kouassi (2005) observed that coastal lagoon is the siege of complex phenomena related to the exchanges between fresh and marine waters. Ebrie and Grand-Lahou Lagoons, which situated in zone 2, bring many nutriments to Ivorian coast. They contribute to the high level of biodiversity. According to Que´ro & Vayne (1993), species use estuaries and adjacent coastal areas as developing zones. These various ecosystems would be better suited for using additional food resources and hence optimizing the energy costs of the reproduction (Albaret & Legendre,
10529 1985). With regard to the results of diversity index values at those zones, it has been revealed the existence of relatively heterogeneous fish assemblages covering broad areas of continental shelves and slopes in Côte d’Ivoire’s ZEE. According to cluster analysis of species composition for different zones, any groups were arbitrarily divided at 50 % similarity. It suggests, they were not common dominant species among zones.
The weakness of the percentage of similarity of Bray Curtis reflects the specific variability of each zone. ¶This percentage is related to the numerical abundance of the species (Field et al., 1982). The small number (four to the maximum) observed in each zone compared with the eighty (80) inventoried species could justify this fact. Sardinella maderensis appear to be one of mainly species caught off the coast of Côte d’Ivoire. Indeed, Boely et al., (1982) observed that Sardinella is one of pelagic fish, which is the most common of the West African continental shelf. The segregation of the species according to their contribution cumulative in each zone gives precise information on the specific distribution. Indeed, pronounced differences were also evident in the open
coastal assemblages from west (Grand - Beréby) to south (Assinie). The western open coast assemblage was dominated by a variety of pelagic species (Trachurus trecae, Sardinella maderensis, Selene dorsalis and Brachydeuterus auritus) in comparison with the centre (between Sassandra and Abidjan), which was dominated by benthic species (Pagellus bellottii and Priacanthus arenatus) and the eastern ( from Abidjan to Assinie) was also dominated by Decapterus macarellus, Caranx latus and Sardinella maderensis. According to numerical abundance and the percentages of occurrence, it should be established a classification of the species halieutics of Côte d’Ivoire’s EEZ. This classification is as follows:¶(1) species with wide areas and abundant distribution consisted of Brachydeuterus auritus and Selene dorsalis;¶(2) species with wide area distribution and few abundant including Sardinella maderensis and Trachurus trecae;¶(3) species with narrow area distribution and few abundant that are Pseudupeneus prayensis, Priacanthus arenatus and Caranx latus and finally the species rare are compounded of leftovers caught.
CONCLUSION
It appears that the distribution of the species halieutics according to the cutting of the ZEE in zones revealed that the distribution of the species halieutics is not uniform along the coast of Côte d’Ivoire. In Zone 1, from Tabou to Sassandra is dominated in abundance by Carangidae (Trachurus trecae and Selene dorsalis), Clupeidae (Sardinella maderensis) and Haemulidae (Brachydeuterus auritus). Zone 2 from Sassandra to Abidjan before the cayon “trou-sans fond” is dominated by
Sparidae (Pagellus bellottii), Priacanthidae (Priacanthus arenatus).¶ Zone 3 covering the remainder of Côte d’Ivoire is dominated by Carangidae (Decapterus macarellus and Caranx latus) and Clupeidae (Sardinella maderensis).¶ The competent authority should establish a list of the fishing area in link with the species and time fishing that should be used on fishing vessels; such list should include biodiversity's protection.
ACKNOWLEDGEMENTS
The authors express their gratitude to the participants of the surveys, and to the crew of the Oceanographic Vessel ITAF DEME for their help. Special thanks also go to Dr. Sylla Soumaïla, Diaha N’guessan Constance and Joanny Tapé G. for providing oceanographic data, to Dr. Yao
Kouakou for his valuable comments on the manuscript. This work was financially supported by the UEMOA, through the PRESH project ‘‘Projet Régional d’Evaluation des Stocks Halieutiques’’
REFERENCES
Albaret J. J. & Legendre M., 1985. Biologie et écologie des Mugilidae en lagune Ebrié (Côte d’Ivoire) : Intérêt potentiel pour l’aquaculture lagunaire. Revue d' Hydrobiologie Tropicale 18 : 281-303. Bianchi G., 1992. Study on the demersal assemblages of the continental shelf and upper slope of Angola. Marine Ecology Progress Series 81: 101-120
Boely T., Fheon P. & Stequert B., 1982. La croissance de Sardinella aurita (val 1847) au Sénégal. Tropical océanography, 17 (2): 103-119.
Caverivière A., 1993. Les ressources en poissons démersaux et leur exploitation. In: Environnement et ressources aquatiques de Côte d’Ivoire. Tome I- Le milieu marin (Le Loeuff
10530 P., Marchal E., & Amon Khotias J. B., éds). ORSTOM, Paris:427- 488.
Clark B., Bennett B., & Lamberth S., 1996. Temporal variations in surf zone fish assemblages from False Bay, South Africa. Marine Ecology Progress Series 131: 35 - 47.
Clarke K. & Warwick R. 1994. Change in marine communities: an approach to statistical analysis and interpretation. UK: Natural Environment Research Council continental shelf and upper slope of Angola. Marine Ecology, 144 p. Cury P. & Fontana A., 1988. Compétition et stratégies
démographiques comparées de deux espèces de sardinelles (Sardinella aurita et Sardinella maderensis) des côtes ouest africaines. Aquatic Living Resources 1 (3) : 165-180.
Dajoz R., 2002. Les Coléoptères Carabidés et Ténébrionidés: Écologie et Biologie. Ed. Lavoisier Tec & Doc., Londres, Paris, New York, 522 p.
Edwards A., Gill A & Abohweyere P., 2001. A revision of Irvine's Marine fishes of tropical West Africa. Darwin Initiative Report 2, Ref. 162/7/451. (Available with CD-ROM of colour photographs, specimen database and text files), 157 p Fauth J., Bernardo J., Camara M., Resetarits W., Van
Buskirk J. & Mc Collum S., 1996. Simplifying the jargon of community ecology: a conceptual approach American Naturalist. 147: 282-286. Field J., Clarke K. & Warwick R., 1982. A Practical
strategy for analyzing multispecies distribution patterns Marine Ecology Progress Series, 8:37-52.
Fischer W., Bianchi G., Scott W. (eds.) (1981). FAO species identification sheets for fishery purposes. Eastern central Atlantic; fishing areas 34, 47 (in part). Vols. 1-7.Department of Fisheries and Oceans Canada, Ottawa, by arrangement with the Food and Agriculture Organization of the United Nations
Gbenyedji J., Anani K., Amevoin K. & Glitho I., 2011. Diversité spécifique des termites (Isoptera) dans deux plantations de tecks (Tectona grandis L.) au sud du Togo. International Journal of Biological and Chemical Sciences, . 5 (2):755-765.
Ibanez C., Oberdorff T., Teugels G., Mamononekene V., Lavoué S., Fermon Y., Paugy D. & Toham A.,
2007. Fish assemblage’s structure and function along environmental gradients in rivers of Gabon (Africa). Ecology of Freshwater Fish 16: 315 - 334.
Kamdem Toham A. & Teugels G, 1999. First data on an index of biotic integrity (IBI) based on fish assemblages for the assessment of the impact of deforestation in a tropical West African river system. Hydrobiologia 397:29-38.
Kouassi A., 2005. Hydrochimie et qualité des eaux de deux lagunes tropicales de Côte d’Ivoire (Ebrié, Grand-Lahou). Thèse de Doctorat, Université de Cocody, Abidjan, 242 p.
Longhurst A., Pauly D., 1987. Ecology of Tropical Oceans Academic Press, New York, 407 p. Martin L., 1973. Carte sédiment logique du plateau
continental de Côte d'Ivoire. ORTSOM – CRO Abidjan, Notice explicative, n°. 48, 19 p. Mehl S., Olsen M., & Bannerman P., 2006. Surveys of
the fish resources of the western Gulf of Guinea (Benin, Togo, Ghana, Côte d’Ivoire). Survey of the pelagic and demersal resources 19 May-7 June 2006. NORAD – FAO/UNDP project GCP/INT/730/NOR. Cruise reports Dr. Fridtjof Nansen, Institute of Marine Research, Bergen, Norway.
Que´ro J. &Vayne J., 1993. Nouvel indice pour les pérégrinations du maigre. Annales de la Société´ des Sciences Naturelles de la Charente Maritime 8: 127–128.
Schneider W., 1990. FAO species identification sheets for fishery purposes. Field guide to the commercial marine resources of the Gulf of Guinea. Prepared and published with the support of the FAO Regional Office for Africa. FAO, Rome, 268 p
Troadec U., 1968. Note sur le développement possible de l'exploitation des crevettes en Côte-d’Ivoire. Document Scientifique Provisoire du Centre de Recherches Océanologiques. Abidjan, 20, 19 p. Yapi Gnaoré C., Da Costa K., Kouassi N. & Dembelé I., 2000. Opportunities and strategies for conservation of fish genetic resources in Côte d’Ivoire. In Abban, E. K, C. M. V. Casal, T. M. Falk & R. S. V Pullin (eds), Biodiversity and Sustainable Use of Fish in the Coastal Zone. ICLARM Conference Proceedings 63: 28 - 31.