Working paper
DT n° 17
Impact of Health Care System
on Socioeconomic Inequalities in Doctor Use
for the European Union Working Group on Socioeconomic Inequalities in Health*Zeynep Or (Irdes)
Florence Jusot (Legos-Leda, Irdes) Engin Yilmaz (Irdes)
Institut de recherche et documentation en économie de la santé
September 2008
* The other members of the group who contrbuted to this payer with their comments are listed in Appendix. We are also grateful to Thomas Barnay and the other members of the French Health Economists Association for their comments on an earlier version of this paper.
Impact of health care system on socioeconomic inequalities in doctor use*
Zeynep Or 1,2,,Florence Jusot2,3,, Engin Yilmaz2
for the European Union Working Group on Socioeconomic Inequalities in Health*
Abstract
This study examines the impact of health system characteristics on social inequities in health care use in Europe, using data from national surveys in 13 European countries. Multilevel logistic regression models are estimated to separate the individual level determinants of generalist and specialist use from the health system level and country specific factors. The results suggest that beyond the division between public and private funding and cost-sharing arrangements in health system, the role given to the general practitioners and/or the organization of the primary care might be essential for reducing social inequities in health care utilisation.
Keywords : Equity, Health system, Doctor utilisation, Multilevel, International JEL classification: I12 ; I18 ; O57
* The other members of the group who contributed to this payer with their comments are listed in Appendix. We are also grateful to Thomas Barnay and the other members of the French Health Economists Association for their comments on an earlier version of this paper.
1
Corresponding author: Zeynep Or, IRDES, 10 rue Vauvenargues, 75018 Paris, France: or@irdes.fr
2
IRDES, Research and information institute for health economics, 10 rue Vauvenargues, 75018 Paris, France.
3
Impact of health care system on socioeconomic inequalities in doctor use
1. Introduction
Access to health care constitutes a basic right according to the Charter of Fundamental Rights of the European Union. However, it is well demonstrated that there are significant social inequalities in use of health services in all European countries (van Doorsler et al., 2000; Hanratty et al 2007). The principal of horizontal equity requires that people in equal need of care are treated equally irrespective of their income, race or social position. In particular, the work by the Ecuity project draw attention to a “pro-rich” bias in the use of specialist care in Europe, whereas access to primary care was more equitably distributed across socioeconomic groups in most countries (Couffinhal et al., 2004; van Doorslaer and Koolman, 2004; van Doorslaer et al., 2006). At the same time, these studies show that the magnitude and direction of these inequalities vary significantly from one country to other. For example, in Ireland and Great Britain, there seem to be a “pro-poor” bias in the use of GP services while the opposite is observed in Portugal and in Finland. Again, the observed inequalities in specialist use vary significantly across European countries, being particularly marked in some countries despite universal health coverage (Hanratty, Zhang, Whitehead 2007).
In order to explain these inequalities, most attention has been paid to the factors influencing the individual demand for care. Two lines of explanations have been proposed. First, the results of the Equity project confirmed the role of the direct cost of care in driving inequalities in health-care use, in particular, variations in specialists use being explained by the possession (or not) of complementary health insurance (Bongers et al., 1997 ; van Doorsler et al., 2000 ; van Doorslaer & Masseria, 2004). A second explanation, suggested by health capital models (Grossman, 2000) and social literature is the existence of cultural and informational barriers (lack of knowledge of care pathways) and a lack of incentives which explain the reluctance of the poorest and least educated to use health care (Alberts
et al., 1997, 1998; Couffinhal et al., 2005a).
However, very little attention has been paid to the impact of health system organisation on these inequalities in health care use, and in particular as a factor which might explain variations across countries. While, the Ecuity project looked at the role of insurance coverage (differences in private health insurance status) in generating inequity (van Doorsler et al., 2000; van Doorslaer and Masseria, 2004), the impact of other characteristics of health systems with universal coverage have not been extensively explored. Even under a system of “universal coverage, the comprehensiveness of the care provided varies from country to country. In addition, there may be other non-financial factors involved, including supply-side variations in care and the roles given to different actors in the system, which would determine the utilisation of health care by different socioeconomic groups. In the context of ongoing health care reforms in most European countries in financing and providing health care, it is important to identify the impact of different institutional features on access to care by socioeconomic status.
Therefore, this study examines the impact of different health system characteristics on social inequalities in health care with a focus on specialist and generalist use in European countries. The next section introduces those major health system characteristics that might influence social inequalities in health care use. The methodology and the estimation strategy are presented in Section 3. Unlike previous studies in this area, we use a multilevel regression approach for studying variations in social inequalities across countries. Section 4 introduces the data and variables used in the regression analysis. The results are presented in Section 5, followed by a discussion in Section 6.
2. Health care system characteristics and equity in care utilisation
This section provides a discussion of those features of health care systems that are potentially relevant for explaining cross-country differences in health-care utilisation by different socio-economic groups.
First, at the macro level, we can classify health care systems by the principal sources of financing. We distinguish systems by the importance of private versus public funding. We also compare systems financed essentially by social insurance versus tax based ones. The underlying assumption is that these are key parameters which characterise the organisational form of the health care system in each country with common set of macro characteristics which in turn would affect health care utilisation by different groups.
Second, at a more micro level, we identify those features of health care systems that may influence the access to physician care and which provide a more micro-level explanation of the affects the general organisational form of a system. These include: the availability of physicians (the level of resources), the methods of paying doctors and the regulation of access to specialist care (referral practices).
Below, we briefly introduce these parameters and review the available evidence on their potential impact on equity of care utilisation.
2.1. Sources of financing health care
A range of evidence suggests that the split between the public and private financing of health services influences access to, and use of, medical resources by different socio-economic groups. At the macro level, there is some evidence of a positive impact of public funding on overall mortality and morbidity rates (Leu, 1986; Babazano, 1994; Or, 2001), but this leaves open the question as to whether this is the result of a uniform improvement in health status across the population. Public financing and provision of services may increase the chance that poorer patients can afford services which are otherwise too costly, and, thus contribute to the reduction of social inequities in care utilisation. There is some country specific evidence supporting this. In France for example, the introduction of a “free complementary health insurance plan” for the poorest part of the population (CMU complémentaire) has improved significantly their health care utilisation, shifting their consumption curve closer to the
rest of the population (Raynaud, 2003; Grignon et al., 2007). Thus, we expect social inequities to be less severe in countries where the public share of health expenditure is high.
A common distinction made between health systems concerns the nature of primary sources of financing; mainly tax versus social insurance. On the one hand, health systems based on social insurance are often characterised by a multitude of insurance organisations independent from health care providers. Health care is produced by a mixture of public and private providers and typically there are multiple payers. On the other hand, in taxed-based or National Health systems, financing and provision are handled by one central organisation. They are also called integrated as there is a single payer who also manages the national provision of health care.
There have been a number of studies comparing the relative merits of the two types of system. It is often said that social-insurance systems are superior from a consumer point of view in terms of providing greater choice while national health systems are more cost efficient (Health Consumer Powerhouse, 2007). However, the impact of these system-types on equity of utilisation has been little studied.
2.2. Doctor availability
Several studies have shown that there is a significant relation between national or regional health disparities and the amount of medical resources available, in particular the density of doctors (Grubaugh and Santerre, 1994; Jusot, 2004; Or, 2005). It is also suggested that the consumption of generalist and specialist services increases with medical density, and this impact is more important for lower socioeconomic groups (Place, 1997; Lucas et al., 2001, Breuil et Rupprecht, 2000; Jusot, 2004). In systems where medical resources (physicians) are scare, access to care is likely to be difficult for all, but more so for low socioeconomic groups, due to the cost of transport/time for example. However, at the macro level, it is also possible that in countries where resources are not abundant, the health care system pays more attention to the distribution of available resources (better geographical equity) and develops mechanisms that target better those who need care the most (lower socioeconomic groups).
2.3. Financial incentives for doctors
In countries included in this study, there are three major methods of paying doctors: fee-for- service (payment for each act), salary (payment for each period of time) and capitation (payment for each patient per period of time).
Under fee-for-service (FFS), doctors have financial incentives to increase the volume and price of services they provide. The FFS system has several potential advantages, such as access to a wider and more abundant range of providers such as in France and Germany. Capitation is often introduced as an effort to control the cost of health care, but it also raises concerns about access. Several studies, all from the United States, suggested that in the context of managed care switching from FFS to capitation reduces service use (Gosden et al, 2000), but it is not clear if this implies greater
efficiency/quality or reduced access. For example, Zuvekas and Hill (2004), comparing HMO models with different payment systems, suggest that capitation increase the access to preventive care. The advantages of a system where doctors are remunerated on a wage and salary basis are known to be easier financial planning and cost control (OECD, 1994). However, under a fixed salary, general practitioners have little financial incentive to compete for patients. Patients may therefore suffer from inappropriate referral to secondary providers (Gosden et al., 1999). While paying a salary to specialists working in hospitals is quite common in Europe, in ambulatory sector this only concerns generalists and, in our sample, Portugal only.
In existing literature reviews of the effects of different payment methods on cost, quality and access, no study was identified which looked specifically at the impact of different payment methods on access to care controlling for health need across socioeconomic groups (Gosden et al., 1999, 2000). Therefore, we are unable to draw firm hypothesis about the impact of different payment methods on equity. But we note that in FFS systems, often physician care is not entirely free at the point of delivery, while in capitation and salary systems this is usually the case. Also in systems where doctors are under capitation, they have a responsibility with respect to the population in charge with often specific objectives targeting the low socioeconomic groups such as in the United Kingdom, the Netherlands, and Sweden (Couffinhal et al., 2005b). Moreover, several critics point that capitation may have advantage over FFS and salary systems in terms of better case management and coordination of services especially for people with chronic or multiple diseases (Mitchell and Gaskin, 2007). And this type of coordination is likely to be more important for ensuring access for those with a low level of education/income who seem to be less well informed on care pathways.
2.4. Referral practices
In many European countries, such as the United Kingdom, the Netherlands, and Portugal, the primary care sector has been organised around general practitioners being gatekeepers for the system. Gatekeeping is considered as a mechanism of cost containment in part because of the evidence that specialists induce demand for costly and sometimes unnecessary procedures.
A few studies have looked at the impact of different gatekeeping models (strict, loose or none) on access, mainly in the US. For example, Hodgkin et al. (2007) suggest that while loosening gatekeeping arrangements increases the utilisation of mental care, the magnitude of this increase is relatively modest. Similarly, Ferris et al. (2001, 2002) show that replacing a gatekeeping system with open access to all types of specialists in a managed care organization resulted in minimal changes in the utilization of specialists by adults, but visits for children with chronic conditions did increase after the removal of gatekeeping.
While there is no direct evidence of a gatekeeping on equity at a micro level, there is some indirect evidence from macro level comparisons. Countries where GPs act as gatekeepers to secondary care are those with an established primary care organisation and usually patients do not have to pay user charges for consulting a GP or a specialist. This by itself may reduce the inequalities in use of doctors by different socio-economic groups. There is also a body of literature suggesting that health systems
oriented toward primary care services reduce the disparities in health care use (Starfield et al., 2005). The effectiveness of primary care programs aiming at improving health in deprived populations is particularly well established with evidence from developing countries (Alberts et al., 1997; Reyes et al., 1997).
3. Methods
In previous work looking at inequity in health care utilisation, the degree of horizontal inequity is measured in each country by comparing the actual observed distribution in care use by income with the “expected” distribution determined by age, sex and health status. In this approach, the level of inequalities can be measured and compared between countries, but this does not explain differences in the extent of these inequalities across countries.
The approach adopted in this paper differs from previous studies by using multilevel models to take into account simultaneously individual level variables and more general country level health system factors which would influence access to care. We proceed in three stages.
We first verify, by estimating separate logistic regressions for each country, if controlling for need, the probability of visiting GP and specialist varies by social status in the countries studied. This first analysis is useful to assess the size and direction of the social inequity in health care utilisation in each country. The coefficient of “social status” variable, all else being equal, could be used as an indicator of social inequity in a country. But, in these country specific estimates, country specific factors can not be disentangled from those which are common across all countries.
Thus, in a second stage, by pooling data across countries and using multilevel models we estimate statistically the proportion of the variation in health care utilization that can be explained by social status, controlling for other determinants of demand, as well as country level unobserved factors4. Multilevel modelling allows us to test if the impact of “social status” on health care use is the same across countries with respect to a specific social status variable (such as education). Finally, we introduce a number of health systems variables for explaining observed social inequities.
3.1. Logistic regressions by country
First, the determinants of the probability of visiting a GP/specialist are estimated separately in each country with logistic regressions. For individual i in a given country j, access to GPs/specialists during a recall periodis observed, with:
Cij = 1 if the individual had at least a visit during the recall period;
Cij = 0 otherwise.
To estimate the probability of care consumption for individual i in country j, we assume an underlying latent response variable C*ij defined as follows:
4
A useful introduction to multilevel models with binary and proportion responses can be found in Leyland and Goldstein (2001). For a more general introduction see Kreft and Leeuw (1998).
∀ j= 1, …, 13 C*ij = α0j + Xij α1j + Zijγj + uij (1)
where, Cij = 1 if C*ij > 0 ; Cij = 0 otherwise.
The propensity to consume care C*ij is assumed to be determined by an individual’s social status Xij, a
vector of observable individual characteristics Zij including the need for care (age, sex, health status,
etc,), a constant α0j and an error term uij logistically distributed.
3.2. Multilevel models
In a multilevel model the random variability in the variables observed is decomposed between the basic smallest unit of analysis, known as level 1, and the higher level grouping (level 2). Emphasis is placed on defining and exploring variations at each level and how such variances are related to explanatory variables. In the present analysis, individual level data from national health surveys (level 1) are nested naturally in countries (level 2). As a second step, we explore the determinants of the probability of visiting a GP/specialist by pooling data from all countries.
The propensity to visit a doctor for individual i in country j (C*ij) is explained both by his/her social
status Xij, other observable individual characteristics Zij (age, sex, health status, etc.), an individual
error term eij and a country specific constant β0j:
C*ij = β0j + Xij β1j + Zijπ + eij (2)
Furthermore we allow the impact of social status to differ across countries (technically variation in slopes β1).
Across countries, the coefficients β have a distribution with a given mean and variance. At level two, the variation in the intercept and slope is predicted by:
β0j = β0 + μ0j (2.1)
β1j = β1 + μ1j (2.2)
with β0j ~ N(0, σ2β0); β1j ~ N(0, σ2β1); and cov (μ0j, eij) = 0 ; cov (μ1j, eij) = 0
The terms β0 and β1 express the fixed parameters (average) across countries, and μ0j and μ1j is the
deviation for a given country j (country effect).
In particular, we are interested in the coefficients of the equation (2.2) which would give us information on the variation of the impact of “social status” across countries.
By substituting equations (2.1) and (2.2) into equation (2) we obtain the following multilevel equation:
C*ij = β0 + μ0j + Xij (β1 + μ1j) + Zijπ + eij (3)
Finally, we introduce some more complex variance structures at the country level to explain variations in “social inequity” (as measured by β1j) by adding health system characteristics, as
follows:
β1j = β1 + Wj τk + ω1j. (4)
with wj representing a vector of regressors that correspond to different health system characteristics.
normally distributed around 0. The variance-covariance components are now conditional since they represent the variability β1j after controlling for the k regressors at the country-level.
The aim of this modelling exercise is to answer the following policy question: which aspects of health care systems, if any, contribute to social inequities in health care use? Hence, the right hand-side variables introduced in equation (4) aim to capture the variations across countries in health system design. The individual variables considered for this analysis will be presented in the next section.
4. Data and variables
The data for this analysis mainly come from the European project Eurothine (Tacking Health Inequalities in Europe) which collected and harmonized data from national health or multipurpose surveys in about 20 European countries. The cross-country harmonized data set provides individual level information on socio-economic status, self-reported health, related behaviour and health-care utilization (Erasmus MC, 2007, Mackenbach et al. 2008).
In this study, we use data from the following thirteen countries where data on physician use were available: Belgium, Denmark, England, Estonia, France, Germany, Hungry, Ireland, Italy, Latvia, Netherlands, Portugal, and Norway. England and Portugal are only included in the analysis of generalist use as data were missing on specialist use. The analysis is restricted to the adult population aged 20 to 64 years old, as data for the older population was not available for all countries. Table I presents some summary information on the survey used for each country. Further detail on these surveys, as well as the harmonisation procedures carried out by the Eurothine project, can be found in the project web-site 5.
Country level data on health systems come from the OECD Healthdata and WHO data base. The variables defining health system characteristics are constructed by the authors based on literature reviews by country (in particular on HIT reviews by European Observatory on health systems and policies) and by consulting country experts.
[Insert Table I]
4.1. Health care utilisation
Two variables are used to measure access to health care: visits to a general practitioner and visits to medical specialists. In most surveys, information on the number of visits is collected with a standard question: “In the past 12 months how many times have you consulted a GP/specialist services?”. In six countries (Portugal, Denmark, Belgium, England, the Netherlands and Italy) the length of the recall
5
period differed6. We adjusted for these differences in the multilevel analysis by introducing a country specific categorical variable for the recall period R j (in month) in the equation (2.1):
γ0j = γ0 +αR j + μ0j (2.1)
We assume that the recall period would have an impact on the average probability of doctor visit but not on the level of social inequalities in each country.
Initially the number of visits are measured as a continuous variable7 with a minimum value of 0 (no visit) and a maximum depending on each country. To improve comparability across countries, we recoded the variables on visits as binary: those who had at least one visit during the reference period (1) and those who had none (0).
4.2. Social status
The socio-economic status of individuals is measured by educational attainment. We could not use income as a more direct variable of social status because of missing data and low comparability across countries. Clearly individuals’ education and income are correlated, but education is also likely have an independent impact on propensity to consume heath care, beyond income, reflecting the existence of non-financial barriers in some systems. It is equally important to assess its direct contribution to horizontal inequity.
The education variable gives the highest level of education that was completed by the respondent. The national categories of educational level were harmonized on the basis of the International Standard Classification of Education (ISCED) into four categories: No or only primary education (ISCED 1), lower secondary (ISCED 2), upper secondary and post secondary (ISCED 3+4), tertiary education (ISCED 5+6). To further adjust for heterogeneity in the distribution of educational categories across countries, a rank variable was also calculated by Eurothine on the basis of the cumulative relative frequencies in each country. This variable takes values between 0 and 1 with stepwise increasing categories. The robustness of all the estimations is checked using the ranked variable, but as the results were practically the same we only present those with education in four categories for the ease of interpretation.
4.3. Health needs
To account for differences in the need for health care, we introduce two variables: self reported health status and Body Mass Index. Self reported health is measured in most countries in five categories (very good, good, average, bad, very bad) except in two countries (Germany and the Netherlands) where categories are as follows: excellent, very good, good, average, bad. We recoded this variable as binary (good or better against less than good).
6
Three months in Portugal and Denmark, two months in Belgium and the Netherlands, four weeks in Italy, two weeks in England.
7
Body Mass Index (BMI) gives the relationship between the height and weight of the respondent.8 It is coded into four categories: underweight (10<=IMC<18.5); normal (18.5<=IMC<25); overweight (25<=IMC<30); and obese (30<=IMC<70).
4.4. Other individual level variables
The other variables which are introduced to control for individual characteristics include age (coded as categorical in five-year age groups), sex and the degree of urbanization of the residence area of respondents. The available national categories were harmonized in four levels ranging from rural areas to largest cities and their metropolitan areas. We recoded this variable as binary: living in a very urban area (large cities) against all other categories (small cities, towns, rural areas).
[Insert Table II]
4.5. Health system characteristics
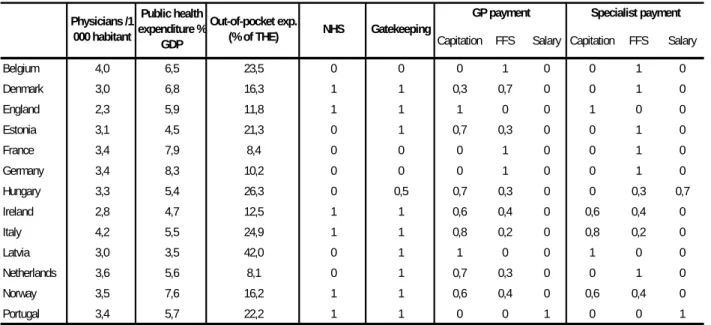
The key health system characteristics which are integrated in this analysis are doctor availability, the methods of physician remuneration, the referral system (gatekeeping or not) and the modes of financing health care (public/private and tax/social insurance).
Two variables are used to characterise the public-private mixture of health care financing: share of public health expenditure in GDP and share of out-of-pocket expenditure in total health expenditure (Table II). The first would test the impact of public health investment in the national economy (as % of PIB), while the second would emphasise the relative importance of private cost-sharing in a given health system. Clearly their expected impact would be opposite.
A dummy variable is constructed to distinguish tax-based national health care systems (1) from the social insurance systems (0).
The number of physicians per 1000 habitants is used to measure physician availability. We could not distinguish the availability of specialists versus generalists because of missing data in many countries. In order to capture the dominance of different payment schemes for physicians in each country, we have constructed a number of categorical variables which takes values between 0 and 1. Namely, we test the effects of fee-for-service payment against capitation or salary for ambulatory doctors. Separate sets of variables are developed for GPs and specialists as their mode of remuneration is often different. Also, in some countries GP remuneration is a mixture of different schemes. For example, in Denmark on average a third of GP remuneration comes from capitation while the remainder comes from fees for consultation and individual procedures9. Hence the coefficient of capitation for Denmark will be 0.3 while 0.7 for FFS (and 0 on wage). It is important to bear in mind that, these variables are based on qualitative country information and should only be taken as a proxy for broad differences across countries.
8
Calculated as follows: BMI = weight (kg) / [height (m)]².
9
Finally, the variable “gatekeeper” corresponds to 1 for countries where GPs control patient access to specialist care and zero otherwise. The only exception is Hungary where the coefficient is set to 0.5, as in principle patients need to be referred by their family doctor to access specialist services, but in practice there seem to be many exemptions and ways to circumvent this rule10.
5. Results
5.1. Educational differences in care utilisation (logistic regressions)
Table III presents the results from the logistic regressions estimated separately for each country. First, we confirm that in all of the countries studied there is a pro-educated bias in specialist use after controlling for age, sex, health status and place of residence.
Second, the pattern for GP utilisation is less homogeneous across countries. We note three groups of countries: in France, Portugal, Hungary and Estonia the odds of visiting a GP is significantly higher for those having a university degree compared with those having a primary education, while the opposite is true in England, Germany, Norway and Italy. In the remaining countries (Belgium, Denmark, Ireland, Latvia and the Netherlands), there does not seem to be any significant difference between different educational categories concerning GP visits.
[Insert Table III]
5.2. Determinants of care utilisation (random effects models)
Table 4 presents the multilevel regression results for the probability of visiting a specialist or generalist, pooling data across countries. The models presented allow for a country specific effect on the probability of visiting a physician and adjust for the differences in reference period using a “recall period” variable on the country effect. We also allow for the impact (coefficients) of education to vary across countries. The equations for GP care are based on 13 countries, while those for specialist care on 11. Estimated coefficients are translated into probabilities (odds ratios) for facilitating the interpretation.
Overall, the results correspond to the expected relationships between consultations and individual level characteristics. Across these countries on average, women and those reporting less-than-good health have a higher probability of consuming both GP and specialists. The odds of visiting a physician also increase after 50 years of age. Moreover, individuals classified as overweight and obese have a higher probability of visiting a GP. BMI does not seem to have an impact on specialist use, conversely to poor self-perceived health which is associated with a higher probability of specialist visit.
[Insert Table IV]
10
Finally, on average, all else being equal, people who live in big cities and metropolitan areas have a higher propensity to consume specialist care compared with those living in small cities and rural areas. Adjusted for the need for care, the results show significant inequalities in the use of specialist care. Higher education is significantly associated with an increased probability of consulting specialists, on average, the odds of visiting a specialist being 1.6 times higher for those with a university diploma compared with those having only primary level education. Clearly, education is associated with a higher level of income, but also a more proactive attitude in seeking care. The picture for GP use is less clear. On average, individuals with secondary education have slightly higher odds of visiting GP, but this is not the case for those with a university degree.
The variance statistics at the bottom of the table confirm that the relationship between educational attainment and the probability of specialist/GP use differ by country (variance terms are significant at 1%). The Median Odds Ratio (MOR) translates the country level variance into an Odds Ratio scale. A MOR equal to one would mean that, there are no differences between countries in the probability of seeking a physician. We can see that unexplained heterogeneity between countries is somewhat smaller for the odds of visiting a GP compared with visiting specialists.
In multilevel models, the size of the country specific “impact” of education can be estimated with a certain precision (i.e. with a mean value and confidence intervals). For comparative purposes, the estimates of the country level random effects, or the values of μ1j, are of particular interest (Cf.
equation 5). For example, the “residual” estimates (i.e. the country deviation from the mean impact of education) for “highly educated” group can be used to make comparisons of relative “inequity” across countries.
Figures I compares the relative impact of education across countries on the propensity of specialist and generalist use. The coefficient shown for each country represents the deviation from the average “impact” of education (having tertiary level education) on the probability of consulting a specialist/GP. Countries on the left-hand side of each figure (above the average or zero line) are those where the impact of education on access is higher than average (less equitable), while those on the right-hand side are more equitable than the average. For each point estimate, 95 percent confidence intervals are shown (based on conditional standard errors11) to distinguish significant differences between countries. We can see that in Latvia and in France, compared to the average, a high level education has a significantly higher impact on access to specialist care, while in Ireland and the Netherlands the opposite is true. Note that this does not mean that there is no pro-education bias in specialist use in the Netherland and Ireland but that compared to the average (in this sample) the size of inequity is smaller.
The interpretation is a bit different for generalists as the odds of average is close to 1 (non significant). Therefore the countries on the left are actually those with a positive OR (pro-educated bias) and those on the right with a negative OR (un-educated bias). We can see that in Hungary, Portugal, Latvia and
11
The appropriate standard errors of estimated country level residuals are the conditional standard errors of the predictions. The pair-wise 95% confidence intervals are û i +/- 2.201*standard errors of the estimates. See, Studenmund, 1992).
in France there is significant pro-educated bias, while in Germany, Belgium and Italy the situation is reversed.
[Insert Figure I]
5.3 Impact of health care system on inequalities in doctor use
In order to explain these residual heterogeneities in social inequalities in doctor use across countries, we test the impact of health system variables (as introduced in section 2) on the coefficient of education (tertiary level) as our measure of social inequity. Health system variables are introduced one by one in the equations, because of the very low degrees of freedom at second/country level (10 to 13). Therefore, in Table V, each line corresponds to a different model. For example, the fist model tests if the education related inequalities in GP and specialist visits are more pronounced in taxed based National Health Systems (NHS), the second, in systems with gatekeeping, and so on. All the models control for the individual level variables presented in Table IV, these are not presented to keep the table to a manageable size.
The results in Table V suggest that, all else being equal, social inequalities in specialist use are less strong in countries with NHS and where doctors work as gatekeepers. It is difficult to disentangle the impact of gatekeeping from NHS as the two go often together. But while all countries with a NHS have gatekeeping, the inverse is not true. There are a number of countries with a social insurance system with well established gatekeeping such as the Netherlands, Estonia and Latvia. Neither gatekeeping nor NHS seem to have an impact on the size of social inequalities in GP use.
The level public health expenditure (as % of GDP) appears to have a significant impact on social inequities in GP use, but this is not the case for specialist use. As expected, “out-of-pocket payment” has a small but significant impact on the educational inequities in both GP and specialist use.
[Insert Table V]
None of the payment methods appear to have a significant impact on educational inequalities, except wage on GP utilisation (higher inequalities in systems where doctors are paid by salary). But this latter result is explained entirely by Portugal which is the only country where doctors are paid by wages. Finally “doctor availability” does not seem to have any significant impact on the size of cross-country inequalities on doctor use (not presented in the table). The fact that we could not separate the number of GP and specialist might partly explain this.
6. Discussion
The present study offers some new comparative evidence on social inequities in doctor use and explores the role of key institutional features of health care system in explaining these equities in Europe using a new data set including Central and Eastern European countries. Unlike many previous cross-country comparative studies, we use a multilevel modelling approach which allows us to estimate the determinants of social inequities at both the individual and country/ health system levels.
A number of key findings emerge from our analysis. First, our results suggest that after controlling for need differences, individuals with a higher level of education have a higher probability of consulting a specialist in all countries. Education is clearly a predictor of income, but also and independent from income, may indicate a more proactive attitude in seeking care. Thus the better educated may be better able to articulate their needs and insist on referral when they think it is necessary. We also confirm that the magnitude of these inequalities varies significantly across countries: France, Latvia and Hungary having the strongest pro-educated inequalities in specialist use.
Second, there is considerable heterogeneity in the pattern of GP utilisation across the countries studied. In most countries GP visits are quite equitably distributed across educational categories, or there is a bias towards the lower educational groups. But in a few countries, such as France, Portugal, Hungary there is a strong pro-education bias: those having a university degree have a significantly higher use of GP care, compared with those with primary education, controlling for need differences. In France and in Latvia, horizontal inequities in doctor use appear to be more pronounced than in most other European countries whatever indicator is used.
Third, these cross country differences in health care use by different social groups can be explained, to some extent, by the major characteristics of health care systems. Our results suggest that the degree of social inequities in specialist use is smaller in countries with a tax-based National Health system and in countries where doctors play a “gatekeeper” role. However, we cannot really confirm an independent impact of either of these two institutional features as the two go often together. In countries where there is strict gatekeeping, patients usually do not have to pay user charges at the point of delivery, while they are often charged for consulting a GP or a specialist in other systems. We did not have a specific variable defining if the physician services are free at the point of delivery in each country. Thus, gatekeeping might be working as a proxy for that.
Furthermore, countries where GPs act as gatekeepers are those with an established primary care organisation which, as is often suggested, may place a greater emphasis on meeting care needs of deprived populations with more focused action. Systems with gatekeeping may provide a simpler access and better guidance for people with lower socio-economic position. In social insurance based systems like France, the complexity of the rules for reimbursement for different services could be dissuading certain individuals from using some services.
Our results also confirm that social inequalities in GP and specialist use are stronger in countries where out-of-pocket payments are higher and the level of public health resources is lower than in other countries.
While we think that these results are useful for understanding the role of the health care system and for orienting future research on social inequalities in access and utilization of health services, there are some important limitations to the analysis. First of all, as in any cross country comparative study and despite the efforts for harmonisation, data comparability is a concern. We used country specific survey data from different sources and sometimes with differences in questions. Also there are a number of variables missing from our analysis without which we cannot really have a complete picture. In particular, we could not compare access to hospital care which is sometimes used as substitute for GP or specialist care by the poorest part of the population. It would also be interesting to compare the
results using household income as a social status variable. Moreover, it is difficult to characterise properly different dimensions of the health care systems and provide prescriptive solutions. We have concentrated on some of those aspects which seem important and for which information was available. It is clearly possible and desirable to improve these preliminary variables describing different health systems. More importantly, the small number of countries studied did not allow us to control for several system characteristics simultaneously. In future work, it would be important to look at a wider group of countries to check the robustness of our results concerning the impact of different system characteristics.
Despite these limits, this study adds significantly to the existing literature on the determinants of inequalities in health care utilization. It proposes a new methodology, going beyond the standard cross-country comparisons of social inequities, for studying the impact of various health system characteristics on these inequities. The results suggest that the organization and modes of financing health care do have an impact on the degree of inequity in health care utilization in Europe. It appears that the GPs position in health system and the organisation of primary care are particularly important in this respect, as well as cost sharing arrangements. Our results call for further work for identifying the best possible combinations for achieving more equitable health systems.
Appendix:
The following members of the European Union Working Group on Socioeconomic Inequalities in Health group provided comments for this paper: A. Kunst and I. Stirbu (Department of public health, Erasmus University Medical Center), A. Mielck (Institute of Health Economics and Health Care Management), C. Muntaner (University of Toronto) and O. Ekholm (National Institute of Public Health, University of Southern Denmark). We also thank to the members of Eurothine consortium for providing the survey data underlying this study.
REFERENCES
Alberts, J.F.; Sanderman, R.; Eimers, J.M.; van den Heuvel, W.J.A. 1997. Socioeconomic inequity in health care: a study of services utilization in Curaçao. Social Science & Medicine: 45: 213-220.
Alberts, J.F.; Sanderman, R.; Gerstenbluth, I.; van den Heuvel, W.J.A. 1998. Sociocultural variations in help-seeking behavior for everyday symptoms and chronic disorder? Health Policy, 44: 57-82. Babazono A., Hillman A.L. 1994. A comparison of international health outcomes and health care spending. International Journal of Technology Assessment in Health Care, 10, 3 : 376-81.
Bongers I.M.B., van der Meer J.B.W.1, van den Bos J., Mackenbach J.P. 1997. Socio-economic differences in general practitioner and outpatient specialist care in the Netherlands: a matter of health insurance? Social Science and Medicine, 44, 8 : 1161-1168.
Breuil-Genier P. et Rupprecht F. 2000. Comportements opportunistes des patients et des médecins : l’apport d’analyses par épisode de soins. Economie et Prévision, 142 : 163-182.
Couffinhal A., Dourgnon P., Masseria C., Tubeuf S., van Doorslaer E. 2004. Income-related Inequality in the Use of Medical Care in 21 OECD Countries. Towards High-Performing Health Systems, OECD report: 109-165.
Couffinhal A., Dourgnon P., Geoffard P-Y., Grignon M., Jusot F., Lavis J., Naudin F. , Polton D. 2005a. Policies for reducing inequalities in health, what role can the health system play? A European perspective. Part I: Determinants of social inequalities in health and the role of the healthcare system.
Issues in health economics IRDES, 92.
Couffinhal A., Dourgnon P., Geoffard P-Y., Grignon M., Jusot F., Lavis J., Naudin F. , Polton D. 2005b. Policies for reducing inequalities in health, what role can the health system play? A European perspective. Part II: Experience from Europe. Issues in health economics, 93.
Erasmus MC - Rotterdam Netherlands - Final Eurothine Report - August 20, 2007.
Ferris T, Chang Y, Perrin J et al. 2002. Effects of removing gatekeeping on specialist utilisation by children in a HMO. Arch Pediatr Adolesc Med, 156: 574-579.
Ferris T, Chang Y, Blumenthal D, Pearson S. 2001. Leaving gatekeeping behind- Effects of opening access to specialist for adults in a health maintenance organisation. N Engl J Med, 345: 1312-17. Gosden T, Forland F, Kristiansen IS, et al. (2000), Capitation, salary, fee-for-service and mixed systems of payment: effects on the behaviour of primary care physicians. Cochrane Database of
Systematic Reviews, 3, CD002215.
Gosden T, Pedersen L, Torgerson D. 1999. How should we pay doctors? A systematic rewiew of salary payments and their effect on doctor behaviour. Q J Med, 92: 47-55.
Grignon M., Perronnin M., Lavis J.N .2007. Does free complementary health insurance help the poor to access health care? Evidence from France. Health economics, 17, 2: 203-219.
Grossman M. 2000. The Human Capital Model. In Culyer A.J., Newhouse J.P. (eds) Handbooks of
Health Economics, Elsevier: 348-408.
Grubaugh S.G., Santerre R.E. 1994. Comparing the performance of health-care systems: An alternative approach. Southern Economic Journal, 60, 4: 1030-42.
Hanratty B, Zhang T, Whitehead M. 2007. How close have universal health systems come to achieving equity in use of curative services? A systematic review”. International Journal of Health
Services, 37, 1: 89-109.
Health Consumer Powerhouse. 2007. Euro Health Consumer Index 2007. http://www.healthpowerhouse.com/media/Rapport_EHCI_2007.pdf
Hodgin D, Merrick L, Horgan C, Garnick D, McLaughlin T. 2007. Does type of gatekeeping model affect access to outpatient specialty mental health services? Health Service Research, 42: 104-123. Jusot F. 2004. Mortalité et inégalités de revenu en France. DELTA working paper, 2004-32.
Kreft, I., Leeuw, J. 1998. Introducing Multilevel Modelling. Sage Publications, London
Leu R.E. 1986. The public-private mix and international health care cost. In Public and Private Health
Services, A.J. Culyer et B. Jonsson (eds.) B. Blackwell: 41-63.
Leyland A.H, Goldstein H. (eds). 2001. Multilevel Modelling of Health Statistics, John Willey & Sons, New York.
Lucas-Gabrielli V., Nabet N., Tonnellier F. 2001. Les soins de proximité : une exception française ?
Questions d’économie de la santé, Analyses, 39.
Mackenbach J.P., Stirbu I., Roskam A.J.R., Schaap M.M., Menvielle G., Leinsalu M., Kunst A.E. 2008. Socioeconomic Inequalities in Health in 22 European Countries. N Engl J Med 358: 2468-2481.
Mitchell J, Gaskin D. 2007. Caregivers’ rating of access: Do children with special health care needs fare better under fee-for-service or partially capitated managed care? Medical Care, 45: 146-153. OECD (Organisation for Economic Cooperation and Development) 1994. Health Care Reform Controlling Spending and Increasing Efficiency. Economics Department Working Papers, 149, Paris, OECD
Or Z. 2001. Exploring the effects of health Care on Mortality Across OECD countries. OECD Labour
Market and Social Policy Working Papers, 46.
Or Z., Wang J., Jamison D. 2005. International Differences in the Impact of Doctors on Health: A Multilevel Analysis of OECD Countries. Journal of Health Economics, 24: 531-560.
Place M. 1997. The relationship between concentration, patient accessibility and utilisation of services. University of York; Centre for Health Economics; York Health Economics Consortium, NHS Centre for Reviews & Dissemination.
Raynaud D. 2003. L’impact de la CMU sur la consommation individuelle de soins. Etudes et Résultats, 229.
Reyes H, Perez-Cuevas R, Salmeron J, Tome P, Guiscafre H, and Guitterez G. 1997. Infant mortality due to acute respiratory infections: The influence of primary care process”, Health Policy and
Planning, 12: 214-23.
Starfield B, Shi L, and Macinko J. 2005. Contribution of primary care to health systems and health.
The Milbank Quarterly, 83, 3 : 457-502.
Van Doorslaer E, Koolman X. 2004. Explaining income-related inequalities in doctor utilisation in Europe. Health Economics, 13, 7 :629-647.
Van Doorslaer E., Masseria C. and the OECD Health Equity Research Group Members. 2004. Income-Related Inequality in the Use of Medical Care in 21 OECD Countries. OECD Health Working
Paper, 14
Van Doorslaer E., Masseria C., Koolman X. for the OECD Health Equity Research Group. 2006. Inequalities in access to medical care by income in developed countries. Canadian Medical Journal, 174, 2. doi:10.1503/cmaj.050584.
Van Doorslaer E., Wagstaff A., van der Burg H., Christiansen T., De Graeve D., Duchesne I., Gerdtham Ulf-G., Gerfin M., Geurts J., Gross L. 2000. Equity in the delivery of health care in Europe and the US. Journal of Health Economics, 19, 5 : 553-583.
Zukevas S, Hill S. 2004. Does capitation matter? Impacts on access, use and quality. Inquiry, 41:316-335.
Table 1. Survey used by country
Table 2. Major health system features*
GP payment Specialist payment
Capitation FFS Salary Capitation FFS Salary Belgium 4,0 6,5 23,5 0 0 0 1 0 0 1 0 Denmark 3,0 6,8 16,3 1 1 0,3 0,7 0 0 1 0 England 2,3 5,9 11,8 1 1 1 0 0 1 0 0 Estonia 3,1 4,5 21,3 0 1 0,7 0,3 0 0 1 0 France 3,4 7,9 8,4 0 0 0 1 0 0 1 0 Germany 3,4 8,3 10,2 0 0 0 1 0 0 1 0 Hungary 3,3 5,4 26,3 0 0,5 0,7 0,3 0 0 0,3 0,7 Ireland 2,8 4,7 12,5 1 1 0,6 0,4 0 0,6 0,4 0 Italy 4,2 5,5 24,9 1 1 0,8 0,2 0 0,8 0,2 0 Latvia 3,0 3,5 42,0 0 1 1 0 0 1 0 0 Netherlands 3,6 5,6 8,1 0 1 0,7 0,3 0 0 1 0 Norway 3,5 7,6 16,2 1 1 0,6 0,4 0 0,6 0,4 0 Portugal 3,4 5,7 22,2 1 1 0 0 1 0 0 1
* Indicators are calculated as an average over three years before the survey year in each country.
Out-of-pocket exp. (% of THE) NHS Gatekeeping Physicians /1 000 habitant Public health expenditure % GDP
Country Survey name N
(20 -64 years) Survey year
Belgium Health Interview Survey 10 910 2001
Denmark Danish Health and Morbidity Survey 2000 12 484 2000
England English Health Survey 2001 10 626 2001
Estonia Health Behavior among Estonian Adult Population 3 740 2002/04 France 2004 Health, Health Care and Insurance Survey 9 231 2004 Germany German National Health Examination and Interview Survey 5 371 1998
Hungary National Health Interview Survey Hungary 3 823 2003
Irland Living in Ireland Panel Survey 4 704 2002
Italy Health and health care utilization 1999-2000 86 584 2000
Latvia Finbalt Health Monitor 3 222 2002/04
Netherlands Permanent Onderzoek Leefsituatie (POLS) 9 339 2003/04
Norway Norwegian Survey of Living Conditions 4 712 2002
Table 3. Educational inequalities in GP and specialist visits: logistic regressions by country 1
Belgium Denmark England Estonia France Germany Hungary Irland Italy Latvia Netherlands Norway Portugal
Visit to GP
Education
No / only primary Ref, Ref, Ref, Ref, Ref, Ref, Ref, Ref, Ref, Ref, Ref, Ref,
Lower secondary 1,03 1,11 0,96 1,09 1,29** 0,95 1,27** 1,05 0,98 0,91 1,11 Ref, 1,27***
Upper secondary 1,07 1,12* 0,92 1,31** 1,4*** 0,85 1,29** 1,07 1,01 1,01 1,11 0,88 1,42*** Tertiary 0,92 1,05 0,85* 1,28* 1,51*** 0,64** 1,7*** 1,02 0,85*** 1,18 1,07 0,79* 1,53*** Pseudo R2 0,0570 0,0550 0,0545 0,0389 0,0490 0,0175 0,0531 0,0811 0,0485 0,0297 0,0354 0,0495 0,0665
Percent pairs concordant 64,4 64,5 65,3 63,1 64,8 58,3 65,8 68,4 65,2 60,9 61,7 63,7 66,9
Visit to specialist Education
No / only primary Ref, Ref, - Ref, Ref, Ref, Ref, Ref, Ref, Ref, Ref,
-Lower secondary 1,2** 1,22 - 1,32** 1,58*** 1,55** 1,17 1,29** 1,2*** 1,35** 1,29** Ref, -Upper secondary 1,29*** 1,35*** - 1,41*** 2,23*** 1,9*** 1,34*** 1,37*** 1,5*** 1,5*** 1,28** 1,16 -Tertiary 1,67*** 1,8*** - 1,94*** 3,27*** 1,86*** 2,01*** 1,58*** 1,48*** 2,9*** 1,25** 1,19 -Pseudo R2 0,0485 0,0489 - 0,0441 0,1093 0,1143 0,0883 0,0822 0,0442 0,0742 0,0490 0,0292
-Percent pairs concordant 65,4 65,8 - 63,9 71,7 72,5 69,5 68,1 65,4 67,9 63,1 61,7
Table 4. Determinants of GP and specialist visits: multi-level regressions
Specialist visit1 GP visit1
Sex Odds ratio
Men Ref. Ref.
Women 1,98*** 1,52***
Age
20–24 years Ref. Ref.
25–29 years 1,11*** 0,99 30–34 years 1,08** 0,97 35–39 years 1,03 0,88*** 40–44 years 1,01 0,88*** 45–49 years 1,09** 0,98 50–54 years 1,17*** 1,09*** 55–59 years 1,23*** 1,17*** 60–64 years 1,31*** 1,39*** Education
No / only primary Ref. Ref.
Lower secondary 1,22*** 1,07*
Upper secondary 1,4*** 1,11**
Tertiary 1,72*** 1,08
Place of residence
Urban 1,13*** 1,02
Rural Ref. Ref.
Body Mass Index
Underweight 0,98 0,98
Normal Ref. Ref.
Overweight 1,01 1,14***
Obese 0,99 1,31***
Self assessed health
Good Ref. Ref.
Less than good 2,56*** 2,59***
Recall Period 1,18*** 1,22*** Variance: Intercept (Country) 0,73*** 0,34*** Education Lower secondary 0,01 0,01*** Upper secondary 0,03*** 0,01*** Tertiary 0,15*** 0,07***
Median Odds Ratio (MOR) 2,25 1,74
1 The coefficients are translated into Odds ratios. *Significant at 10%, **significant at 5%, ***significant at 1%
Table 5. Impact of health system characteristics on social inequalities in Health care use 1,2
Specialist GP
Odds Ratio Variance intercept
Variance tertiary education
Odds Ratio Variance intercept
Variance tertiary education
Health care system characteristics
National Health Service 0,63*** 0,66*** 0,12*** 0,97 0,34*** 0,07***
Gatekeeping 0,74** 0,69*** 0,16*** 1,05 0,34*** 0,07***
Out of pocket (% total expenditure on health) 1,02** 0,73*** 0,09*** 1,01* 0,33*** 0,06*** Public health expenditure (% GDP) 0,93 0,74*** 0,14*** 0,92*** 0,32*** 0,06***
Practicing physicians 0,80 0,73*** 0,14*** 0,95 0,33*** 0,07***
Capitation 0,95 0,72*** 0,16*** 0,91 0,35*** 0,02***
Salary_GP - - - 1,31*** 0,33*** 0,08***
1. Health system variables are introduced to explain the coefficient of "Tertiary education" (see equation 4)
2. All the equations control for age, sex, education, Self assessed health, BMI, place of residence and the recall period *Significant at 10%, **significant at 5%, ***significant at 1%
Figure 1. Estimations of education related inequity in doctor use by country Specialist visit -0,9 -0,6 -0,3 0 0,3 0,6 0,9 1,2
Latvia France Hungary Esto nia B elgium Denmark Italy Germany No rway Irland Netherlands
GP visit -0,8 -0,6 -0,4 -0,2 0 0,2 0,4 0,6 0,8
www.irdes.fr
Zeynep Or (Irdes), Florence Jusot (Leda, Legos, Irdes) Yilmaz Engin (Irdes)
This study examines the impact of health system characteristics on social inequities in health care use in Europe, using data from national surveys in 13 European countries. Multilevel logistic regression models are estimated to separate the individual level determinants of generalist and specialist use from the health system level and country specific factors. The results suggest that beyond the division between public and private funding and cost-sharing arrange-ments in health system, the role given to the general practitioners and/or the organization of the primary care might be essential for reducing social inequities in health care utilisation.
L’impact du système de santé sur les inégalités sociales de recours aux soins
Zeynep Or (Irdes), Florence Jusot (Leda, Legos, Irdes) Yilmaz Engin (Irdes)
Cette étude évalue l’influence des caractéristiques des systèmes de santé sur l’équité horizontale du recours aux soins en Europe. L’utilisation d’un ensemble des données issues d’enquêtes nationales récentes de 13 pays européens confir-me l’existence d’inégalités sociales de recours aux soins, à besoin de soins égal, dans tous les pays étudiés et montre que l’ampleur des inégalités varie de manière significative entre les pays. Une analyse multiniveaux permet d’identifier différentes caractéristiques des systèmes de santé qui semblent contribuer à la réduction ou à la formation de ces iné-galités. Les résultats soulignent l’importance du rôle des médecins généralistes et de l’organisation des soins primaires pour réduire ces inégalités au-delà du partage des coûts entre les sphères publique et privée.