HAL Id: tel-01542407
https://pastel.archives-ouvertes.fr/tel-01542407
Submitted on 19 Jun 2017HAL is a multi-disciplinary open access archive for the deposit and dissemination of sci-entific research documents, whether they are pub-lished or not. The documents may come from teaching and research institutions in France or abroad, or from public or private research centers.
L’archive ouverte pluridisciplinaire HAL, est destinée au dépôt et à la diffusion de documents scientifiques de niveau recherche, publiés ou non, émanant des établissements d’enseignement et de recherche français ou étrangers, des laboratoires publics ou privés.
Callovo-Oxfordian claystone : roles of anisotropy and
hydromechanical couplings
Lina Maria Guayacan Carrillo
To cite this version:
Lina Maria Guayacan Carrillo. Analysis of long-term closure in drifts excavated in Callovo-Oxfordian claystone : roles of anisotropy and hydromechanical couplings. Geophysics [physics.geo-ph]. Université Paris-Est, 2016. English. �NNT : 2016PESC1120�. �tel-01542407�
ANALYSIS OF LONG-TERM CLOSURE IN DRIFTS EXCAVATED IN
CALLOVO-OXFORDIAN CLAYSTONE: ROLES OF ANISOTROPY AND
HYDROMECHANICAL COUPLINGS
Thèse soumise pour l’obtention du grade de
Docteur de l'Université Paris Est
Ecole Doctorale Sciences, Ingénierie et Environnement (SIE) Spécialité : Géotechnique
présentée le 9 décembre 2016 à Champs-sur-Marne par
Lina María GUAYACAN CARRILLO
JURY
Pr. Fréderic PELLET École des Mines Paris-Tech Président du Jury
Pr. Giovanni BARLA Politecnico di Torino Rapporteur
Pr. Jian-Fu SHAO Ecole Polytechnique – Université de Lille Rapporteur Pr. Georg ANAGNOSTOU Swiss Federal Inst. of Technology in Zurich Examinateur
Dr. Gilles ARMAND Andra R&D Examinateur
Pr. Jean SULEM Ecole des Ponts ParisTech Directeur de thèse Dr. Siavash GHABEZLOO Ecole des Ponts ParisTech Co-encadrant de thèse
A mi más grande tesoro:
Mi familia,
This project has been performed through a collaboration between the Geotechnical team (CERMES) of Laboratoire Navier at Ecole des Ponts ParisTech and the French National Radioactive Waste Management Agency (Andra). I would like to thank all the people who contributed to successfully accomplish this work.
First, I would like to express my immense gratitude to my supervisor Pr. Jean SULEM for his confidence in me to work in this exciting research project. Thanks for his encouragement and patience to me during the past three years. His advices and feedbacks are always the perfect combination of academic rigor and gentleness, not only helping me to significantly develop and fruitfully accomplish my work, but also acting like a light in my future research career.
I owe also my deep gratitude to my co-supervisor Dr. Siavash Ghabezloo for his thoughtful comments and strong supports, which are always the powerful backing during these three years. Thanks for teaching me the positive way to learn new things from each challenge we met.
My sincere thanks also go to my co-supervisor Dr. Darius Seyedi for always being available to answer my questions. Thanks for his valuable ideas. I really appreciate his inclusiveness and understanding of different unforeseen circumstances in my work.
It is a great pleasure for me to work with them.
This project would not have been possible without the support of Andra. I would like to thank the members of the team at Bure site for their help and supports during my stay. My special thanks go to Dr. Aurélien Noiret for providing me the necessary data collected in the Underground Research Laboratory (URL). With rich knowledge on the experimentations performed at the URL, he gave me his selfless efforts in the development of this work. And also to Dr. Gilles Armand for his various comments and the fruitful discussions, which have contributed a lot to the improvement of this work. Many thanks for accepting to evaluate this work by being a member of the jury.
I would like to give my sincere thanks to other jury members: Pr. Fréderic Pellet and Pr. Georg Anagnostou for accepting to examine this work and for the suggestions they proposed. I would like to extend my special thanks to the two referees of this dissertation: Pr. Giovanni Barla and Pr. Jian-Fu Shao. Their comments and questions give me a lot of ideas to continue my research work. Many thanks for the time they spent on reading my manuscript. It is an honor for me to have them in my jury.
In the past three years, I am happy to work in the team CERMES. They are not only colleagues, but also family members to me. Thanks for all the unforgettable moments, for their friendly welcome and their contagious happiness. This team is the best proof that teamwork is the best way to achieve excellence.
Finally, I would like to thank my family for their unconditional supports. Especially to my parents, they teach me to love what I do and give the best of me every day. To Luis Miguel, thanks for his patience, for his love and for taking care of me. Thanks for encouraging me to dip into this adventure.
vii
ABSTRACT
The French National Radioactive Waste Management Agency (Andra) began in 2000 the construction of an Underground Research Laboratory (URL) with the main goal of demonstrating the feasibility of a geological repository in Callovo-Oxfordian claystone. Several research programs have taken place to improve the knowledge of the rock properties and its response to the excavation progress. A network of experimental drifts has been constructed with variations on: excavation method, structure geometry, supports system and orientations with respect to principal stresses’ directions. In each drift different sections have been instrumented to monitor the hydro-mechanical behavior of the rock mass formation. Continuous monitoring of the excavated zone around the drifts in the main level (-490 m) revealed the development of a fractured zone (extensional and shear fractures) induced by the excavation. The extent of this fractured zone depends on the drift orientation regarding the in-situ stress field. Accordingly, the convergence measurements showed an anisotropic closure which depends also on the drifts’ orientations. Moreover, marked overpressures and an anisotropic pore pressure field around the drifts have been also observed.The approach proposed in this work is mainly based on a direct analysis of the convergence measurements, for studying the anisotropic response of the rock formation during and after excavation. The convergence evolution is analyzed on the basis of the semi-empirical law proposed by Sulem et al. (1987) [Int J Rock Mech Min Sci Geomech Abstr 24: 145–154]. The monitoring and analysis of convergence data can provide a reliable approach of the interaction between rock mass and support. Therefore, the anisotropy and the variability of the closure are analyzed taking into account different field cases: drifts excavated in two different orientations (i.e. influence of the initial stress state), different methods, sizes and rates of excavation and different supports systems with different conditions of installation. This broad range of cases permits to refine the analysis for reliable predictions of the convergence evolution in the long term. This approach can thus be used for the design of various types of support and the evaluation of its performance in the long term.
On the other hand, the pore pressure evolution induced by excavation of drifts as recorded in-situ has been analyzed. The anisotropic response observed in-situ suggests that the intrinsic anisotropy of the material plays a key role in the response of the rock formation. To understand these phenomena, an anisotropic poroelastic analysis of the pore pressure evolution induced by the drift excavation is performed. The main goal is to simulate the main trends of the pore pressure evolution with a simple model taking into account the inherent anisotropy of the material. Finally, an analysis of the onset of failure shows the key role of the hydro-mechanical coupling on the extension of the failed zone around the drifts.
viii Keywords: convergence, tunnel deformation, time-dependent behavior, anisotropy, Callovo-Oxfordian claystone, underground excavation, size effect, hydro-mechanical coupling, poroelasticity
ix
RESUME
L'Agence nationale pour la gestion des déchets radioactifs (Andra) a commencé en 2000 la construction du Laboratoire Souterrain de Meuse / Haute-Marne (LS-M/HM) avec l'objectif principal de démontrer la faisabilité d’un stockage géologique dans l’argilite du Callovo-Oxfordien. Un réseau de galeries expérimentales a été excavé, principalement en suivant les directions des contraintes horizontales (majeure et mineure), avec des variations sur : la méthode d'excavation, la géométrie de la structure et le soutènement. Chaque galerie a été instrumentée en différentes sections pour suivre le comportement hydromécanique de la roche face à l’excavation. Le suivi de la zone autour des galeries excavées au niveau principal (-490 m) a révélé le développement d'une zone fracturée (fractures en extension et en cisaillement) induite par l'excavation. La distribution de la zone fracturée dépend à la fois de l'orientation de la galerie et du champ de contraintes in-situ et a une influence importante sur la déformation des galeries. En effet, les mesures de convergence ont montré une fermeture anisotrope de la section de la galerie. De plus, il a été observé un champ de distribution anisotrope de la pression de pores ainsi que des surpressions autour des galeries.Afin d’analyser la réponse anisotrope du massif pendant l’excavation et après celle-ci, les travaux effectués dans le cadre de la thèse sont axés principalement sur une étude directe des mesures de convergence in-situ. Cette analyse s’effectue à l’aide de la loi semi-empirique proposée par Sulem et al. (1987) [Int J Rock Mech Min Sci Geomech Abstr 24: 145–154]. A cet égard, différentes galeries excavées dans le LS-M/HM ont été étudiées. Ces galeries présentent certaines différences dans leurs orientations et l’état initial des contraintes, dans la méthode et la vitesse d’excavation ainsi que dans les diamètres de la section et les types de soutènements installés. Cette analyse permet d’obtenir des prédictions fiables de la convergence à long-terme, ce qui peut servir pour le dimensionnement et la prévision de la performance du soutènement à long-terme.
En outre, nous avons étudié la réponse anisotrope du champ de pression interstitielle observée in-situ. Cette analyse est basée sur une approche poroélastique anisotrope. L’objectif principal est de reproduire qualitativement l’évolution de la pression des pores autour des galeries avec une approche simple qui prend en compte l’anisotropie intrinsèque du matériau. Enfin, une analyse de l’apparition de la rupture montre le rôle clé que joue le couplage hydromécanique dans l’extension de la zone fracturée.
Mots-clés: convergences, déformation des tunnels, comportement différé, anisotropie, argilite du Callovo-Oxfordien, excavation souterraine, effets d’échelle, couplage hydromécanique, poroelasticité
xi
PUBLICATIONS
International journals
Guayacán-Carrillo LM, Sulem J, Seyedi DM, Ghabezloo S, Noiret A & Armand G (2016). Analysis of long-term anisotropic convergence in drifts excavated in Callovo-Oxfordian claystone. Rock Mechanics and Rock Engineering, 49(1), pp 97-114. doi: 10.1007/s00603-015-0737-7.
Guayacán-Carrillo LM, Sulem J, Seyedi DM, Ghabezloo S, Noiret A & Armand G (2016). Convergence analysis of an unsupported micro-tunnel at the Meuse/Haute-Marne underground research laboratory. In: Radioactive Waste Confinement: Clays in Natural
and Engineered Barriers. Geological Society of London (GSL) Special Publication SP443. 24. doi:10.1144/SP443.24.
Guayacán-Carrillo LM, Sulem J, Seyedi DM, Ghabezloo S & Armand G (2016). Size effect on the time-dependent closure of drifts excavated in Callovo-Oxfordian claystone.
Tunnelling and Underground Space Technology. (Submitted).
Guayacán-Carrillo LM, Ghabezloo S, Sulem J, Seyedi DM & Armand G (2016). Effect of anisotropy and hydro-mechanical couplings on pore pressure evolution during tunnel excavation in low-permeability ground. International Journal of Rock Mechanics and
Mining Sciences. (Accepted).
International Conferences (peer-reviewed)
Guayacán-Carrillo LM, Sulem J, Seyedi DM, Ghabezloo S, Noiret A & Armand G (2015). Anisotropic closure analysis of a drift in Callovo-Oxfordian claystone based on in-situ convergence data. Proc. 13th ISRM Congress. Montréal, Mai 2015. ISBN 978-1-926872-25-4.
Guayacán-Carrillo LM, Sulem J, Noiret A, Seyedi DM, Ghabezloo S & Armand G (2016). Analyse de la convergence à long terme des galeries dans l’argilite du Callovo-oxfordien. Journées Nationales de Géotechnique et de Géologie de l’Ingénieur, Nancy,
Juillet 2016.
http://jngg2016.sciencesconf.org/80814/document.
Guayacán-Carrillo LM, Seyedi DM, Sulem J, Ghabezloo S, Noiret A & Armand G (2016). The effect of over excavation on the time-dependent convergence of a drift in Callovo-Oxfordian claystone. In: Ulusay et al. (eds), Rock Mechanics and Rock
Engineering: From the Past to the Future. Proc. ISRM International Symposium and EUROCK 2016, August 2016, pp 945-950. ISBN 978-1-138-03265-1.
xii Guayacán-Carrillo LM, Seyedi DM, Sulem J, Ghabezloo S, Noiret A & Armand G (2016). Tunnel excavation in low permeability ground: effect of anisotropy on excess pore pressure. In: Ulusay et al. (eds), Rock Mechanics and Rock Engineering: From the
Past to the Future. Proc. ISRM International Symposium and EUROCK 2016, August 2016, pp 463-467. ISBN 978-1-138-03265-1.
International Conferences (without proceedings)
Guayacán-Carrillo LM, Sulem J, Seyedi DM, Ghabezloo S, Noiret A & Armand G (2014). Analysis of convergence measurements in drifts in Callovo-Oxfordian Claystone.
Poster presented in 25th ALERT Workshop, Aussois, October 2014. Booklet of abstracts
ISBN 978-2-9542517-2-1.
Guayacán-Carrillo LM, Sulem J, Seyedi DM, Ghabezloo S, Noiret A & Armand G (2015). Anisotropic convergence analysis in drifts of the Meuse/haute-Marne underground research laboratory. Poster presented in 6th International Clay Conference,
Brussels, March 2015.
Guayacán-Carrillo LM, Sulem J, Ghabezloo S, Seyedi DM & Armand G (2016). Tunnel excavations in low-permeability anisotropic ground: hydromechanical couplings. Oral
xiii
TABLE OF CONTENTS
ABSTRACT ... vii
RESUME ... ix
PUBLICATIONS ... xi
TABLE OF CONTENTS ... xiii
LIST OF TABLES... xvii
LIST OF FIGURES ... xix
INTRODUCTION ... 1
The Industrial Center for Geological Disposal project (CIGEO) ... 2
Outline and presentation of the Thesis content ... 3
PART I: ANDRA’s PROJECT ... 7
1.1. The Callovo-Oxfordian claystone ... 8
1.1.1. Mineralogical composition and microstructure ... 9
1.1.2. Hydro-mechanical behavior ... 10
1.2. In-situ stress state ... 12
1.3. Excavation and support methods installed at the URL ... 14
1.3.1. Excavation methods ... 14
1.3.2. Support methods ... 15
1.4. Geotechnical instrumentations set up in the M/HM URL ... 17
1.4.1. Convergence measurements... 18
1.4.2. Extensometer measurements ... 19
1.4.3. Extrusometers ... 21
1.4.4. Pore pressure and permeability measurements ... 22
1.4.5. Support Installation monitoring ... 23
1.5. In-situ observations ... 24
1.5.1. Fracture network distribution induced by drifts excavation ... 24
1.5.2. Convergence measurements... 27
1.5.3. Radial and axial displacements measurements ... 27
1.5.4. Pore pressure and permeability measurements ... 28
1.5.5. Support monitoring ... 29
1.6. Analysis of in-situ observations: overview of existing numerical models ... 29
1.6.1. Isotropic elastic-viscoplastic models ... 30
1.6.2. Damage models ... 32
1.6.3. Discrete elements based method ... 33
1.6.4. A two-scale computational homogenized model... 34
1.6.5. Discussion ... 35
1.7. Conclusions ... 37
PART II: LONG-TERM ANISOTROPIC CLOSURE IN DRIFTS ... 39
xiv 2.1.1. GCS drift... 40 2.1.2. GCR drift ... 41 2.1.3. GED drift ... 41 2.1.4. GRD4 drift ... 42 2.1.5. GRM3 drift ... 43 2.1.6. ALC1603 micro-tunnel ... 44 2.2. Convergence law ... 49
2.2.1. Tunnel face advance effect ... 49
2.2.2. Time-dependent behavior ... 50
2.2.3. General form of the convergence semi-empirical law ... 50
2.3. Analysis of the convergence evolution for a representative supported drift in each direction of excavation ... 51
2.3.1. In-situ observations ... 51
2.3.2. Analysis of the convergence evolution in a drift following the direction of
H ... 532.3.3. Comparison with a drift following the direction of h and discussion of the results ... 58
2.3.4. Model validation ... 63
2.3.5. Preliminary conclusions ... 66
2.4. Analysis of the convergence evolution for an unsupported micro-tunnel ... 67
2.4.1. In-situ observations ... 68
2.4.2. Analysis of the horizontal convergence of a micro-tunnel following the direction ofH 69 2.4.3. Convergence evolution along the vertical axis of deformation ... 71
2.4.4. Preliminary conclusions ... 73
2.5. Size effect on the convergence evolution ... 74
2.5.1. In-situ observations ... 74
2.5.2. Analysis of the convergence evolution ... 77
2.5.3. Discussion of the results ... 80
2.5.4. Preliminary conclusions ... 82
2.6. Effect of an enlargement of cross section on the convergence evolution ... 82
2.6.1. Analysis of the convergence evolution in GRM3-stage 2 ... 82
2.6.2. Comparison with parallel drifts ... 83
2.6.3. Preliminary conclusions ... 85
2.7. Influence of the convergence on the support load ... 85
2.7.1. Analysis of load support evolution in GCS and GCR drifts ... 85
2.7.2. Analysis of load support evolution in GRD4 drift ... 88
2.7.3. Preliminary conclusions ... 92
2.8. Conclusions ... 93
PART III: PORE PRESSURE EVOLUTION INDUCED BY DRIFTS EXCAVATION ... 95
3.1. In-situ pore pressure measurements ... 95
3.2. Poro-elasticity framework ... 97
3.3. Influence of the cross-anisotropy of rock formation on the short-term ground response ... 101
3.3.1. Anisotropy of the hydro-mechanical properties of the rock mass formation ... 102
3.4. Time evolution of the pore pressure distribution around drifts ... 108
xv 3.6. Conclusions ... 115
CONCLUSIONS ... 117
Outlooks ... 120REFERENCES ... 123
APPENDIX ... 135
A – Analysis of the convergence evolution in drifts ... 135
A.1 – Optimization method ... 135
A.2 – Convergence evolution obtained in different sections of GCS drift ... 136
A.3 – Convergence predictability analysis in different sections of GCS drift ... 137
A.4 – Convergence predictability analysis in different sections of GED drift ... 138
A.5 – Variations on the extent of fracture distribution around different drifts following the direction of H ... 139
A.6 – Monitoring of the shotcrete deformation evolution in time at the drift intrados ... 140
B – Analysis of the pore pressure evolution around drifts ... 141
B.1 – Validation of the numerical model ... 141
B.2 – In-situ observations of the pore pressure changes around excavations (from Armand et al. 2015b) ... 144
xvii
LIST OF TABLES
Part I
Table 1. 1. Mineralogical composition at the main level of the URL (Gaucher et al. 2004; Andra 2005)... 9
Table 1. 2. Characteristics of the Callovo – Oxfordian claystone at -490 m (adapted from Armand et al. 2014) ... 10
Table 1. 3. Average extent of fracture distribution around drifts – distance related to the drift diameter (adapted from Armand et al. 2014) ... 27
Table 1. 4. Summary of the different models used in the framework of a benchmark exercise for the Callovo-Oxfordian Claystone (adapted from Seyedi et al. 2016) ... 36
Part II Table 2. 1. Characteristics of studied drifts in the M/HM URL ... 45
Table 2. 2. Description of support installed in each drift and its monitoring sections ... 46
Table 2. 3. Geotechnical instrumentation of studied drifts in the M/HM URL ... 47
Table 2. 4. Parameters of the fitted ellipse for GCS drift... 55
Table 2. 5. Numerical values of the convergence law parameters in GCS drift ... 56
Table 2. 6. Parameters of the fitted ellipse for GED drift ... 58
Table 2. 7. Numerical values of the convergence law parameters in GED drift ... 59
Table 2. 8. Parameters of the fitted ellipse for GCR drift ... 64
Table 2. 9. Numerical values of the convergence law parameters in GCR drift (fitted on 40 days of monitoring convergence) ... 64
Table 2. 10. Numerical values of the convergence law parameters in GCR drift (fitted on six months of monitoring convergence) ... 66
Table 2. 11. Numerical values of convergence law parameters in ALC1603 micro-tunnel ... 70
Table 2. 12. Numerical values of convergence law parameters in GRM3-stage1 drift ... 77
Table 2. 13. Numerical values of convergence law parameters in GRD4 drift ... 80
Table 2. 14. Comparison of numerical values of convergence law parameters in different drifts ... 81
Table 2. 15. Numerical values of convergence law parameters in GRM3-stage 2 drift ... 83
Table 2. 16. Convergence to diameter ratio. Comparison between GRM3-stage 2 and GCS drifts ... 84
Table 2. 17. Horizontal convergence and hoop stress measurements in the upper part of the drift cross section ... 91
Table 2. 18. Hoop stress measurements (35 to 350 days) and predictions (up to 350 days) at the upper part of the drift (considering a linear behavior of the support) ... 92
Part III Table 3. 1. Mechanical and hydraulic parameters for the 2D model ... 102
Table 3. 2. Mechanical and hydraulic parameters, considering the anisotropy of the Biot’s coefficient ... 107
Table 3. 3. Mohr-Coulomb failure criterion parameters (Andra database) ... 110
Table 3. 4. Tensile strength values (Andra database) ... 111
Table 3. 5. Extension of failure zone around drifts... 113
Annexes Table A. 1. Average extent of lateral fracture distribution around different drifts studied – distance related to the drift diameter... 139
Table B. 1. Elastic mechanical and hydraulic parameters. Comparison between numerical and analytical solutions .. 141
Table B. 2. Elastic mechanical and hydraulic parameters. Comparison between numerical simulations in FreeFem++ and Code-Aster ... 143
xix
LIST OF FIGURES
Introduction
Fig. I. 1. Schema of CIGEO: Industrial Center for Geological Disposal (adapted from Armand et al. 2015a) ... 3
Part I Fig. 1. 1. URL drifts network 2004-2016 (from Seyedi et al. 2016) ... 7
Fig. 1. 2. Mineral groups distribution of the Callovo-Oxfordian Claystone, obtained from X-ray tomography (from Robinet et al. 2012) ... 9
Fig. 1. 3. Results obtained from different samples of Callovo-Oxfordian claystone: a. Triaxial tests (from Armand et al. 2016). b. Uniaxial creep tests (from Zhang et al. 2010) ... 12
Fig. 1. 4. Stress determination results at the M/HM URL (from Cornet et al. 2012) ... 13
Fig. 1. 5. Different excavation methods: a. Pneumatic hammering machine. b. Road header machine. c. Road header under shield machine. d. Micro-tunnel boring machine ... 14
Fig. 1. 6. Flexible support installation: a. Support with yieldable concrete wedges (GCS drift). b. Support with sliding arches (GED drift) ... 16
Fig. 1. 7. Rigid support installation: a. Support of 45 cm of fiber shotcrete (BEP drift). b. Support with 20 cm of fiber shotcrete and a permanent lining installation 7 months after (GCR drift). c. Support composed of rings of prefabricated segments (GRD4 drift) ... 17
Fig. 1. 8. Micro-tunnels after excavation. a. with casing. b. without casing ... 17
Fig. 1. 9. Convergence measurement sections for two different drift geometries ... 18
Fig. 1. 10. Instrumentation of a convergence measurement section in ALC1603 micro-tunnel. At left: schematic picture of the convergence measurement section (SMC). At right: Photo of the installation of the SMC. The convergence measurements are performed in the vertical (01-05), horizontal (03-07) and transverse (02-06 and 04-08) directions . 19 Fig. 1. 11. Extensometers in a reinforced measurement section: example of GCS drift ... 20
Fig. 1. 12. Instrumentation of mine-by experiment (Armand et al. 2011) ... 21
Fig. 1. 13. Reverse head extensometer installation ... 21
Fig. 1. 14. Measurement chamber of a PP system (from Armand et al. 2015b) ... 22
Fig. 1. 15. Measurement section to follow the yieldable concrete wedges. The gadgets have been installed in four different zones around the drift cross section. Each zone is composed of one potentiometer (left) and one pressure cell (right) ... 23
Fig. 1. 16. Implementation of measurements gadgets in the segments before the concrete is poured ... 24
Fig. 1. 17. Fractured zone induced by the excavation: a. for drifts parallel to H- N155°E. b. for drifts parallel to h – N65°E (from Armand et al. 2014) ... 26
Fig. 1. 18. 3D visualization of fractures network for drifts parallel to H - N155°E (adapted from Armand et al. 2014) ... 26
Fig. 1. 19. Extensions of hydraulic permeability (left) and fracture zones (right) measured around GED drift (4.6 m diameter) parallel to the minor horizontal principal stress h (from Pardoen 2015) ... 29
Fig. 1.20. Shear band type at the end of drift excavation. Results obtained fort he case of: a. A drift following the direction of h. b. A drift following the direction of H (adapted from Pardoen 2015) ... 31
Fig. 1. 21. Horizontal pore pressure evolution. In-situ measurements are represented with continuous lines and simulation results with dashed lines (adapted from Mánica et al. 2016) ... 32
Fig. 1. 22. Fracture patterns for a. A drift following the direction of h. b. A drift following the direction of H. Tensile cracks are represented by blue color and shear cracks by pink color (adapted from Yao et al. 2016b) ... 34
Fig. 1. 23. Deformations and pore pressure fields around a drift following the direction of h. Simulation performed at 28 days (adapted from van den Eijnden et al. 2016b)... 34
Part II Fig. 2. 1. GCS support section: distribution of bolts and compressible wedges around the drift perimeter ... 40
Fig. 2. 2. GCR section. Flexible support (left) and final lining installed after 7 months (rigth) ... 41
xx
Fig. 2. 4. GRD4 support section ... 43
Fig. 2. 5. GRM3 support section: a. Stage 1. b. Stage 2. c. Cross section showing the first stage and the enlargement of the cross section ... 44
Fig. 2. 6. State of the ALC1603 micro-tunnel wall (adapted from Morel et al. 2013). At left: Photo after the end of excavation. At right: typical profile of the micro-tunnel wall after excavation ... 45
Fig. 2. 7. Convergence evolution in drifts of the URL: a. GCS drift excavated along H; b. GED drift excavated along h ... 52
Fig. 2. 8. Local coordinates at the M/HM URL ... 54
Fig. 2. 9. Identification of the main axes of deformation ... 54
Fig. 2. 10. Convergence evolution in GCS drift. Left side: as function of time, Right side: as function of the distance to the face. Vertical and Horizontal convergence data as obtained by fitting an ellipse on the deformed drift section are represented with symbols. Convergence prediction as given by the convergence law (eq. 2.6 and eq. 2.8) is represented with continuous lines ... 57
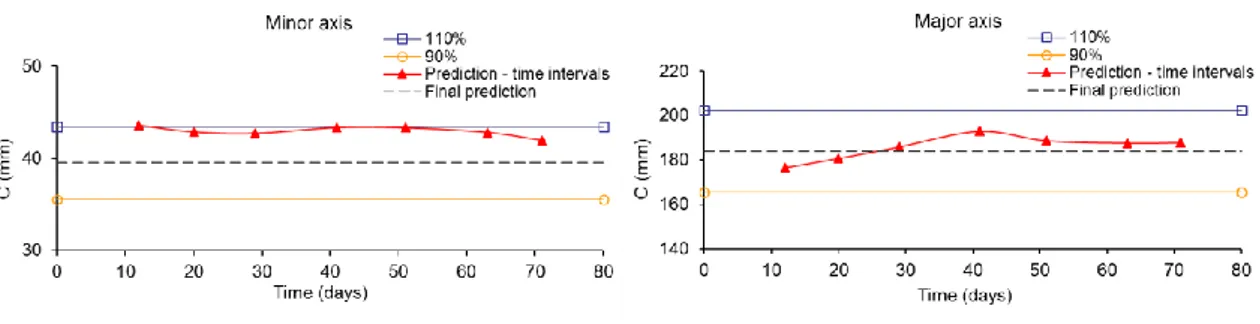
Fig. 2. 11. Final convergence predictions in a section of GCS drift as a function of the duration of the monitoring ... 58
Fig. 2. 12. Ellipse evolution in GED drift ... 59
Fig. 2. 13. Convergence evolution in GED drift. Left side: as function of time, Right side: as function of the distance to the face. Vertical and Horizontal convergence data as obtained by fitting an ellipse on the deformed drift section are represented with symbols. Convergence prediction as given by the convergence law (eq. 2.6 and eq. 2.8) is represented with continuous lines ... 60
Fig. 2. 14. Final convergence predictions in a section of GCS drift as a function of the duration of the monitoring ... 61
Fig. 2. 15. Radial displacement in GCS drift obtained from extensometer data (L - distance to GCS wall) ... 61
Fig. 2. 16. Radial displacement in GCS drift. Comparison between displacement obtained by the convergence law and displacement obtained from the extensometer data. The extensometer data are reinterpreted by subtracting the initial displacement which occurs prior to the excavation of the section... 62
Fig. 2. 17. Radial displacement in GCS drift. – Results based on the convergence prediction as given by the convergence law (eq. 2.6 and eq. 2.8) compared to results obtained from Armand et al. 2013 (a. Instantaneous response. b. Delayed response). The results from Armand et al. 2013 are reinterpreted by subtracting the initial displacement which occurs prior to the excavation of the section ... 63
Fig. 2. 18. Convergence evolution in GCR drift. Left side: as function of time, Right side: as function of the distance to the face. Vertical and Horizontal convergence data as obtained by fitting an ellipse on the deformed drift section are represented with symbols. Convergence prediction as given by the convergence law (eq. 2.6 and eq. 2.8) is represented with continuous lines. Fitting of Cxis performed on the 40 first days of data ... 65
Fig. 2. 19. Convergence evolution in ALC1063 micro-tunnel. (Recorded in the convergence measurement section at PM 12 from the entrance of the drift) ... 68
Fig. 2. 20. Convergence evolution in ALC1603 micro-tunnel. Left side: Horizontal convergence evolution, Right side: Vertical convergence evolution ... 69
Fig. 2. 21. Horizontal convergence evolution in ALC1603 micro-tunnel. Convergence data are represented with dashed lines. Convergence prediction as given by the convergence law (eq. 2.9 and eq. 2.10) is represented with continuous lines. (Time-dependent response) ... 70
Fig. 2. 22. Induced fracture distribution around micro-tunnel ALC3005. It is observed the elliptical fracture distribution around the opening, with a larger extension in the horizontal direction. In the ascending vertical direction is observed the breakouts induced by the excavation ... 71
Fig. 2. 23. Convergence rate for vertical and horizontal evolution in ALC1603 micro-tunnel ... 72
Fig. 2. 24. Vertical convergence rate evolution for ALC1603 and ALC3005 micro-tunnels ... 73
Fig. 2. 25. Convergence evolution in GRM3 drift: a. GRM3-stage 1. b. GRM3-stage 2 ... 75
Fig. 2. 26. Radial displacement recorded for GRD4. Support_step1 is the time when the support installation began. Support_step2 is the time when the entire support is completed and functional ... 76
Fig. 2. 27. Convergence evolution in GRM3-stage1 drift. Left side: as a function of time, Right side: as function of the distance to the face. Vertical and horizontal convergence data as obtained by fitting an ellipse on the deformed section are represented with symbols. Convergence prediction as given by the convergence law (eq. 2.6 and eq. 2.8) is represented with continuous lines ... 78
Fig. 2. 28. Horizontal convergence evolution in GRD4 drift. Left side: as a function of time, Right side: as function of the distance to the face. Recorded data are represented with symbols. Convergence prediction as given by the convergence law is represented with continuous lines (before the support installation) and with dashed lines (after the support installation) ... 80
xxi
Fig. 2. 30. Convergence evolution in GRM3-stage 2 drift. Left side: as a function of time, Right side: as function of the
distance to the face. Convergence data as obtained by fitting a circle on the deformed section are represented with symbols. Convergence prediction as given by the convergence law is represented with continuous lines ... 83
Fig. 2. 31. Convergence evolution to diameter of drift ratio. Comparison of GRM3-stage 2 with GRM3-stage 1 and GCS
drifts, based in the convergence predictions obtained. Left side: horizontal convergence evolution, Right side: vertical convergence evolution ... 84
Fig. 2. 32. Stress-strain curve for yieldable concrete wedges... 86 Fig. 2. 33. In-situ measurements performed for the yieldable concrete wedges installed in GCS drift. Load (left) and
deformations (right) followed by the wedges. Section OHZ1771 (in full line) and OHZ1770 (in dotted line) are located in PM 47.5 and PM 29.5, respectively) ... 87
Fig. 2. 34. In-situ measurements performed for the yieldable concrete wedges installed in GCS drift section OHZ1770.
Load (left) and deformations (right) around of drift as a function of time... 87
Fig. 2. 35. Flat jack system measurements: a. In GCS drift; b. In GCR drift, zone without yieldable concrete wedges ... 88 Fig. 2. 36. Hoop strain (up) and stress (down) measured at GRD4 drift in the zone with classic mortar. Measurements
have been performed at the extrados (left) and intrados (rigth) of the support. The ceiling is considered as the initial angle 0° and the floor as 180°. The traction strain is considered as positive. And, also positive values are given for compression load ... 89
Fig. 2. 37. Convergence rate evolution in time. Comparison performed based in the convergence predictions obtained
by using the semi-empirical law (eq. 2.6 and eq. 2.8) ... 90
Fig. 2. 38. Hoop stress at the upper part of the drift cross section ... 91
Part III
Fig. 3. 1. Pore pressure evolution in the horizontal direction of the drift cross section. Measurements recorded during
GCS excavation (adapted from Armand et al. 2011). d: distance to the drift wall. PM: metric point from the entrance of the drift ... 97
Fig. 3. 2. Pore pressure evolution in the vertical direction of the drift cross section. Measurements recorded during GCS
excavation (adapted from Armand et al. 2011). d: distance to the drift wall. PM: metric point from the entrance of the drift ... 97
Fig. 3. 3. Initial conditions for two-dimensional numerical model (x,0 and y,0 are the initial stress state in
horizontal and vertical directions of the drift cross section; and p0 is the initial pore pressure) ... 101 Fig. 3. 4. Instantaneous pore pressure change induced by an instantaneous excavation in drained conditions: a. Case of
a drift following the direction of H. b. Case of a drift following the direction of h. Left side: horizontal pore
pressure evolution, Right side: vertical pore pressure evolution ... 103
Fig. 3. 5. Instantaneous pore pressure response, for various ratios of the Young’s modulus in x and y direction
(Ex/Ey): a. Case of a drift following the direction of H. b. Case of a drift following the direction of h. Left side:
horizontal pore pressure evolution, Right side: vertical pore pressure evolution ... 104
Fig. 3. 6. Instantaneous pore pressure response (at t = 1 second), depending on the Biot’s coefficient: a. Case of a drift
following the direction of H. b. Case of a drift following the direction of h ... 106
Fig. 3. 7. Instantaneous pore pressure response for the three cases studied: a. Case of a drift following the direction of
H
. b. Case of a drift following the direction of h. Left side: horizontal pore pressure evolution, Right side: vertical
pore pressure evolution ... 106
Fig. 3. 8. Pore pressure evolution in time: a. Case of a drift following the direction of H. b. Case of a drift following
the direction of h. Left side: horizontal pore pressure evolution, Right side: vertical pore pressure evolution ... 108
Fig. 3. 9. Comparison of instantaneous pore pressure response to instantaneous excavation, in undrained and drained
boundary conditions (at t = 1 second): a. Case of a drift following the direction of H. b. case of a drift following the
direction of h ... 109
Fig. 3. 10. Major and minor principal effective stress (1 and 3) in the horizontal, vertical and diagonal directions
of the drift cross section for a drift following the orientation of H: a. Case 8. b. Case 7. c. Case 6. The Fairhurst’s
failure criterion is represented with continuous lines and the Mohr-Coulomb failure criterion is represented with dashed lines. Continuity of the slope between the two failure criterion is imposed ... 111
Fig. 3. 11. Major and minor principal effective stress (1 and 3) in the horizontal, vertical and diagonal directions
xxii
failure criterion is represented with continuous lines and the Mohr-Coulomb failure criterion is represented with dashed lines. Continuity of the slope between the two failure criteria is imposed ... 112
Fig. 3. 12. Extension of the failure zone around the drifts. a. Case 8. b. Case 7. c. Case 6. Left side: case of a drift
following the orientation of H, Right side: case of a drift following the direction of h ... 114
Annexes
Fig. A. 1. Convergence evolutions in sections of GCS drift. Left side: as function of time, Right side: as function of the
distance to the face. (Ch = horizontal convergences; Cv = vertical convergences) ... 136 Fig. A. 2. Final convergence predictions in GCS drift as a function of the duration of the monitoring... 137 Fig. A. 3. Final convergence predictions in GED drift as a function of the duration of the monitoring ... 138 Fig. A. 4. Fracture distribution observed in GRD4 drift ... 139 Fig. A. 5. Fracture distribution observed in GRM3 drift (adapted from Noiret et al. 2015) ... 139 Fig. A. 6. Deformation (microdef) evolution as a function of time at GCS drift cross section (Andra database) ... 140 Fig. A. 7. Deformation (microdef) evolution as a function of time at GCR drift cross section. Section without yieldable
concrete wedges (Andra database) ... 140
Fig. B. 1. Problem definition (adapted from Detournay and Cheng 1988). 0 and s0 are the far-field mean stress and
stress deviator, respectively; p0 the initial pore pressure; r and are the polar coordinates; and R the excavation radius
... 141
Fig. B. 2. Pore pressure response and displacements obtained for an instantaneous response. Comparison between the
numerical simulation and the analytical solution proposed by Detournay and Cheng (1988) ... 142
Fig. B. 3. Pore pressure evolution with time. Comparison between the numerical simulation and the analytical solution
proposed by Detournay and Cheng (1988) ... 142
Fig. B. 4. Response after one hour for an excavation in drained conditions. Comparison between a simulation
performed in FreeFem++ and a similar simulation performed in Code_Aster. a. Pore pressure evolution in the horizontal (0°) and vertical (90°) direction of the drift cross section. b. Radial and tangential effective stresses obtained in the vertical direction (90°) of the drift cross section ... 143
Fig. B. 5. Maximum over-pressure measured at the wall side of different diameter openings: drift of 5 m diameter,
micro tunnel of 0.7 m diameter and borehole of 0.15 m diameter (d: distance to the wall, diameter of the drift). (Fig. 11 from Armand et al. 2015b) ... 144
Fig. B. 6. Long-term pore pressure evolution : (a) in borehole OHZ1524 on GCS side wall, (b) in borehole OHZ1522
above GCS (PM is the location of the front as function of time, d is the distance of the chamber to final drift wall, colored dash line is the date when front face cross the section of the pore pressure measurement ) (Fig. 7 from Armand et al. 2015b) ... 144
1 The radioactive waste disposal has been a key issue for several years in France. Thousands of cubic meters of radioactive wastes are produced each year. Nowadays, about 90% of the total wastes (mainly Low and intermediate level, short-lived radioactive wastes (LILW-SL) and Very-low-level wastes (VLLW)) are managed in France by existing disposal centers (e.g. CSA (Centre de stockage de l’Aube), Cires (Le Centre industriel de regroupement, d'entreposage et de stockage)). However, the other wastes, among them the High level wastes (HLW) and Intermediate level – Long lived wastes (IL-LLW), cannot be disposed in the centers at the surface for safety reasons (Andra 2013a). Therefore, an appropriate solution is required for these types of waste.
Deep geological formations with favorable characteristics for the radioactive waste disposal are considered to be a good alternative and a safe solution in France and in other countries (e.g. Belgium, Canada, Switzerland, Sweden…), where Underground Research Laboratories (URL) have been implemented in order to demonstrate the feasibility of constructing and operating a radioactive waste disposal facility within a geological formation (NEA 2001). As explained by Delay et al. (2014), experiments in the URLs meet to sets of needs: (a) characterization, that is, acquiring knowledge of the geological, hydro-geological, geochemical, structural and mechanical properties of the host rock and of its response to perturbations; and (b) construction and operation, that is, developing equipment to acquire know-how about the construction of all the components of a disposal facility up to its closure, and the emplacement and/or retrieval of the waste.
The law of 30 December 1991 has formally assigned the French national radioactive waste management agency (Andra: Agence Nationale pour la gestion des déchets radioactifs) the mission to analyze the feasibility of a geological repository in deep geological formation (Andra 2005). After several years of research, the Callovo-Oxfordian claystone has been chosen as the potential geological barrier for the disposal of HL and IL-LL wastes. This formation presents favorable characteristics considering its very low permeability, small molecular diffusion and significant retention capacity for radionuclide (Andra 2005, Armand et al. 2013). In 2000, Andra began the construction of the Meuse/Haute-Marne Underground Research Laboratory (M/HM URL) at Bure (East of Paris sedimentary basin) with the main goal of demonstrating the feasibility of geological repository in Callovo-Oxfordian claystone. As explained by Armand et al. (2015a), the main goal of the first research phase (2000-2005) was to characterize the confining properties of the clay through in-situ hydrological tests, chemical measurements and diffusion experiments. Moreover, this first phase aimed to demonstrate that the construction and
2 operation of a geological repository would not introduce pathways for radionuclides migration (Delay et al. 2007). Then, since 2005, the research program is more dedicated to technologies improvement and demonstration issues of the different disposal systems, even if characterization studies are still ongoing (Armand et al. 2015a).
The design of the geological repository presents different strategic issues related to the justification of different adopted decisions and the demonstration of the feasibility and safety after the repository closure (i.e. for thousands of years). To meet these requirements and the reversibility during about 100 years, the design of the CIGEO facility (Industrial center for geological disposal / Centre Industriel de Stockage Géologique) needs to be based on an iterative process considering: the knowledge acquisition, phenomenological modeling and engineering approaches, as explained by Ozanam et al. (2016). For that purpose, the M/HM URL plays a key role in the knowledge acquisition. Thereby, in 2006 a step by step approach has been initiated (Armand et al. 2015a), which is carried out based on comparison of hydro-mechanical behavior of drifts excavated with variations on: excavation method, structure geometry, supports system and orientations with respect to the principal stresses’ directions. Each drift excavation is an experiment in itself and is used to characterize the response of the rock to different drift construction methods.
The Industrial Center for Geological Disposal project (CIGEO)
CIGEO is conceived to give definitive and passive safety for the radioactive HL and IL-LL wastes, at about 500 m depth in a claystone formation. It is composed of different types of excavations as presented in Fig. I.1 (i.e. Shafts for construction and ventilation, ramps for waste packages and general service, drifts for the IL-LL waste disposal zone, drifts for HL waste disposal zone). For the IL-LL wastes, the drifts will be excavated with a size between 9 to 11 m, where precast concrete rectangular containers (containing the IL-LLW) will be stored. Concerning the HL wastes, vitrified HL waste Stainless Canister (primary waste) will be placed in thick steel overpacks, which at its turn will be placed in horizontal micro-tunnels with a diameter of about 0.7 m (Andra 2009; Armand et al. 2015a).
Most of these drifts will be exploited for more than hundred years. Therefore, nonstop service continuity is required without human intervention for drifts maintenance. One of the main issues is to determine the optimal size, excavation and support methods for each drift depending on the duties attributed to each one. CIGEO design and development are performed in an incremental way. Cells will be added progressively as the operation progresses until they reach a total maximum area of about 15 km2, after about 100 years. The ulterior drifts will be adapted and
3 optimized according to the feedback obtained from the monitoring and follow-up of the first drifts excavated. CIGEO will be placed in the area near the M/HM URL. The installations will be progressively built, operated and finally closed over a period of roughly 150 years (Armand et al. 2015a).
Fig. I. 1. Schema of CIGEO: Industrial Center for Geological Disposal (adapted from Armand et al. 2015a)
Outline and presentation of the Thesis content
An important part of the knowledge acquired about the host rock behavior and its response to the excavation works is obtained by means of the research performed at the M/HM URL, which gives a feedback on the underground excavations in the Callovo-Oxfordian claystone for more than 10 years. The research program has been mainly related to: the characterization of the thermo-hydro-mechanical behavior of the rock mass formation; the analysis of the hydro-thermo-hydro-mechanical response of the rock mass to drift and shaft excavations (short- and long-term behavior); the characterization of the Excavation Damaged Zone (EDZ) developed around drifts; the interaction between the rock and the support and also the support response. This research aims at identifying, understanding and modeling the physical processes to give valuables insights for the optimization of CIGEO design.
In-situ observations show that the response of the Callovo-Oxfordian claystone to the excavation works depends on different features including the initial stress state, the intrinsic anisotropy of the material, the excavation method…. A remarkable in-situ observation is the anisotropic response which is mainly evidenced in: the extension of the induced fracture network, the drifts closure and the pore pressure field around drifts. Within this context, the present work addresses the question
4 of the anisotropic closure of drifts by means of a direct and extensive analysis of the in-situ measurements.
This dissertation is structured in three parts:
Part I: The first part describes the Meuse/Haute-Marne Underground research laboratory (M/HM URL). First the hydro-mechanical properties of the Callovo-Oxfordian claystone are summarized. Then, the excavation and support methods used in the construction of the different experimental drifts are described. An overview of the drifts installations and the set up for the performed hydro-mechanical measurements are described in detail and the in-situ observations at the M/HM URL are summarized. Finally, an overview of the existing models for the characterization of the rock mass behavior and the response to the excavation progress is presented.
Part II: The anisotropic closure evolution of different drifts, excavated at the M/HM URL, is analyzed based on a direct analysis of the convergence measurements using the semi-empirical law proposed by Sulem et al. (1987). The influence of the different excavation and support methods, of the size and of the rate of excavation on the anisotropic closure of the drifts are studied. The analysis is performed taking into account the effect of the following parameters on the time-dependent behavior of the ground: the direction of excavation (i.e. influence of the initial stress state), the excavation size (from 0.7 m to 6.3 m), the supports systems and time delayed for its installation, the excavation rate and also the influence of the drift cross section enlargement. The analysis is extended to the study of the radial displacements of the ground around the drifts recorded by the extensometers. This extensive treatment of the recorded data allows for reliable predictions of the convergence evolution in the long term. Based on the data obtained by the monitoring of supports, the interaction between the rock mass and support is analyzed. It is shown that this approach can provide useful information for the design of supports.
Part III: One important point to analyze is the role of hydromechanical couplings on the anisotropic response of the rock formation. Considering the in-situ observations of an anisotropic pore pressure field around drifts, the main goal of this part is to analyze the pore pressure evolution induced by drifts excavation. This is done by means of a fully coupled 2D finite element simulation in the framework of anisotropic poroelasticity. The objective is to simulate the main trends of the pore pressure evolution with a simple model taking into account the inherent anisotropy of the material. Special attention is paid to the drifts following the direction of the major principal horizontal stress, where even with a quasi-isotropic initial stress state in the cross section of the drift, the pore pressure field and the mechanical response are anisotropic. These observations indicate that the intrinsic anisotropy of the material plays a key role in the coupled
5 response of the rock formation. Finally, an analysis of the onset of failure demonstrates the importance of the hydro-mechanical coupling on the extension of the failed zone around the drifts.
7 In 2000, the French National Radioactive Waste Management Agency (Andra) began the construction of the Meuse/Haute-Marne Underground Research Laboratory (M/HM URL) at Bure (East of Paris sedimentary basin) with the main goal of demonstrating the feasibility of geological repository in Callovo-Oxfordian claystone. Several research programs have taken place to improve the knowledge of the rock properties and its response to the excavation progress. A full understanding of the short and long-term response of the rock mass formation and the interaction with the support system is important to optimize the design of nuclear waste repository in claystone host rock (Noiret et al. 2015). To this aim, a network of experimental drifts (with diameters ranging between 4 m and 9 m) has been excavated with different choices on: the excavation method, the structure geometry, the supports system and the orientations with respect to in-situ principal stresses’ directions. Then, from these experimental drifts, micro-tunnels (with a diameter of about 0.7 m) have been excavated to test the feasibility of disposal cells for high level waste (HLW) and Intermediate level - Long lived (IL-LL) waste packages and its impact on the surrounding rock (Renaud et al. 2010). Fig.1.1 presents the network of drifts excavated until now and the projection for the currently year. It should be noted that, at the main level of URL, most of the drifts are excavated following horizontal principal stresses.
8 In each drift, different sections have been instrumented to monitor and characterize the excavation-induced deformation and the hydromechanical response of the rock mass formation during and after excavation. Continuous monitoring of the excavated zone around the drifts revealed the development of a fractured zone (extensional and shear fractures) induced by the excavation. The extent of this fractured zone depends mainly on the drift orientation regarding the in-situ stress field (Armand et al. 2014). Indeed, for the drifts excavated along the major principal horizontal stress ( ) the fracture network is developed mainly in the horizontal direction of the H
cross section, while for the drifts excavated along the minor principal horizontal stress ( ), it is h
mainly developed in the vertical direction. The fractures' distribution has an important influence on the convergence of the drifts. The measurements show an anisotropic closure, which depends on the drifts' orientations and an evolution in time of the deformation. For the drifts excavated along , the ratio of the vertical closure to the horizontal one is about 0.5, whereas it is about 4 H
for the drifts excavated along (Armand et al. 2013). Moreover, the field monitoring during the h
excavation showed marked overpressures and an anisotropic pore pressure field around the drifts.
The main goal of Part I of this thesis is to give a detailed description of the characteristics of the Callovo-Oxfordian claystone (section 1.1), the in-situ stress state (1.2) and of the excavations and supports methods used in the construction of the different experimental drifts at the URL (section 1.3). We shall also present an overview of the drifts installations and the set up for the hydro-mechanical measurements performed at the URL (section 1.4), of the in-situ observations (section 1.5) and of the existing models for the characterization of the rock mass behavior and the response to the excavation progress (section 1.6).
1.1. The Callovo-Oxfordian claystone
The Callovo-Oxfordian Claystone (COx) is an argillaceous formation, lying between depths of 420 and 550 m in Meuse/Haute-Marne region in France (Fig. 1.4). This formation is interbedded between Dogger limestone formation (224 m thick layer below) and Oxfordian limestone formation (212 m thick layer above), all of which are sub-horizontal (dip smaller than 3°) (Cornet et al. 2012). The COx claystone has been studied for more than one decade as a potential host formation for High level (HL) and Intermediate level - Long lived (IL-LL) nuclear waste. Considering its very favorable characteristics like a very low hydraulic conductivity, a small molecular diffusion and a significant retention capacity for radionuclides (Andra 2005, Armand et al. 2013) it is considered as a reliable host rock formation. Some principal characteristics of the COx are summarized in this section.
9
1.1.1. Mineralogical composition and microstructure
In the literature the mineralogical composition for the COx claystone is presented by several authors (e.g. Sammartino et al. 2003; Yven et al. 2007; Robinet et al. 2008) and have been studied taking into account different scales of interest (i.e. microscopic [<
m
], mesoscopic [
m cm
], macroscopic [cm dm
], and formation scale [>dm
], Robinet 2008 and Andra 2013b). As explained by Gaucher et al. (2004) and Andra (2005), the mineralogical composition of the host rock varies slightly within the stratigraphic levels.The mineralogical composition at the main level of the URL (-490 m) is presented in Table 1.1. The clay minerals composition is relatively constant with 55 % I/S (illite–smectite interstratified minerals), 30% illite and 15% kaolinite and chlorite. Fig. 1.2 presents a three-dimensional distribution of minerals groups in the COx claystone, based on the observations obtained from the X-ray tomography (Robinet et al. 2012).
Table 1. 1. Mineralogical composition at the main level of the URL (Gaucher et al. 2004; Andra 2005)
Tectosilicates 20 %
Carbonates 20 - 25 %
Clay minerals 50 - 55 %
Subordinate pyrite and iron oxides 3 %
Fig. 1. 2. Mineral groups distribution of the Callovo-Oxfordian Claystone, obtained from X-ray tomography
(from Robinet et al. 2012)
Studies on the Callovo-Oxfordian claystone microstructure (e.g. Chiarelli 2000; Sammartino et al. 2003; Yven et al. 2007; Song et al. 2015; Robinet JC et al. 2015) show a very small mean pore diameter of about 0.02 m. Therefore, the claystone has a low permeability ( 20
5 10
to 21
5 10 m2) at the main level of the URL. The rock porosity at this level is between 14 and 21% with an
10
1.1.2. Hydro-mechanical behavior
The hydromechanical characterization of the Callovo-Oxfordian claystone is presented in the literature by several authors (e.g. Chiarelli 2000; Chiarelli et al. 2003; Escoffier et al. 2002; Bemer et al. 2004; Homand et al. 2006; Hoxha et al. 2007a; Hu et al. 2014; Menaceur et al. 2016). The main characteristics of the Callovo-Oxfordian claystone at the main level of the M/HM URL are presented in Table 1.2.
Table 1. 2. Characteristics of the Callovo – Oxfordian claystone at -490 m (adapted from Armand et al. 2014)
Microstructure and hydraulic properties
Mean pore diameter 0.02 m
Porosity 18 ± 1 %
Water content 5 and 8 %
Permeability 20
5 10
to 5 10 21 m2
Solid grains density 2.39 g/cm3
Poroelastic properties
Young modulus 40001470
Poisson ratio 0.290.05
Biot’s coefficient 0.60
Sedimentation has led to a slightly anisotropic behavior of the claystone. As explained by Blümling et al. (2007), the anisotropy might be caused by diagenetic processes or metamorphism, leading to planes of weakness (bedding planes) in the rock. Therefore, this kind of formation have properties that vary with direction and are said to be inherently anisotropic (Amadei 1983 and 1996). Compressive and shear wave measurements on cubic samples and also triaxial tests have exhibit an elastic anisotropy. The anisotropy ratio of the dynamic Young’s Modulus varies between 1.2 and 2.0 (Armand et al. 2013 and 2014). It has also been observed that the uniaxial compressive and tensile strengths depend of the orientation with respect to the bedding planes (about 17.8 MPa and -1.5 MPa for uniaxial compressive and tensile strength parallel to bedding planes; and about 19.9 MPa and -1.2 MPa perpendicular to bedding planes, from Andra database).
Concerning the Biot’s effective stress coefficient, in the literature one can find a rather large range of values (between 0.3 to 1) for the Callovo-Oxfordian claystone as determined in laboratory experiments (e.g. Vincké et al. 1998, Escoffier 2002, Bemer et al. 2004, Pham 2006, Belmokhtar et al. 2016). In addition to the natural variability of the tested samples, this discrepancy can be attributed partly to different initial saturation conditions of samples and also different loading rates in the performed experiments. However, the average value of the Biot’s coefficient, commonly preconized for the Callovo-Oxfordian Claystone, is about 0.6 (Jia et al. 2008, Charlier et al. 2013, Plassart at al. 2013, Pardoen et al. 2015a).
11
Short- and long-term behavior
As presented by Armand et al. (2013) and Armand et al. (2016), the short- and long-term behavior of the Callovo-Oxfordian claystone can be summarized as:
(1) For the short-term behavior, triaxial compression and extension tests have been performed. Fig. 1.3a shows typical experimental results obtained from triaxial compression tests. A linear response is observed under low deviatoric stress. The onset of damage which can be associated with the loss of linearity can be estimated at about 50 % of the peak stress. A brittle failure of the samples is observed under low confining pressures, which has been evidenced by the formation of an inclined shear band. By increasing the confining pressure, the rock behavior changes progressively from brittle to ductile. The transition confining pressure can be estimated to 20 MPa. Finally, it has been observed that the claystone presents a rather brittle behavior under tensile loading.
(2) The long-term behavior of the rock has been experimentally explored by performing creep tests. Fig. 1.3b presents the results obtained from uniaxial creep tests under multi-step uniaxial load (Zhang et al. 2010). The load has been applied upwards to 4, 7, 10, 13 MPa and downwards to 10 and 7 MPa. In the case of loading stages, it is observed that the strains increase gradually with time. Then, all the creep curves present a transient phase with decreasing strain rates during the first 2 – 3 months. Finally, a quasi-stationary phase with a relatively constant strain rate is observed. In the case of unloading stages, the creep strain evolves firstly with negative rates (as show in the right of the Fig. 1.3b) and then it tends to returns to a positive rate with time. Creep
rates of about 11 1
2 10 s to 11 1
6 10 s have been observed during the loading phases, whereas
lower rates of about 11 1
1 10 s to 11 1
2 10 s have been observed during the unloading phases. Similar observations have been performed in works of Gasc-Barbier et al. (2004) and Fabre et al. (2006). The experimental results presented in Fig. 1.3b have been obtained by applying the axial load perpendicular to the bedding plane. However, sample EST25321 (see Fig. 1.3b) has been axially loaded parallel to the bedding plane. It is observed that the strain evolution curves are relatively parallel, suggesting little anisotropy of the viscous deformation in the claystone, as explained by Zhang et al. (2010).
The deformation behavior of the COx has been widely studied based on laboratory experiments under various THM conditions (e.g. Zhang and Rothfuchs 2004, Zhang et al. 2010, Zhang 2015, Armand et al. 2016). However, one open question which is under study, is which mechanisms at the micro-scale control the time-dependent behavior of the rock. Studies performed until now show that the bound porewater has an important role in the rock deformation. The creep of the
12 clay matrix, sub-critical propagation of micro-cracks and swelling of some of the clay minerals can be at the origin of the observed time-dependent behavior.
Fig. 1. 3. Results obtained from different samples of Callovo-Oxfordian claystone: a. Triaxial tests (from Armand
et al. 2016). b. Uniaxial creep tests (from Zhang et al. 2010)
1.2. In-situ stress state
Several techniques have been applied for the determination of the stress field in the rock formation at the M/HM URL. They include hydraulic tests in vertical and inclined boreholes and borehole imaging. Hydraulic fracturing tests are commonly performed in order to estimate the value of the minimum principal stress. Then, as explained by Wileveau et al. (2007), based on a linear isotropic elastic analysis and the concept of effective strength (Haimson, 1993), the major horizontal principal stress magnitude has been calculated. In complement sleeve fracturing tests and a systematic analysis of the breakouts observed in boreholes have been performed to better assess the knowledge about the in-situ stress state.
13 The obtained results have been validated by the analysis of the convergence evolution during the excavation of the main shaft (with a diameter of about 6 m) used for accessing the URL. As explained by Wileveau et al. (2007), on the basis of a plane strain elastic back analysis of the measured convergence, the difference between the principal horizontal stresses has been evaluated together with the determination of the orientation of the maximal horizontal stress. Stress directions and magnitudes as obtained from different tests performed are in good accordance. As explained by Cornet et al. (2012), the stress magnitudes do not vary linearly with depth. In fact, the vertical variations are controlled by the rheological characteristics of various formations. Therefore, the ratio of anisotropy between the major and minor principal horizontal stresses vary with depth, as explained by Wileveau et al. (2007). Fig. 1.4 summarizes the results of the complete stress determination presented by Gunzburger and Cornet (2007) and Wileveau et al. (2007).
Fig. 1. 4. Stress determination results at the M/HM URL (from Cornet et al. 2012)
At the main level of the M/HM URL (i.e. -490 m), the major principal horizontal stress is considered to be about 16.1 MPa1 and is oriented in the direction N155°E
10°, while the minorprincipal horizontal total stress is very close to the vertical stress, 12.4 MPa and 12.7 MPa respectively. The pore pressure at the main level (-490 m) is around 4.7 MPa.
1 The major horizontal principal stress value presents uncertainties because of its estimation is based on