Understanding how people with MS get tired while walking
Sébastien Piérard, Rémy Phan-Ba, and Marc Van Droogenbroeck
ECTRIMS 2015
Background
Walking impairment is frequent, appears early in the disease course of MS patients (MSP), and is per-ceived as the most disabling symptom. When walking, patients get tired more and differently than healthy people (HP) [1]. This limits their walking perimeter. Understanding this phenomenon is thus important to suggest adequate therapies at the right time.
Objective
Our aim is to understand how MSP get tired while walking compared to HP. Two groups of MSP are considered: those with a low disability level (MSPL) and those with a high one (MSPH). We consider
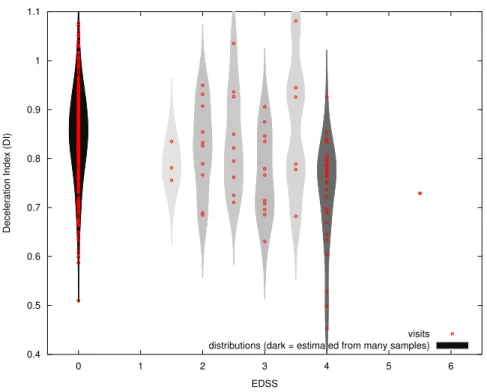
two criteria to measure the disability: the EDSS and the deceleration index (DI) [1](see Figure 1). The limit
between the groups is set at DI=0.8 and EDSS=3 (inclusive for MSPL).
Methods
Many gait characteristics (GC) have been measured with the system GAIMS along a 500m path walked as fast as possible. The dataset gathers 464 visits of HP and 70 of MSP. Some people have been assessed several times. There are 33 visits in the group MSPL with the EDSS criterion, and 25 with the DI criterion. Statistical tests (Welch) were performed on the differences and relative differences of the GC measured during the first and last 100m of the test to detect differences between HP and MSPL, and between MSPL and MSPH, as in [2].
Results
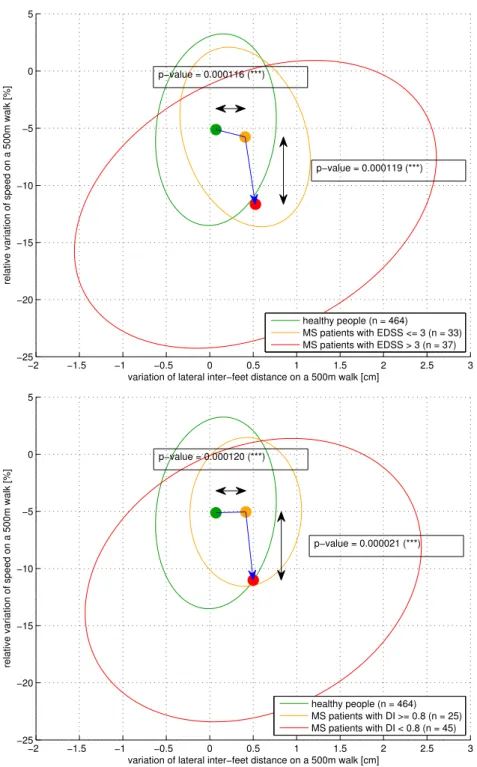
Both criteria for defining the groups lead to similar conclusions(see Figure 2). For many GC, the distributions
of the variations are significantly different between MSPL and MSPH. The largest difference is for the relative difference of speed (p=0.000119 for EDSS and p=0.000021 for DI). In contrast, only the variation of the average lateral distance between the feet, which is related to the size of the base of support (and thus to the balance) shows a very significant difference between HP and MSPL (p=0.000116 for EDSS and p=0.000120 for DI). The balance does not seem to change much from MSPL to MSPH. Besides, we note that the variance decreases slightly from HP to MSPL and increases a lot from MSPL to MSPH.
Conclusions
Statistically, from the motor fatigue point of view, it seems that the course of the MS disease is divided in two different stages. In the first one, MSP get more tired than HP because of a deterioration of the balance. Then, in the second one, their fatigue becomes related to a faster decrease of the walking speed. This suggests that physical therapy exercises focused on the balance could be given to MSP in the early stage of the disease.
Disclosures
The authors have nothing to disclose. We thank the Walloon region of Belgium for partly funding the project GAIMS .
References
[1] R. Phan-Ba, P. Calay, P. Grodent, G. Delrue, E. Lommers, V. Delvaux, G. Moonen, and S. Belachew. Motor fatigue measurement by distance-induced slow down of walking speed in multiple sclerosis.
PLoS ONE, 7(4):8 pages, April 2012.
[2] R. Phan-Ba, S. Piérard, G. Moonen, M. Van Droogenbroeck, and S. Belachew. Deciphering distance-induced deceleration of gait and ataxia in people with multiple sclerosis. In Congress of the European
Committee for Treatment and Research in Multiple Sclerosis (ECTRIMS), Lyon, France, October
2012. poster 755. 0.4 0.5 0.6 0.7 0.8 0.9 1 1.1 0 1 2 3 4 5 6
Deceleration Index (DI)
EDSS
visits distributions (dark = estimated from many samples)
Figure 1: There is a negative correlation between the Di and the EDSS.
−2 −1.5 −1 −0.5 0 0.5 1 1.5 2 2.5 3 −25 −20 −15 −10 −5 0 5
variation of lateral inter−feet distance on a 500m walk [cm]
relative variation of speed on a 500m walk [%]
healthy people (n = 464)
MS patients with EDSS <= 3 (n = 33) MS patients with EDSS > 3 (n = 37) p−value = 0.000116 (***) p−value = 0.000119 (***) −2 −1.5 −1 −0.5 0 0.5 1 1.5 2 2.5 3 −25 −20 −15 −10 −5 0 5
variation of lateral inter−feet distance on a 500m walk [cm]
relative variation of speed on a 500m walk [%]
healthy people (n = 464) MS patients with DI >= 0.8 (n = 25) MS patients with DI < 0.8 (n = 45) p−value = 0.000120 (***)
p−value = 0.000021 (***)
Figure 2: The two stages of the disease’s course.