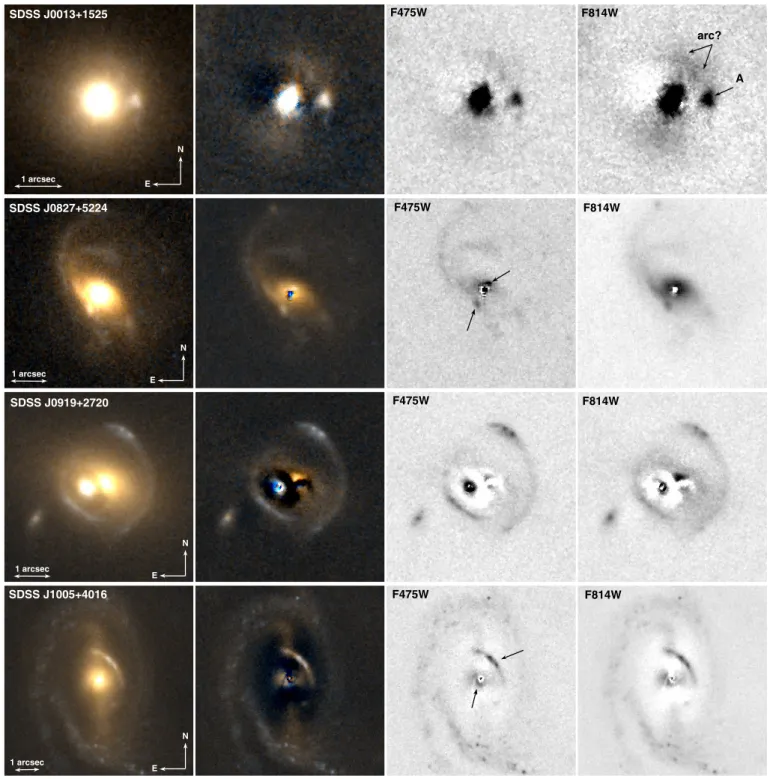
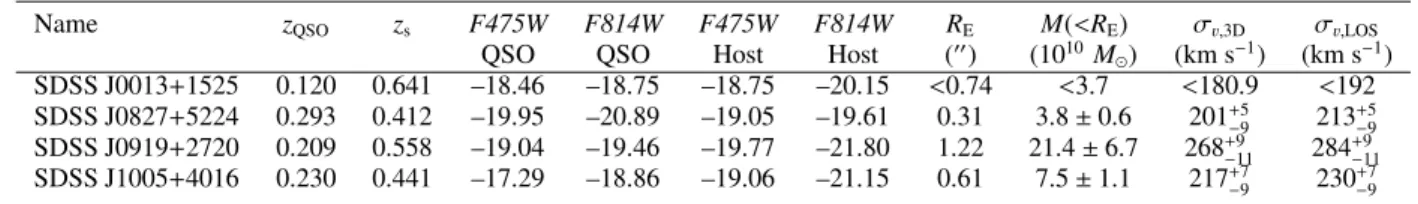
Three quasi-stellar objects acting as strong gravitational lenses
Texte intégral
Figure

Documents relatifs
In 2002, one of us (PCE), then employed by the Natural History Museum, London, was contracted by the Dorset County Council (DCC) to advise on a number of aspects of the
Two dis- tinct regions were identified in the parameter space spanned by the source extension and magnetic field strength, leading to interpretations of the high-energy bump either
(i) Carbamoylation±sulfamoylation aÁ partir de l'ICS: aÁ une solution de 1,1 eÂquivalents de dibenzylamine dans 100 ml de dichloromeÂthane est ajouteÂe une solution de
By analyzing Planck dust polarization maps toward the southern Galactic cap, the part of the sky used for CMB observations from Antartica and Atacama, PXLIV related the
Women and the Economic History of the Ancient Greek World Still a challenge for gender studies... Still a challenge for gender studies Violaine
L’accès à ce site Web et l’utilisation de son contenu sont assujettis aux conditions présentées dans le site LISEZ CES CONDITIONS ATTENTIVEMENT AVANT D’UTILISER CE SITE
Our main conclusion is that when testing accuracy recognition of the target embedded in (place) images, the eccentricity-dependent model – without contrast normalization and
The figures in the first column are obtained from QBE simulations with the Fermi’s golden rule laser transition, the figures in the second column are obtained from QBE simulations
