DÉGRADATION DES GLACES DE MER ET BIOGÉOGRAPHIE DES ÎLES
MARINES CANADIENNES
MÉMOIRE PRÉSENTÉ
À
L'UNIVERSITÉ DU QUÉBEC
À
RIMOUSKI
Comme exigence partielle du programme de
Gestion de la faune
et de
ses
habitats
PAR
MARIE CLAIRE BÉDARD
UNIVERSITÉ DU QUÉBEC À RIMOUSKI
Service de la bibliothèque
Avertissement
La diffusion de ce mémoire ou de cette thèse se fait dans le respect des droits de son
auteur, qui a signé le formulaire « Autorisation de reproduire et de diffuser un rapport,
un mémoire ou une thèse ». En signant ce formulaire, l’auteur concède à l’Université du
Québec à Rimouski une licence non exclusive d’utilisation et de publication de la totalité
ou d’une partie importante de son travail de recherche pour des fins pédagogiques et non
commerciales. Plus précisément, l’auteur autorise l’Université du Québec à Rimouski à
reproduire, diffuser, prêter, distribuer ou vendre des copies de son travail de recherche à
des fins non commerciales sur quelque support que ce soit, y compris l’Internet. Cette
licence et cette autorisation n’entraînent pas une renonciation de la part de l’auteur à ses
droits moraux ni à ses droits de propriété intellectuelle. Sauf entente contraire, l’auteur
conserve la liberté de diffuser et de commercialiser ou non ce travail dont il possède un
exemplaire.
Je souhaite tout d'abord remercier mon superviseur, Dominique Berteaux pour sa confiance et sa compréhension à travers les hauts et les bas de cette maîtrise. Ton sens critique et ton sens de l'humour m'ont tous deux été d'une grande aide durant les trois dernières années (et des poussières ... ).
Plusieurs autres personnes ont contribué à la réussite de ce projet. Un gros merci à Edith Sénéchal et Adam Michel pour leur travail acharné sur le terrain. Grâce à vous, les nombreux échantillons perdus auront eu l'avantage d'avoir été agréables à récolter. Merci aussi à Alain Pelletier, Kim Poitras, Michel Turgeon, Roger St-ArneauIt et à tout le personnel du Parc de l'île-Bonaventure-et-du-Rocher-Percé pour leurs précieuses contributions aux travaux de terrain. Je veux aussi remercier tout spécialement Guy Aubain, Chantal Bourget, Gilbert Bourget, Louis Brochet, Alcide Laflamme, Michel Méthot, Magella Murray et deux personnes anonymes pour avoir généreusement accepté de participer aux entrevus et de partager avec moi quelques brides de leurs souvenirs.
Pour leur support technique ainsi que leurs précieux conseils, mille mercis à Joel Bêty, Katie Brown, Alain Caron, Pierre Etcheverry, John Iacozza, Arnaud Mosnier, François Ouellet, Pierre Ouellet, François Saucier, Caroline St-Pierre, Jean-François Rail, Simon Senneville et Bruno Tremblay (et la liste pourrait être beaucoup
Il
plus longue). Un gros merci aux étudiants (et ex-étudiants) du labo Berteaux-Bêty pour vos critiques, vos desserts et l'ensemble de votre œuvre.
Pour finir, je veux remercier tous les êtres chers qui m'ont patiemment supportée et encouragée tout au long de cette maîtrise. Tout d'abord, merci à ma petite famille adorée: Maman, Papa, Rémi et Félix. Catherine, grande amie et «compagne de bataille », merci pour ta complicité et les fous rires. Yanick, je te réserve des tonnes de mercis pour tout ton amour, ton humour et ton support inconditionnel. Tu la mérites presque autant que moi cette maîtrise ... Finalement, je veux dédier ce mémoire à mon fils, le beau Philippe, qui, grâce à sa bonne humeur et ses nuits de 12 heures, m'a permis de terminer ma maîtrise le sourire aux lèvres.
Ce projet n'aurait pu être réalisé sans le support et/ou le financement des organismes suivants (en ordre alphabétique): les Chaires de recherche du Canada, le Conseil de recherche en sciences naturelles et en génie du Canada (CRSNG), le Parc National de l'Île-Bonaventure-et-du-Rocher-Percé, le Réseau de centres d'excellence ArcticNet ainsi que l'Université du Québec à Rimouski.
AVANT -PROPOS
Ce mémoire est composé de quatre chapitres. Le premier chapitre consiste en une introduction qui fournit au lecteur une mise en contexte du sujet d'étude. Le deuxième chapitre est présenté sous forme d'un article à être soumis à la revue Global Change Biology. Le troisième chapitre présente une étude de cas qui permet d'explorer les conséquences à l'échelle locale de la problématique soulevée dans le chapitre précédent. Le mémoire se termine par une conclusion générale.
Contribution
des
auteursBien que Dominique Berteaux soit co-auteur de l'article principal, celui-ci doit être considéré comme le mémoire de l'étudiante. L'apport de D. Berteaux se limite aux fonctions de supervision. Il a guidé l'étudiante lors de la planification du travail de terrain, lors de l'analyse des données et lors de la rédaction du mémoire. Marie Claire Bédard a planifié l'échantillonnage, récolté les données, fait les analyses statistiques et rédigé le mémoire.
iv
RÉSUMÉ
Au cours des dernières décennies, le couvert de glaces de mer de l'Hémisphère Nord a connu des changements importants, avec des conséquences sur l'écologie d'espèces animales. Notre objectif central était de décrire comment la biogéographie des îles marines du nord et de l'est canadien (i.e. celles situées dans la partie est de la mer de Beaufort, l'archipel arctique canadien, la baie d'Hudson, la baie de Baffin, la mer du Labrador et le Golfe du St-Laurent, soit 2973 îles de plus de 1 km2) pourrait être affectée par la dégradation actuelle du couvert de glaces de mer. Nous avons privilégié une approche à deux échelles spatiales. À l'échelle régionale nous avions comme objectifs de vérifier de façon quantitative si, d'une part, des changements dans l'étendue des glaces sont observables à l'échelle de notre aire d'étude. D'autre part, nous voulions quantifier les impacts de ces changements sur l'environnement glacé des îles marines situées dans notre aire d'étude. L'analyse de chartres de glaces (Service canadien des glaces) montre que, de 1980 à 2005, les étendues minimales (période estivale) et maximales (période hivernale) des glaces dans notre aire d'étude ont diminué (5.2 et 1.7% par décennie, respectivement). Ces changements se traduisent par une diminution (12.3% par décennie) du nombre d'îles passant l'année entourée de glace et une augmentation (3.5% par décennie) du nombre d'îles passant toute l'année en eau libre. Cependant, en raison d'une variabilité interannuelle élevée, ces tendances ne sont pas statistiquement significatives. Comme la réduction de l'étendue maximale des glaces se traduit, au sud de notre aire d'étude, par une disparition des ponts de glace et une réduction majeure des probabilités de migration de certaines espèces animales, ces changements pourraient avoir une plus grande significativité biologique que ceux observés pour l'étendue minimale (au nord de l'aire d'étude).
À l'échelle locale, nous avions comme premier objectif de reconstruire l'historique de la température de l'air et du pont de glace d'une île (l'île Bonaventure) située à la limite sud de notre aire d'étude, là où nous anticipons les changements les plus significatifs dans l'état des glaces. Grâce à des entrevues semi-dirig~es réalisées en 2006 auprès de neuf personnes vivant dans le secteur de l'île nous savons maintenant que, depuis le début du siècle dernier (les entrevues couvrent la période de 1920 (environ) à 2006), le pont de glace reliant l'île Bonaventure au continent se forme de moins en moins souvent et que lorsqu'il se forme, il est moins épais et dure moins longtemps que dans le passé. Nous avons pu associer ces changements avec un réchauffement des températures hivernales dans la région. Nos autres objectifs avaient tous pour but d'évaluer les impacts possibles de cette dégradation du pont de glace sur l'écosystème qu'abrite cette île. Ces objectifs spécifiques étaient 1) de rassembler des informations sur la composition de l'écosystème en espèces potentiellement affectées par la présence/absence d'un pont de glace (entrevues semi-dirigées, captures) 2) de rassembler des informations sur l'utilisation du pont de glace par les organismes vivants de l'île Bonaventure (entrevues semi-dirigées), 3) d'évaluer de façon plus détaillée la vulnérabilité d'une population (renards roux) apparaissant comme particulièrement dépendante de la présence de ponts de glace (capture, marquage, observations et télémétrie) et 4) de mieux comprendre les liens entre cette population de renards et le reste de l'écosystème (capture, marquage, télémétrie et observations). Les travaux de terrain exécutés durant l'été 2005 nous ont permis de répondre à ces quatre objectifs et de déterminer que la population de renards est vulnérable à une raréfaction du pont de
glace, car l'isolement qui en découle augmente les risques de disparition de cette petite population (4-5 adultes). Dans le cas d'une disparition de la population de renards, nous supposons que certaines espèces (vertébrés herbivores et certains colonies d'oiseaux), pourraient proliférer, engendrant des conséquences diverses aux autres niveaux trophiques. À moins, bien sur, que les autres prédateurs terrestres de l'île (hermines et oiseaux de proie) n'arrivent à combler le vide laissé par les renards et suffisent à stabiliser ces populations.
En combinant deux échelles spatiales (régionale et locale) et deux champs d'étude (biologie et géographie physique), cette étude permet de mieux comprendre les impacts locaux d'un changement global.
VI
TABLE DES MATIÈRES
REMERCIEMENTS ... i
A VA NT-PROPOS ... iii
Contribution des auteurs ... iii
RÉSUMÉ ... iv TABLE DES MATIÈRES ... vi
CHAPITRE 1: INTRODUCTION GÉNÉRALE ... viii Changemenls climatiques el dégradation des glaces de mer ... 1
Dégradation des glaces de mer el écologie des écosystèmes nordiques ... 2
Objectifs de l'étude ... 8
BIBLIOGRAPHIE ... 10
CHAPITRE 2: SEA ICE DEGRADATION AND THE BIOGEOGRAPHY OF CANADIAN MARINE ISLANDS ... 14
INTRODUCTION ... 19 MATERIALS AND METHODS ... 23
Siudy area ...... 23 Sea ice exlenl .................................................. 24 Ice bridges ... 25 Bonavenlure Island ... 25 Statistics ...... 27 RESULTS ... 28 Sea ice extenl ............................................. 28 Ice bridges ... 28
Bonaventure Island ...... 29
DISCUSSION ... 30
Sea ice extenl ........................................... ....... 31 Ice bridges ... 33
Bonaventure Island ...... 33
The future ...... 35
Biogeographical consequences ... 36
ACKNOWLEDGEMENTS ... 39
REFERENCES ... 40
FIGURES AND TABLES ... 46
CHAPITRE 3: IMPACTS POSSIBLES DE LA DÉGRADATION DU PONT DE GLACE DE L'ÎLE BONA VENTURE SUR L'ÉCOSYSTÈME TERRESTRE DE CETTE ÎLE ... 53
INTRODUCTION ... 54
Dégradation des glaces de mer ........................................................ 54
Glaces de mer et biogéographie insulaire .. ...... 55
Le cas de l'île Bonaventure ... ...... 57
MATÉRIEL ET MÉTHODES ... 59
Aire d'étude ............................................. 59
Objectif 1 a: Composition de l'écosystème: mustélidés ... ...... 61 Objectif 1 b: Composition de l'écosystème: autres espèces.. ......... 62
Objectif 2: Utilisation du pont de glace par les animaux et par les humains ...... 63
Objectif 3: Vulnérabilité de la population de renards roux ... 64
Objectif 4: Liens trophiques entre la population de renards roux et le reste de l'écosystème ... 65
RÉSULTATS ... 66
Objectif 1 a: Composition de l'écosystème: mustélidés .... 66
Objectif lb: Composition de l'écosystème: a/lires espèces.. .......................... 67
Objectif 2a: Utilisation du pont de glace par les animaux ................................. 68
Objectif 2b: Utilisation du pont de glace par les humains .. ...... 69
Objectif 3: Vulnérabilité de la population de renards roux ... 70
Objectif 4: Relations trophiques de la population de renards roux ...... 71 DISCUSSION ... 73
Vulnérabilité de la population de renards roux ....... 74
Conséquences possibles de la disparition de la population de renards roux ........................... 75
viii
CONCLU SION ... 81 BIBLIOGRAPHIE ... 83 CONCLUSION DU MÉMOIRE .................. 93
Changements climatiques et dégradation des glaces de mer
Le réchauffement planétaire est maintenant sans équivoque (Ailey et al. 2007). De 1906 à 2005, la température moyenne planétaire a augmenté d'environ O,07°C par décennie et cette tendance est quasiment doublée (0,13 oC par décennie) si l'on considère uniquement les années 1956 à 2005 (Ailey et al. 2007). Bien que le climat soit sujet à des variations naturelles, il semble que le réchauffement observé depuis le milieu du 20 ème siècle soit essentiellement causé par l'augmentation des concentrations de gaz à effet de serre d'origine humaine (Ailey et al. 2007).
La dégradation du couvert de glaces de mer dans l'Hémisphère Nord est une des conséquences du réchauffement climatique les mieux quantifiées (Comiso et al. 2008) et sans doute une des plus médiatisées. Dans les faits, les hausses de température se traduisent par des retards dans les dates d'embâcle et un devancement des dates de débâcle et donc en un raccourcissement de la période propice à la formation de glaces et en une détérioration de l'état des glaces en général (Parkinson 2000; Comjso 2006b). Étant relativement faciles à suivre à l'aide d'images satellites, les changements en termes de couvert des glaces et plus particulièrement la diminution de l'étendue minimale des glaces sont les mieux documentés (Tremblay et al. 2007; Comiso et al. 2008). Dans les faits, de 1979 à 2007, l'étendue (surface couverte par des glaces ayant une concentration d'au moins 15%) minimale des glaces de mer pour l'Hémisphère Nord a diminué selon un taux de 10,2% par décennie (Comiso et al. 2008). Le 14
2
septembre 2007, une étendue de glace minimale record, sans précédent depuis le début des suivis par satellite en 1979, a été enregistrée (NSIDC 2007). L'étendue était alors 24 % plus faible que durant le record précédent en septembre 2005 (Comiso et al. 2008). L'accélération des tendances que l'on connaît depuis quelques années serait en partie imputable à une boucle de rétroactions positives, la rétroaction glace-albédo (Holland et al. 2006; Comiso et al. 2008). Lorsque l'étendue de glaces de mer rétrécit, la surface d'eau libre exposée augmente. Comme l'eau a un albédo (capacité à refléter l'énergie solaire) plus faible que la glace, il en résulte une plus grande absorption de chaleur qui se traduit par un nouveau déclin dans l'étendue des glaces et ainsi de suite (Meier et al. 2007). Les glaces pérennes (glaces qui survivent à la période de fonte), en plus de perdre du terrain, sont de plus en plus jeunes et par conséquent de moins en moins épaisses (Rothrock et al. 1999; Wadhams et Davis 2000; Maslanik et al. 2007). Les glaces restantes deviennent donc plus sujettes au démantèlement causé par le vent (Kerr 2007) ou par d'autres forces mécaniques (passage de navires). L'étendue maximale des glaces (en mars) pour l'Hémisphère Nord connaît pour sa part un déclin plus modeste (-1,9% par décennie; Comiso 2006a). Cette situation pourrait cependant changer. En effet, les valeurs anormalement basses obtenues pour les années 2005 à 2007 laisse présager que cette tendance pourrait elle aussi s'accélérer (Comiso 2006a; Comiso et al. 2008).
Dégradation des glaces de mer et écologie des écosystèmes nordiques
Selon un ensemble de modèles prédictifs, le réchauffement de la planète devrait se poursuivre au cours des prochaines décennies à un rythme d'environ 0,2°C par décennie
(Ailey et al. 2007). Conséquemment, les tendances observées dans l'état des glaces
devraient se poursuivre elles aussi, si bien que les modèles prévoient la disparition ou la quasi-disparition du couvert de glace estival de l'Arctique d'ici la fin du 21 ème siècle (Holland et al. 2006; Stroeve et al. 2007; Tremblay et al. 2007). De plus, la superficie
d'océan réunissant les conditions nécessaires à la formation de glace devrait continuer
de diminuer et ainsi, l'étendue maximale des glaces pour l'hémisphère nord devrait continuer son déclin (Walsh et Timlin 2003). En plus du réchauffement climatique, l'intensification des transports maritimes est un autre élément dont il faut anticiper
l'impact négatif sur l'état des glaces de mer (Kerr 2002). Cette situation s'applique
particulièrement à l'Arctique canadien où la récente dégradation de l'état des glaces ouvre la porte au trafic maritime par l'intermédiaire du passage du nord-ouest qui devient de plus en plus accessible à la navigation (Hassol 2004).
La glace est partie intégrante de plusieurs processus clés du fonctionnement des
écosystèmes nordiques. Elle est un substrat vital pour les espèces pagophiles, c'
est-à-dire les espèces pour lesquelles la glace de mer est essentielle à l'alimentation et/ou à la reproduction. Le principal avantage de la glace est de faciliter les déplacements d'espèces terrestres qui ne volent pas. Même si plusieurs de ces espèces ont une bonne
capacité de nage (Jackson 1919; Carter et Merrit 1981; Strub 1992), la glace représente
souvent une matrice de déplacement moins risquée et moins coûteuse énergétiquement
que l'eau libre (Carter et Merrit 1981; Derocher et al. 2004). Une partie des caribous de Peary (Rangifer tarandus pearyi) de l'ouest de l'Arctique canadien fait chaque année
des déplacements entre les îles, ce qui agrandit l'aire de répartition de la population et
4 ours polaires (Ursus maritimus), eux, se nourrissent à la lisière de la banquise et se servent des glaces pour se déplacer vers les sites d'alimentation (Kerr 2002; Barber et Iacozza 2004; Derocher et al. 2004). Plusieurs communautés humaines, et particulièrement certaines communautés Inuit sont aussi dépendantes de la présence des glaces, que ce soit pour accéder à leurs ressources ou pour se déplacer (Kerr 2002; Tremblay et al. 2006).
Tableau l.Exemples d'espèces pour lesquelles il y a des preuves de déplacements entre des masses terrestres par l'intermédiaire de ponts de glace. La distance
maximale traversée (en mètres) est donnée entre parenthèses quand celle-ci était disponible. Espèces
Micromammifères (Microtus spp., Peromyscus spp., etc)
Cerf de Virginie (Odocoileus virginianus borealis), écureuil roux (Sciurus
hudsonicus), lièvre d'Amérique (Lepus americanus phoeonotus), renard roux (Vulpes vulpes), coyote (Canis latrans latrans) et hermine (Mustela cicognanii) Coyote, renard roux, écureuil roux (Tamiasciurus hudsonicus), écureuil gris (Sciurus carolinensis), lapin à queue blanche (Sylvilagus floridanus), vison d'Amérique (Mustela vison), raton laveur (Procyon lotor) et moufette rayée (Mephitis mephitis)
Caribou de Peary (39000; Rangifer tarandus pearyi) Lièvre variable (Lepus timidus) et renard roux
Cerf de Virginie (2100), coyote (5315), renard roux (2320), raton laveur (140), vison d'Amérique (785), rat musqué (650; Ondatra zibethicus), moufette rayée (785), lapin à queue blanche (950), écureuil gris (160), écureuil roux (285), condylure étoilé (1068; Condylura cristata), campagnol des champs (595; Microtus pennsylvanicus), souris à pattes blanches (36; Peromyscus leucopus), grande musaraigne (475; Blarina brevicauda)
Caribou (Rangifer arcticus et Rangifer tarandus), orignal (Alees alces Americana), bœuf musqué (Ovibos moschatus), renard arctique (Vulpes lagopus)
Méthode utilisée
Suivi de pistes, animaux marqués Observations
Suivi de traces
Suivi de pistes et observations d'animaux marqués
Suivi de pistes et observations d'animaux marqués (lièvres), NID (renards) Suivi de pistes
Observations et observations d'animaux marqués (caribous), NID (autres)
Référence Beer, Lukens et al. (1954) Jackson (1919)
Lomolino (1990)
Miller, Russel et al. (1977) Angerbjom (1989) Lomolino (1986)
6
Un certain nombre d'études ont déjà mis de l'avant des impacts de la dégradation des glaces sur l'écologie de certaines espèces animales. Par exemple, Striling et al. (1999) rapportent que dans l'ouest de la baie d'Hudson, un devancement de la date de débâcle peut être associé à une détérioration de la condition physique des femelles ours polaires. Chez les guillemots de Brunnich (Uria lomvia) un devancement de la date de débâcle semble avoir des effets négatifs sur la reproduction des populations nichant à la limite sud de l'aire de répartition et positifs sur celles nichant à la limite nord (Gaston et al. 2005).
Dans un ordre d'idée plus général, selon Lomolino (1994), la dégradation des glaces de mer pourrait même affecter la diversité spécifique des écosystèmes insulaires nordiques en général. C'est du moins ce qu'il propose suite à une méta-analyse selon laquelle malgré des habitats et des réservoirs d'espèces semblables, les îles reliées au continent ou à d'autres îles par un pont de glace stable comptaient plus d'espèces par unité de surface que celles situées dans les secteurs où les courants et l'instabilité des glaces limitent les déplacements sur les glaces. Cette relation s'explique en faisant appel à la théorie de la biogéographie insulaire (MacArthur et Wi Ison 1967). Selon cette théorie, la diversité spécifique retrouvée sur une île est fonction d'un équilibre entre l'immigration et l'extinction des organismes vivants. L'intensité de œs forces est modulée par la taille de l'île ainsi que par son niveau d'isolement spatial. À l'origine, l'isolement spatial était défini par la distance séparant une île des sources de colonisation les plus proches. Dans les dernières années, cette théorie a été raffinée et
on considère maintenant l'impact de différentes caractéristiques des îles (forme, état de
la matrice de déplacement, etc.) ainsi que des espèces impliquées (taille, capacité de
dispersion, etc.) sur J'isolement effectif des populations insulaires (Brown et Lomolino 2000; Lomolino 2000a; Lomolino 2000b; Ricketts 2001; Whittaker et al. 2005). Dans
les écosystèmes nordiques, à cause de la présence plus ou moins longue de glaces autour des îles, la matrice de déplacement, considérée comme uniforme dans les
modèles classiques, est en fait hétérogène spatialement et temporellement (Ricketts 2001). Comme la présence de glace facilite les déplacements de certaines espèces animales (tableau 1), elle augmente les probabilités d'immigration de celles-ci et réduit donc l'isolement spatial effectif des îles (Banfield 1954; Lomolino 1986; Lomolino
1994). De ce fait, elle module trois paramètres liés étroitement au maintien de la
biodiversité insulaire, soit:
-Le maintien de la diversité génétique par l'ajout de nouveaux individus à une
population insulaire existante
- La recolonisation par de nouveaux individus suite à J'extinction d'une population insulaire
- L'établissement de nouvelles populations insulaires par l'arrivée d'individus
d'espèces nouvelles
L'état des connections glacées reliant des îles à des sources potentielles de colonisation peut donc avoir des effets à court ou long terme sur la biodiversité de ces îles en question. La dégradation de J'état des glaces de mer en cours dans plusieurs
8
régions de la planète est donc préoccupante pour la conservation de la biodiversité au sein des écosystèmes insulaires nordiques. À l'inverse, devenant de plus en plus isolées, ces îles peuvent devenir des refuges pour certaines espèces en limitant l'arrivée soit de prédateurs, soit d'espèces compétitrices, de maladies ou de parasites (Fayet Stephenson 1989; Carmichael et al. 2007; Chaulk et al. 2007).
Objectifs de ['étude
À notre connaissance, aucune étude n'a encore mis en lumière cette relation
entre le réchauffement climatique, la dégradation des glaces de mer et la biogéographie insulaire, ni les impacts potentiels de ce phénomène pour la biodiversité des écosystèmes insulaires nordiques. Le but principal de notre étude est donc d'explorer cette problématique en hiérarchisant notre approche selon deux échelles spatiales. D'une part, nous décrivons, dans le chapitre 2, une analyse à grande échelle (échelle régionale) dont l'objectif principal était d'évaluer, de façon quantitative, l'ampleur de la dégradation des glaces de mer dans les eaux de l'est et du nord Canadien et les impacts sur l'englacement des îles situées dans ces secteurs. Cette approche est complétée par l'étude de cas d'une île située à l'extrémité sud de notre aire d'étude (île Bonaventure), là où les changements les plus importants en termes de fréquence de formation des ponts de glace devraient se faire sentir. Nous avons testé l'hypothèse selon laquelle le pont de glace de cette île aurait connu des changements dans les dernières années et nous avons vérifié si ces changements seraient associés à une hausse des températures locales. Dans le chapitre 3, une analyse à une échelle plus fine (échelle locale) nous a permis d'étudier la vulnérabilité de l'écosystème insulaire de l'île Bonaventure à la
dégradation des glaces. Nous avons ainsi analysé les impacts potentiels de cette dégradation sur les différentes composantes de l'écosystème. Certaines méthodes ont été utilisées
à
la fois pour répondre aux objectifs du chapitre 2 et du chapitre 3, d'où certaines zones de chevauchement entre ces chapitres. En combinant deux échelles spatiales (régionale et locale) et deux champs d'étude (biologie et géographie physique), cette étude permet de mieux comprendre les impacts locaux d'un changement global.10 BIBLIOGRAPHIE
AIIey, R, T. Bemtsen, N. L. Bindoff, Z. Chen, A. Chidthaisong, P. Friedlingstein, 1.
Gregory, G. HegerI, M. Heimann, B. Hewitson, B. Hoskins,
F.
Joos, 1. Jouzel,V. Kattsov, U. Lohmann, M. Manning, T. Matsuno, M. Molina, N. NichoIIs, J. Overpeck, D. Qin, G. Raga, V. Ramaswamy, 1. Ren, M. Rusticucci, S. Solomon,
R
SomerviIIe, T.F.
Stocker, P. Stott,R
1. Stouffer, P. Whetton,R
A. Wood et D. Wratt. 2007. Climate change 2007: The physical science basis. Geneva:Intergovememental Pannel on Climate Change 18 p.
Angerbjom, A. 1989. "Mountain Hare Populations on Islands -Effects of Predation by Red Fox." Oecologia 81(3): 335-340.
Banfield, A. W.
F.
1954. "The Role of Ice in the Distribution of Mammals." Journal ofMammalogy 35(1): 104-107.
Barber, D. G. et 1. Iacozza. 2004. "Historical analysis of sea ice conditions in
M'Clintock channel and the Gulf of Boothia, Nunavut: Implications for ringed seal and polar bear habitat." Arctic 57(1): 1-14.
Beer,1. R, P. Lukens et D. Oison. 1954. "SmaII Mammal Populations on the Islands of
Basswood Lake, Minnesota." Ecology 35(4): 437-445.
Brown, 1.
H.
et M. V. Lomo1ino. 2000. "ConcIuding remarks: historical perspective and the future of island biogeography theory." Global Ecology and Biogeography9(1): 87-92.
Carmichael, L. E., J. Krizan, J. A. Nagy, E. Fuglei, M. Dumond, D. Johnson, A. Veitch, D. Berteaux et C. Strobeck. 2007. "Historical and ecological determinants of
genetic structure in arctic canids." Molecular Ecology 16(16): 3466-3483.
Carter, J. L. et 1. F. Merrit. 1981. "Evaluation of swimming ability as a means of island
invasion by small mammals in coastal Virginia." Annals Carnegie Museum of Natural History 50: 31-46.
Chau1k, K. G., G. 1. Robertson et W. A. Montevecchi. 2007. "Landscape features and sea ice influence nesting corn mon eider abundance and dispersion." Canadian
Comiso, J. C. 2006a. "Abrupt decline in the Arctic winter sea ice cover." Geophysical Research LeUers 33( 18): L 18504.
Comiso,
J.
C. 2006b. "Arctic warming signaIs from satellite observations." Weather 61 (3): 70-76.Comiso, J.
c.,
C. L. Parkinson, R. Gersten et L. Stock. 2008. "Accelerated decline in the Arctic sea ice cover." Geophysical Research LeUers 35: LO 1703.Derocher, A. E., N.
J.
Lunn et1.
Stirling. 2004. "Polar bears in a warming climate."Integrative and Comparative Biology 44(2): 163-176.
Fay, F.
H.
et R. O. Stephenson. 1989. "An nuai, Seasonal, and Habitat-Related Variation in Feeding-Habits of the Arctic Fox (Alopex lagopus) on St-Lawrence-Island,Bering Sea." Canadian Journal of Zoology-Revue Canadienne De Zoologie
67(8): 1986-1994.
Gaston, A. J., H. G. Gilchrist et J. M. Hipfner. 2005. "Climate change, ice conditions
and reproduction in an Arctic nesting marine bird: Brunnich's guillemot (Uria
lomvia L.)." Journal of Animal Ecology 74(5): 832-841.
HassoI, S.
J.
2004. Impacts of a warming arctic. Cambridge: Arctic Climate Impact Assessment. 146 p.Holland, M. M., C. M. Bitz et B. Tremblay. 2006. "Future abrupt reductions in the summer Arctic sea ice." Geophysical Research LeUers 33(23): L23503.
Jackson, H.
H.
T. 1919. "An apparent effect of winter inactivity upon distribution of mammals." Journal of Mammalogy 1: 58-64.Kerr, R. A. 2002. "A warmer Arctic means change for ail." Science 297(5586): 1490-1491.
Kerr, R. A. 2007. "Is battered arctic sea ice down for the count?" Science 318: 33-34. Lomolino, M. V. 1986. "Mammalian Community Structure on Islands - the Importance
ofImmigration, Extinction and Interactive Effects." Biological Journal of the Linnean Society 28(1-2): 1-21.
12 Lomolino, M. V. 1990. "The Target Area Hypothesis -the Influence of Island Area on
Immigration Rates of Non-Volant Mammals." Oikos 57(3): 297-300. Lomolino, M. V. 1994. "Species Richness of Mammals Inhabiting Nearshore
Archipelagoes - Area, Isolation, and Immigration Filters." Journal of Mammalogy 75(1): 39-49.
Lomolino, M. V. 2000a. "A cali for a new paradigm of island biogeography." Global Ecology and Biogeography 9( 1): 1-6.
Lomolino, M. V. 2000b. "A species-based theory of insular zoogeography." Global
Ecology and Biogeography 9(1): 39-58.
MacArthur,
R.
H. etE. O. Wilson. 1967. The the ory ofisland biogeography. Princeton: Princeton University Press. 203 p.Maslanik,1. A., C. Fowler, J. Stroeve, S. Drobot, H. 1. Zwally, D. Yi et W. Emery. 2007. "A younger, thinner Arctic ice cover: Increased potential for rapid, extensive sea-ice loss." Geophysical Research LeUers 34: L24501.
Meier, W. N., 1. Stroeve et F. Fetterer. 2007. "Whiter arctic sea ice? A c1ear signal of
decline regionally, seasonally and extending beyond the satellite record."
Annals of Glaciology 46: 428-434.
Miller, F. L.,
R.
H. Russell et A. Gunn. 1977. "Inter-Island Movements of Peary Caribou (Rangifer tarandus pearyi) on Western Queen Elizabeth Islands, ArcticCanada." Canadian Journal of Zoology-Revue Canadienne De Zoologie
55(6): 1029-1037.
NSmc. (Page consultée le 22 novembre 2007). Arctic Sea!ce News Fall 2007, [En ligne]. Adresse URL:
http://nsidc.org/news/press/2007seaiceminimumI20070810index.html. Parkinson, C. L. 2000. "Variability of Arctic sea ice: The view from space, an 18-year
record." Arctic 53(4): 341-358.
Ricketts, T.
H.
2001. "The matrix matters: Effective isolation in fragmented landscapes." American Naturalist 158(1): 87-99.Rothrock, D. A, Y. Yu et G. A Maykut. 1999. "Thinning of the Arctic sea-ice cover."
Geophysical Research Letters
26(23): 3469-3472.Stirling, L, N. J. Lunn et J. Iacozza. 1999. "Long-terrn trends in the population ecology of polar bears in western Hudson Bay in relation to climatic change."
Arctic
52(3): 294-306.Stroeve, J., M. M. Holland, W. Meier, T. Scambos et M. Serreze. 2007. "Arctic sea ice decline: Faster than forecast."
Geophysical Research Letters
34(9): L0950 1. Strub, H. 1992. "Swim by an Arctic Fox (Alopex lagopus), in Alexandra Fjord,Ellesmere-Island, Northwest-Territories."
Canadian Field-Naturalist
1 06( 4): 513-514.Tremblay, L. B., M. M. Holland, 1. V. Gorodetskaya et G. A Schmidt. 2007. "An ice-free arctic? Opportunities for computational science."
Computing in Science
&Engineering
9(3): 65-74.Tremblay, M., C. Furgal, V. Lafortune, C. Larrivée, 1.-P. Savard, M. Barrett, T. Annanack, N. Enish, P. Tookalook et B. Etidloie. 2006. "Communities and ice: linking traditional and scientific knowledge. Pages 123-138" dans R. Riewe and 1. Oakes, éditeurs.
Climate change: lin king traditional and scientific
knowledge.
Winnipeg: Arboriginal Issues Press.Wadhams, P. et N. R. Davis. 2000. "Further evidence of ice thinning in the Arctic Ocean."
Geophysical Research Letters
27(24): 3973-3975.Walsh, J. E. et M. S. Timlin. 2003. "Northern Hemisphere sea ice simulations by global climate models."
Polar Research
22(1): 75-82.Whittaker, R. J., M. B. Araujo, 1. Paul, R. 1. Ladle, 1. E. M. Watson et K. 1. Willis. 2005. "Conservation Biogeography: assessment and prospect."
Diversity and
Distributions
11 (1): 3-23.CHAPITRE 2
SEA ICE DEGRADATION AND THE BIOGEOGRAPHY OF
CANADIAN MARINE ISLANDS
Manuscrit en préparation pour une publication Marie Claire Bédard et Dominique Berteaux
14
Chaire de recherche du Canada en conservation des écosystèmes nordiques,
Département de biologie, chimie et géographie et Centre d'études nordiques, Université du Québec à Rimouski, 300 allée des Ursulines, Rimouski, Qc, Canada, G5L 3A 1
Marie Claire Bédard and Dominique Berteaux. Sea ice degradation and the
biogeography of Canadian marine islands.
In this study we investigate how the biogeography of islands located in northern and eastern Canadian waters (2,973 islands ~ 1 km2
) might be affected by ongoing sea ice degradation. We worked at two spatial scales. At the regional scale, we analyse sea ice concentration data from the Canadian !ce Service to quantify the extent to which sea ice coyer over northern and eastern Canadian waters (i.e. Canadian Arctic Archipelago, Hudson Bay, Baffin Bay, Labrador Sea, Gulf of St-Lawrence and east part of Beaufort Sea) has decreased in the last decades (1980-2005). We also evaluate quantitatively how these changes in sea ice conditions have altered the sea ice connections of islands located in these regions. At the local sc ale, we described through a case study the cIimate and ice bridge history of one island (Bonaventure Island) located at the Southern edge of our study area, where we anticipated the most dramatic changes in the frequency of ice bridge presence. Our results show that the rates of decrease of minimum and maximum annual sea ice extents across our study area are 5.2 and 1.7% per decade, respectively. These trends are not significant due to high inter-annual variability. However, they generated a decline of 12.3% per decade in the number of islands being surrounded by ice ail year round (in northern part of the study area) and of 3.5% per decade in the number of islands that are free of sea ice ail year round (in southern part of the study area). The rate of decrease is higher for minimum extent of sea ice and consequently the decrease in the number of islands that are sUITounded by sea ice ail year round is faster. However, the decrease in maximum sea ice extent results in changes that may be more biologically significant since they lead to the complete loss of ice connections and thus, to major reductions in terms of migration probabilities of
16
animal species. This is the case for Bonaventure Island, where the degradation (and quasi-disappearance) of the ice bridge can be associated with the warming of winter temperatures.
Marie Claire Bédard et Dominique Berteaux. Dégradation des glaces de mer et biogéographie des îles marines canadiennes.
Le but principal de cette étude était d'explorer comment la biogéographie des îles situées dans les eaux du nord et de l'est du Canada (2973 îles ~ 1 km2
) pourrait être
affectée par l'actuelle dégradation de l'état des glaces. Pour se faire, nous avons
privilégié une approche à deux échelles spatiales.
À
l'échelle régionale, nous avons analysé des donnée de concentrations de glaces de mer provenant du Service canadien des glaces afin de quantifier les changements dans l'étendue des glaces de mer pour lenord et J'est du Canada (i.e. l'archipel arctique canadien, la baie d'Hudson, la baie de
Baffin, la mer du Labrador, le Golfe du St-Laurent et la partie est de la mer de Beaufort) au cours des dernières décennies (1980-2005). Nous avons aussi évalué
quantitativement J'impact de ces changements sur la présence de ponts de glace reliant
les îles de ces régions à d'autres masses terrestres. À une échelle plus locale nous avons
décrit J'historique de la température de J'air et de la présence du pont de glace d'une île
(île Bonaventure) située à la limite sud de notre aire d'étude, là où nous anticipons les changements les plus importants en termes de fréquence de formation des ponts de glaces. Nos résultats montrent que durant la période étudiée, les étendues minimales et maximales annuelles de glaces de mer dans notre aire d'étude ont décliné
respectivement de 5,2 et 1,7% par décennie. Ces tendances, qui ne sont pas statistiquement significatives en raison d'une variabilité interannuelle élevée, ont
entraîné une diminution du nombre d'îles demeurant entourées de glaces toute l'année (12,3% par décennie; au nord de l'aire d'étude) et une augmentation du nombre d'îles
qui passent toute l'année en eau libre (3,5% par décennie; au sud de l'aire d'étude). Ces deux tendances ne sont pas statistiquement significatives. La diminution de l'étendue
18 minimale des glaces de mer est plus rapide et conséquemment la diminution dans le nombre d'îles entourées de glace à l'année l'est aussi. Cependant, les changements dans l'étendue maximale des glaces pourraient avoir une plus grande significati vité biologique, car ceux-ci causent une disparition des ponts de glaces et une réduction majeure des probabilités de migrations de certaines espèces animales. C'est le cas de l'île Bonaventure où la dégradation (et quasi-disparition) du pont de glace est associée à un réchauffement des températures hivernales. À notre connaissance, cette étude est la première à mettre en relation le réchauffement climatique, la dégradation des ponts de glace et la biogéographie des îles situées dans les eaux du nord et de l'est canadien.
INTRODUCTION
From 1956 to 2005, global average air temperature has increased by O.l3°C per decade (Alley et al. 2007). This trend is largely responsible for changes in the sea ice conditions observed in the Northern Hemisphere (Vinnikov et al. 1999; Johannessen et al. 2004; Serreze 2007). From 1979 to 2007, minimum annual sea ice extent over the Northern Hemisphere has decreased by about 10.2% per decade, while the maximum annual sea ice extent (from 1979 to 2006) has decreased at the lower rate of 1.9% per decade (Comiso 2006a; Comjso et al. 2008). A recent acceleration of these trends (Stroeve et al. 2007) as well as a striking record low sea ice extent for September 2007 (24% less th an the last record low in 2005; NSIDC 2007) indicate that we may have reached a tipping point and that complete loss of perennial sea ice may now be inevitable (Kerr 2007; Meier et al. 2007). Thinning of the ice pack (Roth rock et al. 1999; Wadhams et Davis 2000; Maslanik et al. 2007) and changes in the dates of freeze-up and break-up resulting in a shorter sea ice season (Parkinson 2000; Comiso 2006b) parallel trends observed in sea ice extent.
Sea ice is an important component of northem ecosystems and sea ice degradation affects animal ecology (Stirling et al. 1999; Gaston et al. 2005; Carmichael et al. 2007; Chaulk et al. 2007). One important ecological function of sea ice is to facilitate movements of sorne animal species. For example, severa1 species use ice bridges when crossing between land masses (e.g.: Peary caribou (Rangifer tarandus pearyi); Miller et
20 al. 1977; and red fox
(Vulpes vulpes);
Lomolino 1986; Angerbjorn 1989; Lomolino 1990). Here we define an ice bridge as a continuous ice formation linking two land masses (e.g., one island and the nearby mainland). Even if man y species are goodswimmers (Jackson 1919; Carter et Merrit 1981; Diamond 1987), walking on ice is
often less risky and less energetically costly (Carter et Merrit 1981; Derocher et al.
2004), especially when currents are strong and water is cold. Therefore, the presence of
ice bridges increases the probability of migration between land masses.
To fully describe the importance of sea ice in the structure and functioning of
northern terrestrial ecosystems, and the ecological effects of current sea ice degradation,
the ideas introduced above must be integrated within the broader context of the theory of island biogeography (MacArthur et Wilson 1967). This theory stipulates that species diversity on islands depends on an equilibrium between immigration and extinction
(speciation also acts at the longest time scales; Kalmar et Currie 2006), these forces
being modulated by the area and spatial isolation of the island (Lomolino 2000b).
Spatial isolation was first defined as the distance between the island and its colonization
sources (MacArthur et Wilson 1967; Lomolino 2000a). However, several factors affect
the effective isolation of islands (Brown et Lomolino 2000; Lomolino 2000a; Lomolino
2000b; Ricketts 2001), by influencing the immigration probabilities of species. The
characteristics of the matrix surrounding islands and the migration capacities of species
are two such factors (Carter and Merrit 1981). The matrix surrounding an island can be
considered as an immigration filter which strength is reduced by the presence of an ice
bridge facilitating movement of sorne animal species. The strength of the filter will first depend on the duration, the timing of formation, the thickness, and the stability of the
ice connections. It will also de pend on the life history characteristics of the species (e.g. body size and timing of migrations) and on the geography of the islands (e.g. distance
from mainland) considered. The presence of ice bridges is thus an important component
of island biogeography, as they reduce the effective isolation of sorne insular populations and thus Iimit their extinction risks (Banfield 1954; Lomolino 1986;
Lomolino 1994). It also faci1itates the co1onization of islands by new species, and
species diversity of northem ecosystems is th us influenced by the presence of ice
bridges. The theoretical relationship between the presence of ice bridges and the species richness on islands has been described by Lomolino (2000b, Fig. 9). This relationship is
supported by data on mammalian richness within archipelagos located in lacustrine vs.
coastal and marine environments (Lomolino 1994). Of course this relationship applies
only to those species (mostly non-volant mammals) whose migrations are facilitated by
the presence of an ice bridge.
Canadian northem and eastem waters are home to 47,422 islands covering about 15.5 % of Canada's terrestrial land area (rocks or islets depicted on 1 :250000 maps as dots are excluded; Natural Resources Canada 2006). From now on, we will refer to the
east part of Beaufort Sea, the Canadian Arctic Archipelago, the Hudson Bay and the
Baffin Bayas the northem Canadian waters and to the Labrador Sea and the Gulf of St-Lawrence as the eastem Canadian Waters. These islands support ecosystems that cope
with various degrees of isolation from the mainland, and with various lengths of the sea
ice season. This represents the largest complex of insular ecosystems surrounded by sea ice in the world. Our working hypothesis is that changes in sea ice cover at the scale of northem and eastem Canadian waters should follow the same direction th an those
22
observed at the scale of the whole Northern Hemisphere, and that the complex of
islands studied should thus be experiencing a degradation of its ice connections to other
land masses. Although Lomolino (1994) has already highlighted possible impacts of sea
ice degradation on island ecosystems, to our knowledge nobody has yet studied or tried
to anticipate how the terrestrial ecology of the complex of islands located in the
northern and eastern Canadian waters might be affected by the currently accelerating
degradation of sea ice. This paper offers a first step in that direction. To this end, we
first look at the regional scale and assess which islands have undergone changes in their
ice connections in the last decades. In that context, our first two objecti ves are 1) to
quantify changes in sea ice co ver over northern and eastern Canadian waters in the last decades, and 2) to evaluate quantitatively how these changes in sea ice conditions have
altered the sea ice connections of islands located in northern and eastern Canadian
waters. Remote sensing data are analysed to meet these two objectives as they permit a
large scale exploration of the evolution of sea ice conditions through time. We then look
at the local scale, in particular the Bonaventure islands, located at the southem margin
of our study area. We chose this island because the history of its ice bridge is weil
documented by local inhabitants and because it is expected that significant changes in
sea ice conditions should be felt over this region. Our third objective is to describe the
cIimate and ice bridge history of that particular island. Understanding the local roots of
large scale sea ice patterns is essential if one is to fully understand the biogeographical impacts of sea ice degradation on the functioning of insular ecosystems.
MATERIALS AND METHODS
Studyarea
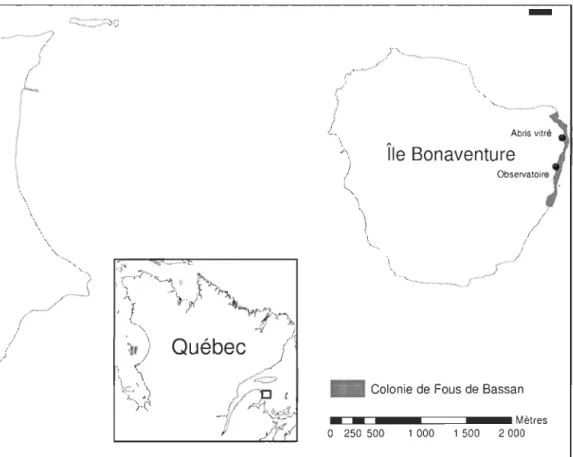
We selected a 10,289,548 km2 study area that contained almost ail of the marine islands of the northern and eastern Canadian waters (Fig. 1). Because of the limited coverage of the ice charts for the years 1980 to 1998, we were not able to include sorne islands located at the northern end of Ellesmere Island (19 islands) and in southern James Bay (26 islands) (Fig. 1). This study area is characterized by a range of temporal sea ice coyer from all-year presence at the northern limit to all-year absence at the southern limit. We recorded the position of the center of each island larger than 1 km2 (but sm aller than 130 km2
) located within this study area using the SoftMap software version 5 (SoftMap Technologies Inc. 2006). Position and area of islands with areas of 2: 130 km2 were taken from the Virtual Atlas of Canada (Natural Resources Canada 2006). We recorded 2973 islands with an area larger than 1 km2
.
At the local scale, we examined Bonaventure Island (48°29'41" N and 64°09'44" W), which is located 3.5 km from the coastal town of Percé, at the eastern tip of the Gaspé Peninsula (Quebec, Canada, Fig. 1). This 4.14 km2 island is part of Quebec's National Park Île-Bonaventure-et-du-Rocher-Percé. We selected this island for our local scale study because of available information about the history of ice bridges linking the island to the continent.
24 Sea ice extent
To quantify the extent to which sea ice cover over northern and eastern Canadian waters has been changing in the last decades, we measured annual minimum and maximum sea ice extents across our study area using remote sensing data. We used
weekly regional digital ice charts produced by the Canadian !ce Service from 1980 to
2005. These charts integrate ail the information available at the time, including but not limited to weather conditions, visual observations, and data obtained from instruments
canied on aircrafts and satellites (Barber et Iacozza 2004). Data are classified using the
international "egg" code defining areas by ice concentration (total ice coverage of an
area), type, f10e size, thickness, age and stage of formation (Canadian !ce Service 2008).
Each chart was imported in ArcMap software version 9.2 (ESRI Inc. 2005). Each
polygon (area) was classified according to 5 categories of cover: land, open water, sea ice (land-fast ice, or ice with concentration ~ 7/10), marginal ice zones (ice with concentration ::: 6/1 0) and no data. In the following we will refer to ice covered area as
area covered by sea ice with concentration equal or higher than 7110 including land fast
ice. We choose this threshold since over this value, ice packs is assumed continuous
enough to allow for animal movement (Canadian !ce Service 2008).
For each year of the study period, we identified the chart with minimum sea ice
extent by comparing ail weekly charts in a time window extending from the last week of
August to the first week of October. In late winter/early spring (maximum extent) sea
ice charts covering ail of our study area are only availabJe monthly (rather th an weekly).
extent, we use March 31 st / April 1 st data, which is around the time when the Arctic sea ice cover is at its maximum extent (Schiermeier 2007). Sorne yearly variations in the timing of maximum sea ice extent however do exist. This leads to sorne noise in the data sets (see discussion section). We excluded from analysis the minimum sea ice extent of 1990 and the maximum sea ice extent of 1982 because of gaps in the data sets. Therefore the full dataset contains 25 years although the study period goes from 1980 to 2005.
Ice bridges
To evaluate quantitatively how these changes in sea ice conditions have altered the sea ice connections of islands located in northern and eastern Canadian waters, we determined the number of islands that were surrounded by sea ice at both minimum and maximum sea ice extents using the ArcMap select by location function.
Bonaventure Island
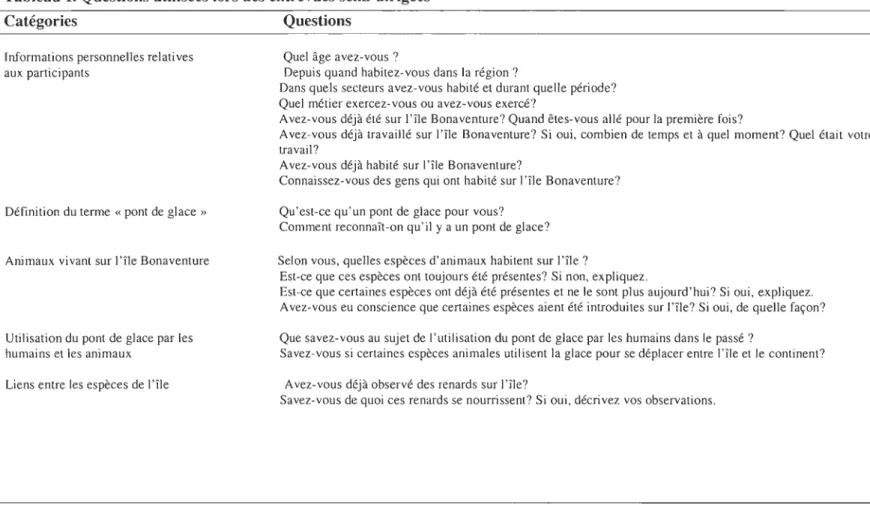
When describing the climate and ice bridge history of Bonaventure Island, we faced an absence of quantified, long-term sea ice data of high enough precision to conclude about the presence/absence of ice bridges. However, local knowledge about the past presence of ice bridges between Bonaventure Island and the continent was available given that humans use these ice bridges for traveling. We therefore conducted semi-directed interviews to gather historical data on the sea ice environment of Bonaventure Island. Semi-directed interviews include open questions which allow
26 informants to introduce topics that had not been anticipated by the interviewer
(Ferguson et Messier 1997; Huntington 1998; Huntington 2000). During the summer of
2006, we interviewed nine informants that had been selected based on their knowledge of the subject. Ali informants spent most of their life in the Percé region and eight were
born there. Age of informants ranged from 51 to 88 (average: 62 years; two informants did not provide their age). Interviews were performed individually by the lead author.
Questions were formulated so as not to bias answers (Table 1; Fraser et al. 2006).
Scientific vocabulary was avoided and sorne terms (e.g. ice bridge) were defined with the informants at the beginning of each interview. Interviews were taped and later transcribed in a digital written format. Interview procedures were approved by the Comité d'éthique de la recherche of Université du Québec à Rimouski (permit
CÉR-39-97).
We used daily sea ice charts available since 1997 as a further source of
information about the Bonaventure Island ice bridge. Those charts are produced by the Canadian Ice Service using RADARSAT images combined with visual observations
(helicopters, ships, etc.). Original data were interpolated on a grid with a 5 km
horizontal resolution (Saucier et al. 2003). We compared information about the ice bridge obtained during the interviews with daily sea ice concentrations given for three
grid points adjacent to the island (Fig. 1).
We used temperature data from GASPE (48.83 oN, -64.48°W, from 1916 to1985)
Environment Canada 2007) to describe trends in average winter temperature and total
number of freezing degree days (FDO, described below) in the Bonaventure Island
region. These stations were the nearest from our study area (GASPE: 42.8 km, GASPE
A: 38.2 km). When data were available for both stations, we used data from the Gaspe
A station which was the closest from Bonaventure Island. We first calculated average
monthly temperatures, using ail average daily temperatures available for a given month.
average monthly temperature for a given month was considered to be val id wh en data
were available for 2: 80% of the days (World Meteorological Organization 1996). When
valid data were available for ail winter months of a given year (73 years out of 91), we
calculated the mean annual winter temperature (Oecember to March). FDO is the
number of degrees below freezing during one day. In this case, we used -1.8°C as the
freezing temperature since marine water in Bonaventure Island's region has a salinity
around 30 ppm. For example, FDO = 15.5 if the average daily temperature is -17.3°C.
The cumulative FOO is a summation of FOOs over ail days with average daily
tempe rature below -1.8°C. FOO is directly linked with sea ice growth. We calculated
the cumulative FOO for every year in which ail daily FDOs were available (59 years out
of 91).
Statistics
We used linear regressions to measure rates of change through time of sea ice
extent and of number of islands surrounded by sea ice. When expressing changes
28 reference. We also used linear regressions to measure rates of change through time of average winter temperature and cumulative FDDs.
RESULTS Sea ice extent
Between 1980 and 2005, average cover of sea ice across the study area was more than five times higher at maximum extent (4,086,993 km2
) than at minimum extent (8]2,046 km\We found a decreasing trend of 42,547 km2 per decade (5.2 % / decade, r2
=
0.05, n=
25, P=
0.31, F=
].10) in the minimum extent of sea ice from 1980 to 2005 (Fig. 2a). Maximum extent of sea ice also declined during this time period, but at a much slower rate of 70,064 km2 per decade (1.7 % / decade, r2=
0.08, n=
25, P=
0.18, F = 1.95; Fig. 2b). Both of these trends are not statistically significant. Figure 1 shows the area that was (from 1980 to 2005) covered every year by sea ice when sea ice is at its minimum extent (220,313 km2) and the area that was covered every year by sea ice when sea ice is at its maximum extent (3,501,399 km2).
[ce bridges
On average, there were 208 islands (7.0% of aIl islands included in our study area) surrounded by sea ice at minimum extent compared to 2,614 islands (87.9% of ail islands included in our study area) at maximum extent. From 1980 to 2005, the number of islands surrounded by sea ice at minimum extent has declined at a rate of 26 islands
per decade (12.3 % / decade, r2
=
0.08, n
=
25, P=
0.17, F=
2.05; Fig. 3a). At maximum sea ice extent, the rate of decrease in the number of islands surrounded by sea ice was 12 islands per decade (0.5 % / decade, r2=
0.03, n
=
25, P=
0.40, F=
0.74; Fig. 3b). This corresponds to a 3.5% increase per de cade in the number of islands that are surrounded by open water ail year round.Bonaventure Island
Below we present the data from interviews along with the number of informants who answered each question in a given way and the number of informants who answered each question. Most informants reported that the ice bridge now forms less frequently th an it used to (7/9). Some informants reported that an ice bridge formed very regularly between the island and the mainland until the mid or late 1950's, but that it became less frequent since the end of the 1950's or the beginning of the 1960's (3/9). Informants reported that ice bridges lasted from one to four months in the past (5/8), while they lasted for one day to two weeks in the last few years (3/8). Informants reported that an ice bridge has rarely formed since the early or mjd-l980's (6/9), and when it di d, it was for a shorter period of time than in the past (4/8). According to one informant (G. Bourget) considered locally to be the most knowledgeable about Bonaventure Island's ice bridge (he kept personal records of the presence of ice bridges), since 1985 an ice bridge thick enough to support a man only formed in 1995 and 2005. According to him, the ice bridge formed for about five weeks in 1995 while it stayed for less than two weeks in 2005. G. Bourget also reported that in 2002, land-fast
30 ice formed up to 1 km off the coast of Percé. Finally, sorne informants reported that when an ice bridge forms, it doesn't get as thick as it did in the past (4/8).
Daily sea ice concentration data (1997-2005) indicated that for the three grid points nearby the island, land-fast ice was only present during two years (2002 and
2005) and only at the grid point located near the coast.
Analysis of weather data shows that average winter tempe rature increased by 0.09 CO per decade from 1916 to 2006 (r2
=0.08, n = 73, p=0.02, F = 5.88; Fig. 4a). This
resulted in a decrease of FDDs of 23.9 degree days/decade from 1916 to 2005 (r2=0.15,
n =59, p=0.002, F = 10.39; Fig. 4b).
DISCUSSION
Our regional sc ale analysis based on sea ice archives reveaied trends that are aIl in
the direction that was expected from our hypothesis. Indeed, from 1980 to 2005,
minimum and maximum sea ice extents in northern and eastern Canadian waters have
decreased and consequently, sorne islands have experienced changes in their sea ice
environment. Bonaventure Island is one of these, with the observed degradation of its
ice bridge paraIleled with increasing local air temperatures.
Although trends observed for minimum and maximum sea ice extent are consistent with expectations, they lack statistical significance. This is a consequence of
the large inter-annual variability of the data, combined with their limited time span (n
=
25 years). The large variability in maximum sea ice extent is in part intrinsic, but is also probably partly due to the use of a fixed date to calculate maximum sea ice extent.Sea ice extent
The rate of change (5.2% / decade) of minimum sea ice extent for northern and eastern Canadian waters is smaller than calculated for the entire Northern Hemisphere (8.6% / decade; Comiso 2006a). This difference reflects regional differences in terms of the magnitude of sea ice degradation. Indeed, because of dominant wind patterns, thick ice floes coming from the central Arctic tend to aggregate near and between the islands of the Canadian Arctic Archipelago (CAA; Canadian !ce Service 2007). These ice floes combine with ice formed locally in the CAA, which result in sorne of the thickest ice floes worldwide (Bourke et Garrett 1987). Summer sea ice extent for the CAA and for the Central Arctic (in part included in our analysis) are thus declining at much lower rates than in regions such as Chukchi and Siberian seas, where the steepest declines have been observed (-8.2 and -0.5% in the CAA and Central Arctic regions, respectively, from 1979 to 2006 vs. -23.6 and -17.2% in the Chukchi and Siberian seas, respectively; Meier et al. 2007). The CAA is expected to be one of the last places where summer sea ice coyer will remain (Canadian lce Service 2007). However, it is important to note that the 2007 record low for the whole Northern Hemisphere (2007 is not included in our analysis) was peculiar in that major ice losses occurred in the entire Arctic, including the CAA (Canadian !ce Service 2007). The north-west passage was even completely open for the first time in human memory (NSIDC 2007). This event
32 suggests that perennial sea ice co ver may be more vulnerable than expected (Kerr 2007).
Decreasing trends (1.7%) for maximum sea ice extent across our study area is comparable to the value of 1.9% calculated for the whoJe Northem Hemisphere (Comiso 2006a). Six of the last 7 years of our analysis (1999 to 2002, 2004 and 2005) are weil below the long term average (4,086,993 km2
; Fig. 2b). This may indicate the acceleration of the decreasing trend in maximum sea ice extent and may reflect the increasing importance of the sea-ice-albedo feedback (Meier et al. 2005); decreasing summer sea ice extent causes increasing absorption of heat by dark water surfaces which in turn results in delayed onset of freeze-up and a shortened period for sea ice growth. One point that must be underlined here is that, even if winter warming is greater in the northern part of our study area (AIley et al. 2007), winter ice co ver is more affected in the southern parts. This is illustrated in Figure 1 by the area that was every year covered by ice when sea ice extent is at its maximum from 1980 to 2005. In fact, despite increasing winter temperature in the northem regions of our study area, air temperature during this period was al ways cold enough for ice to forrn. Anomalies found in maximum sea ice extent are thus mainly due to ice loss in the south of the study area. Comiso (2006a) found major negative anomalies of sea ice concentration (up to -57.5 %) on the coast of Labrador, the eastem coast of Newfoundland and in the Gulf of St-Lawrence in January and February 2005 and 2006 (record lows for the NH). These results, in contrast with no or slightly positive anomalies in the CAA during the same period support the idea that reductions in winter sea ice cover are mainly occurring in the south of our study area. Our results are also supported by Johnston et
al. (2005) who found that 1996 to 2002 (study stops in 2002) were light ice years in the Canadian east coast with major ice cover reductions on the east coast of Newfoundland and in the Gulf of St-Lawrence.
Ice bridges
There are more islands located in the northem part of our study area, where sea ice tends to be perennial, than in the southem part, where sea ice is seasonal (Fig. 1).
Therefore the decrease in the number of islands that are surrounded by ice at ntinimum sea ice extent was more pronounced th an the decrease in the number of islands that are surrounded by sea ice at maximum sea ice extent. In other words, the decrease in number of islands that are surrounded by sea ice ail year round was greater than the increase in number of islands that are free of sea ice ail year round.
Bonaventure Island
Bonaventure Island is a clear example of one island that faced a degradation (and quasi-disappearance) of its ice-bridge. The interviews we conducted about the history of the ice bridge of Bonaventure Island yielded information that would not have been available using other methods. However, a number of biases are inherent to data gathered using interviews and should be considered here. First, the informants considered an ice bridge as a stable ice structure that allows a human to cross between an island and the mainland. However, even if the informants consider ice bridges to be increasingly rare, ice floes may still aggregate for a few hours or a few days in the
34
channel between the island and mainland allowing non-human animal to safely travel
between these two land masses. Furthermore, it is c1ear that the state of the ice bridge is
followed less closely nowadays than it used to be, since no one is allowed anymore to
live on or visit the island in winter due to its status as a National Park. Finally, it is possible that the agreement between informants is in part due to the fact that meteorological conditions and the state of the ice bridge are two major discussion topics
in the town of Percé. Oespite these biases, information gathered during the interviews
aligns weil with information taken from daily sea ice concentrations around
Bonaventure Island from 1997 and 2005. On one hand, 2002 and 2005 are the only
years (after 1997) during which land-fast ice was present near the islancJ. On the other
hand, according to the informants, 2005 is the only year (after 1997) during which an
ice bridge formed between Bonaventure Island and the nearby mainland. According to
them, in 2002, there was no ice bridge, but ice had formed up to 1 km from the coast.
This comparison allowed us to see that the presence of an ice bridge as specified by informants was detectable when looking at sea ice concentration data. At a larger spatial
scale, studies show that years 1996 to 2002 (Johnston et al. 2005), 2005 and 2006
(Comiso 2006a) were characterized by low sea ice cover in the Gulf of St-Lawrence,
which is consistent with the observation that the ice bridge rarely formed during those
years.
Winter temperatures and cumulative FDOs in the Bonaventure Island region
confirmed that winters are warmer now than the y used to be, thus linking atmospheric
conditions to ice bridge presence or persistence. In fact, year to year FDO anomalies
came out from the interviews. While from the beginning of the 1950's, cumulative
FDDs were almost always under the long-term average (986.0 degree days; Fig. 4b), it
is since the late 1950's or early 1960's that the ice bridge started to form Iess frequently. However, while the ice bridge became even rarer from the 1980's onwards, five of the six years for which we have data between 1989 and 1997 have cumulative FDDs above
the long-term average (1989, 1991, 1994, 1995 and 1997). This contradiction is
probably due to the fact that during those years (1983-1996) an icebreaker regularly traveled between the island and the coast, thus preventing ice bridges from forming (Rémi Plourde, Park director, pers. comm.).
The future
As the cIimate warmjng continues, the ice melt season is expected to last longer
and the minimum sea ice extent will continue to decrease in the Northem Hemisphere
(Holland et al. 2006; Stroeve et al. 2007; Tremblay et al. 2007). As a consequence, the loss of sea ice connection during summer could extend to ail islands that were once located in perennial sea ice zones. However, predictions about sea ice extent in the CAA should be considered with care since the current resolution of models is
inadequate to predict what will happen in such geographically complex areas (B.
Tremblay, pers. comm. 2007). Because of the trapping effect of the islands and of the
thickness of the ice in this region (Bourke et Garrett 1987), the CAA may be one of the
last places with September sea ice cover (Holland et al. 2006). Nevertheless, the 2007 dramatic record low for September sea ice extent raises the possibility that perennial sea