A THESIS PRESENTED TO THE ÉCOLE DE TECHNOLOGIE SUPÉRIEURE
IN PARTIAL FULFILLMENT OF THE THESIS REQUIREMENT FOR THE DEGREE OF
PHILOSOPHY DOCTOR IN ENGINEERING Ph.D.
BY PUYUN MA
A FRESH ENGINEERING APPROACH FOR THE FORECAST OF FINANCIAL INDEX VOLATILITY AND HEDGING STRATEGIES
MONTRÉAL, JUL Y 28, 2006
Dr. Tony Wong, Thesis supervisor
Département de génie de la production automatisée à l'École de technologie supérieure
Dr. Thiagas Sankar, Thesis co-supervisor
Département de génie de la production automatisée à l'École de technologie supérieure
Dr. Edmond T. Miresco, President
Département de génie de la construction à l'École de technologie supérieure
Dr. Bruno de Kelper, Examiner
Département de génie électrique à l'École de technologie supérieure
Dr. Virendra Jha, Examiner
Vice-president, Science, Technology and Programs, Canadian Space Agency
THE THE SIS W AS DEFENDED IN FRONT OF THE EXAMINA TION COMMITTEE AND THE PUBLIC
ON JUL Y 28, 2006
Pu YunMa
SOMMAIRE
Cette thèse vise à apporter une nouvelle perspective sur un problème important en ingénierie financière - la prévision de la volatilité des indices boursiers. La volatilité des indices boursiers est une mesure du risque dans le domaine de l'investissement. De plus, la volatilité journalière est un facteur déterminant dans l'évaluation des prix et dans l'application des stratégies de couverture de risque. Or, le succès dans l'estimation et la prévision de la volatilité est encore loin d'un niveau acceptable.
En intégrant d'une façon judicieuse les méthodes analytiques (la transformée par ondelettes, l'optimisation stochastiques basée sur les chaînes de Markov) et les méthodes de l'intelligence computationnelle (les algorithmes évolutionnaires dans un contexte de 1' exploration de données), les travaux de cette thèse ont mené à une stratégie systématique permettant la caractérisation et la prévision de la volatilité dont le niveau de succès est supérieur aux méthodes standards de l'industrie.
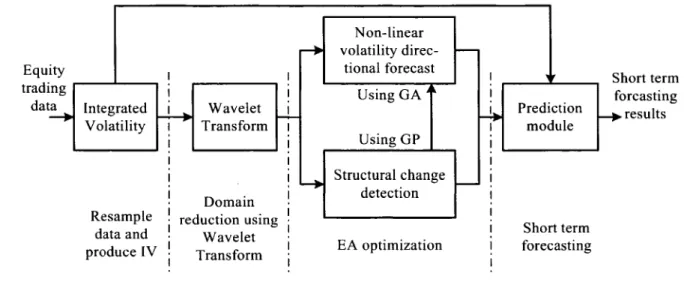
L'aspect saillant de la stratégie proposée est « la transformation et le traitement séquentiel». En considérant la variation des indices boursiers comme un signal temporel et stochastique, cette thèse préconise une stratégie en cinq étapes : i) transformation des données variables en volatilité intégrée, c'est -à-dire passage d'un phénomène non observable à un qui est observable; ii) détermination de l'horizon temporel propice à la prévision par la transformée par ondelettes; iii) formulation des coefficients d'ondelettes en ensembles de données récursives; iv) extraction, par algorithmes génétiques, des règles de type « IF - THEN » caractérisant les structures cachées ou inhérentes des données; v) effectuer la prévision de la volatilité à court terme en appliquant la programmation génétique et en utilisant les règles dégagées dans 1' étape précédente. Ces étapes et la stratégie proposée sont appuyées sur le cadre théorique de 1' optimisation stochastique, ce qui constitue une contribution majeure de cette thèse.
Pour appliquer concrètement cette approche, des données historiques de S&P l 00 s'échelonnant sur 5 ans ont été utilisées pour générer les règles de caractérisation. Ces règles sont ensuite appliquées dans la prévision de la volatilité. L'analyse statistique des résultats ont permis de constater un taux de succès moyen supérieur à 75%. Dépassant ainsi la performance des méthodes de prévision publiées dans la littérature. Il s'agit là une autre contribution de ce travail de recherche.
Pu Yun Ma
ABSTRACT
This thesis attempts a new light on a problem of importance in Financial Engineering. Vola:tility is a commonly accepted measure of risk in the investment field. The daily volatility is the determining factor in evaluating option priees and in conducting different hedging strategies. The volatility estimation and forecast are still far from successfully complete for industry acceptance, judged by their generally lower than 50% forecasting accuracy.
By judiciously coordinating the current engineering theory and analytical techniques such as wavelet transform, evolutionary algorithms in a Time Series Data Mining framework, and the Markov chain based discrete stochastic optimization methods, this work formulates a systematic strategy to characterize and forecast crucial as well as critical financial time series. Typical forecast features have been extracted from different index volatility data sets which exhibit abrupt drops, jumps and other embedded non-linear characteristics so that accuracy of forecasting can be markedly improved m comparison with those of the currently prevalent methods adopted in the industry.
The key aspect of the presented approach is "transformation and sequential deployment": i) transform the data from being non-observable to observable i.e., from variance into integrated volatility; ii) conduct the wavelet transform to determine the optimal forecasting horizon; iii) transform the wavelet coefficients into 4-lag recursive data sets or viewed differently as a Markov chain; iv) apply certain genetic algorithms to extract a group of rules that characterize different patterns embedded or hidden in the data and attempt to forecast the directions/ranges of the one-step ahead events; and v) apply genetic programming to forecast the values of the one-step ahead events. By following such a step by step approach, complicated problems of time series forecasting become less complex and readily resolvable for industry application.
To implement such an approach, the one year, two year and five year S&PlOO historical data are used as training sets to derive a group of 1 00 rules that best describe their respective signal characteristics. These rules are then used to forecast the subsequent out-of-sample time series data. This set of tests produces an average of over 75% of correct forecasting rate that surpasses any other publicly available forecast results on any type of financial indices. Genetic programming was then applied on the out of sample data set to forecast the actual value of the one step-ahead event.
The forecasting accuracy reaches an average of 70%, which is a marked improvement over other current forecasts. To validate the proposed approach, indices of S&P500 as weil as S&P 100 data are tested with the discrete stochastic optimization method, which is based on Markov chain theory and involves genetic algorithms. Results are further validated by the bootstrapping operation. Ali the se trials showed a good reliability of the proposed methodology in this research work. Finally, the thus established methodology has been shown to have broad applications in option pricing, hedging, risk management, VaR determination, etc.
Pu YunMa
RÉSUMÉ
La volatilité d'un actif, défini par l'écart-type du taux de rentabilité, est souvent utilisée pour déterminer le prix du marché. La volatilité quotidienne est une variable cruciale dans l'évaluation du prix des options et dans le choix d'une stratégie de couverture du risque surtout dans le contexte où l'industrie des fonds de placement à risque connaît une forte croissance. L'importance de la volatilité a été dûment reconnue en 1997 et en 2003 par le décemement de prix Nobel aux chercheurs travaillant sur ce sujet. Dans le domaine de l'investissement, on peut négocier la volatilité directement par des contrats à terme ou indirectement en misant sur différents arrangements d'options (différent entre l'offre et la demande, différence entre présent et le futur, etc.). À la différence du taux de rentabilité, la volatilité a été confirmée pour être raisonnablement prévisible (Alexandre, 2001) et est devenue, pour un grand nombre d'analystes, un sujet d'intérêt d'exploration et d'exploitation.
La volatilité ponctuelle est latente tandis que la volatilité intégrée (IV) est une mesure efficace de la volatilité quotidienne de l'actif. Elle est obtenue à partir des transactions de haute fréquence (Andersen, 1998, 200lb) enregistrées. La recherche contemporaine sur le comportement de la volatilité est dominée par des méthodes statistiques paramétriques de type GARCH (Generalized Autoregressive Conditional Heteroscedastic) (Davidson & MacKinnon, 1993). D'une manière générale, les méthodes statistiques utilisent des modèles discrets pour traiter les données historiques du rendement d'un actif. La variance, par exemple, est une mesure convenable de la volatilité d'une telle série temporelle. L'objectif de ces modèles statistiques consiste à obtenir la meilleure correspondance possible entre la série temporelle produite par un modèle et celle des données historiques. Cependant, le pouvoir de prévision résultant n'est pas toujours convaincant (Harvey Dec 1999, Peters 2001, Chong et al. 1999, Park 2002, Brooks 1998, 2003, Christofferson 2004) et les modèles n'ont pas pu démontrer leur efficacité dans un contexte réel. De nos jours, les analystes en investissement ont développé des produits commerciaux qui sont basés sur des méthodes ad-hoc non divulguées. Le mieux connu de ces produits, est le « Volatility Report™ » permet aux investisseurs d'identifier les moments propices à des transactions de la volatilité en se basant sur un indice de volatilité propre et qui mesure la volatilité sous-jacente plus exactement et efficacement que des méthodes traditionnelles.
Selon les développeurs du Volatility Report™, le système est capables de prévoir correctement la direction future de la volatilité à une moyenne de 72%- 75% du temps dans l'univers des titres et des actions. Compte tenu que la méthodologie employée par ce système (et d'autres projets de recherche à caractère confidentiel) est du domaine privé, notre objectif de recherche est donc de réaliser une meilleure prévision à 1' aide de techniques d'ingénierie connues et de produire ainsi des méthodologies systématiques et reproductibles.
Dans cette recherche, nous établirons des relations entre l'ingénierie et des méthodes du domaine des finances. Nous avons ainsi développé une approche systématique dans la prévision de la volatilité d'un ensemble d'indices boursiers. L'approche préconisée implique les algorithmes évolutionnaires (EA) dans un contexte d'exploration de données temporelles (TSDM). Cette approche est appuyée sur la théorie de 1' optimisation stochastique et les chaînes de Markov.
Un concept clef emprunté de l'ingénierie consiste à appliquer des transformations judicieuses des données avant d'effectuer le traitement et l'analyse. Nous avons donc converti les données historiques des indices sous forme de la volatilité intégrée (IV) et puis en coefficients d'ondelette. Par la suite, le signal transformé est traité par l'algorithme génétique (GA) et la programmation génétique (GP) afin d'identifier les structures inhérentes qui sont favorables à la prévision de la volatilité.
L'exploration de données (Data Mining) est le terme employé pour représenter le processus d'analyse de données dans le but de découvrir des modèles cachés. Povinelli ( 1999) a formulé le concept TSDM qui révèle les modèles temporels cachés qui sont caractéristiques d'événements d'une série temporelle. Pour trouver ces modèles, la série de temps est incorporée dans un espace de phase reconstruit avec un retard unitaire et d'une dimension D. C'est-à-dire, la série temporelle est formée en créant le chevauchement des observations :
8={8,,t=j,K ,j+N}.
La série de prévision est alors formée à partir d'une seule observation : 11={8,,t=j+N+1}
où
ei
est la valeur de la série au temps t = j, alors que N est la taille de la fenêtred'observation. Les structures temporelles intéressantes sont alors identifiées par la fouille utilisant les techniques GA/GP. Ces structures sont déterminées par les 4 points précédents 81 de la série IV pour permettre la prédiction de llt dans le prochain intervalle
de temps.
L'optimisation stochastique discrète (DSO) procure un appui théorique à l'approche proposée dans cette recherche. En employant la méthode DSO présentée par Andradottir (1995, 1999), nous démontrons la faisabilité et la convergence d'un GA pour le cas de la
non-homogénéité temporelle. Andradottir a proposé d'utiliser toutes les valeurs de fonction d'objectif observées produites comme la trajectoire de la fouille aléatoire autour d'une région faisable pour obtenir des évaluations de plus en plus précises de la fonction d'objectif. À n'importe quel temps donné, la solution faisable qui a la meilleure valeur d'objectif évaluée, par exemple le plus grand pour des problèmes de maximisation est utilisé comme l'évaluation de la solution optimale.
Parallèment, Andradottir a spécifié le taux de convergence de cette méthode et a montré que la convergence est garantie presque assurément à 1' ensemble des solutions optimales globales. La convergence numérique présentée par Andradottir ( 1996b) et par Alrefaei et Andradottir ( 1996a, c) suggère que cette technique pour évaluer la solution optimale est supérieure en comparaison avec d'autres techniques parue dans la littérature.
La condition d'application de l'analyse DSO est que la série temporelle soit une chaîne de Markov. Cette condition est satisfaite par notre proposition. Rappelons que les données historiques sont d'abord transformée en une série IV puis en une série de coefficients d'ondelette. La fenêtre mouvante de la IV avec 8 = {8,+h j = 0, 1, 2, 3} convertira ces coefficients en un ensemble de symboles {1, 2, 3, 4 *} en se basant sur des intervalles tels {(-oo, -a], (-a, b], (b, c], (d, oo), *},où«*» signifie« peu importe». Ainsi, les données seront transformées en une série de nombres.
Incidemment, on peut démontrer que ce processus de transformation produit une chaine de Markov. Les règles de traitement utilisées par les algorithmes évolutionnaires ont la forme <IF [((8, = !) AND/OR (81+1 = J) AND/OR ((81+2 = K)) AND/OR (8,+3 = L))], THEN (8,+4 =M)> où la fonction de caractérisation g(t)
=
8,+4 aura comme valeur, un entier dans l'intervalle [1, 4] prévoyant la direction et l'étendue de la valeur subséquente de la série IV. Dans chacune des itérations, 100 règles par groupe pour un totale de 100 groupes sont générées d'une façon aléatoire et indépendante. Ainsi, nous pouvons définir une fonction stochastique :X(8)
=
{1, if {8,8,+1'8,+2,8,+3,8,+4 } correspond à la séquence de données;0, autrement.
où {8,, 8 t+l, 8 1+2, 8 t+J, 8 1+4, AND, OR, *} représente les règles. Conséquement,./{8) dans 1' expression suivante:
maxf(8), where /(8)
= E{X(8)} '\7'8
Ee.
8EE>serait l'espérance mathématique de l'exactitude de la prédiction E{X(8)} pour une règle 8. Après l'optimisation de }(8), les 100 meilleures règles seront utilisées dans le processus de la prédiction.
Les données quotidiennes de S&P100 et ensuite S&P500 ont été employées pour évaluer la validité de l'approche proposée. Dans chaque cas, la première partie du jeu de données est utilisée comme le jeu d'apprentissage, tandis que la partie suivante est utilisée pour calculer l'exactitude de prédiction des règles. Dans tous les essais,
l'exactitude de prédiction a été supérieure à 60 %, tandis que les résultats de obtenus par application des concepts de la DSO sont supérieurs à 70 %. De plus, la vitesse de traitement a été 10 fois plus rapide que celle d'un algorithme génétique conventionnel en raison de l'utilisation vaste de mémoire pour tenir les règles évaluées durant 1' exécution de 1 'algorithme.
Resuming formai study after a pause of nearly a decade is indeed a challenge beyond my initial anticipation. Throughout the entire process however, I am blessed to attain the generous support from many professors, colleagues, friends, family members and particularly from my thesis co-supervisor Dr. T. S. Sankar who encouraged me to do this Ph.D. at ETS, helped me beyond a professor's capacity to overcome many rough moments, mentored me at those critical stages and provided the financial support to complete the joumey. My other thesis co-supervisor Dr. T. Wong guided me through the research especially during the literature publication process and replenished the funding whenever necessary to ensure a smooth voyage. Raymond Sui of Positron lnc. helped me in the complex computer programming to ensure the proposed method is being implemented effectively and efficiently. Dr. H. F. Li of Concordia University provided valuable inputs regarding the methodology developed in the current research.
"The ocean of knowledge has no shore", such a Chinese idiom has duly reflected the pursuance of my Ph.D. voyage during the past few years. My Master HeUyer Chan jump-started the expedition and tirelessly cheerleads along the route. And my wife Grace Y eung strived as usual to keep the boat afloat. If the completion of this phase of study is like a boat reaching a dock at a midway island, it has been an exciting yet rewardingjoumey that showcased all participants' efforts.
I feel extremely privileged to have this opportunity to associate with such a group of intellectually celebrated and/or practically empowered individuals. The experience will undoubtedly enlighten my future endeavor in pursuance of further knowledge expansion.
Page
SOMMAIRE ... i
ABSTRACT ... ii
RÉSUMÉ ... iv
ACKNOWLEDGEMENT ... viii
LISTE OF TABLES ... xiii
LISTE DES FIGURES ... xiv
LIST OF SYMBOLS ... xv
LIST OF ACRONYMS ... xvii
INTRODUCTION ... 1
CHAPTER 1 CURRENT STATE OF THE ART OF VOLATILITY FORECAST ... 6
1.1 Need to Forecast Financial Index Volatility ... 6
1.2 Parametric Volatility Forecasting ... 8
1.3 Difficulties with Parametric Approach ... 10
1.4 Currently Best Known Results ... 12
1.5 Alternative Forecasting Methods ... 13
1.6 Engineering Persepctive with Wavelet Transforms ... l5 1. 7 Finance Perspective with Evolutionary Algorithms ... 16
1.8 Impact of this Research ... 19
1.9 Problem Statement ... 20
CHAPTER 2 RELEVANT LITERA TURE SUR VEY ... 22
2.1 Vo1atility Forecasting with Genetic Programming- Key Publications ... 23
2.1.1 "Volatility forecasting using genetic programming" (Pictet et al., 2001) .23 2.1.2 "Genetic programming with syntactic restrictions applied to financial volatility forecasting" (Zumbach et al., 2001) ... 24
2.1.3 "Using genetic programming to model volatility in financial time series: the cases ofNikkei 225 and S&P 500" (Chen and Y eh, 1997) ... 26
2.1.4 "Predicting exchange rate volatility: genetic programming vs. GARCH and RiskMetrics" (Neely and Weiler, 2001) ... 27
2.1.5 "Extended daily exchange rates forecasts using wavelet temporal resolutions" (Kaboudan, 2005) ... 28
2.1.6 "Forecasting high-Frequency financial data volatility via nonparametric algorithms -evidence from Taiwan financial market" (Lee, 2005) ... 29
2.2.1 "Explaining exchange rate volatility with a genetic algorithm" (Lawrenz
and Westerhoff, 2000) ... 30
2.2.2 "Investment analytics volatility report" (Kinlay et al. 2001) ... 32
2.2.3 "Rules extraction in short memory time series using genetic algorithms" (Fong and Szeto, 2001) ... 33
2.3 Volatility Forecasting with other Methods- Key Publications ... 34
2.3.1 "Nonlinear features ofrealized FX volatility" (Maheu, 1999) ... 34
2.3.2 "A Nonlinear structural model for volatility clustering", (Gaunersdorfer, 2000) ... 35
2.3.3 "Forecasting and trading currency volatility: An application of recurrent neural regression and model combination" (Dunis, 2002) ... 36
2.3.4 "An Empirical approach toward realistic modeling of capital market volatility" (Wang et al. 2005) ... 37
2.3.5 "Detection and prediction of relative clustered volatility in financial markets" (Hovsepian et al. 2005) ... 37
2.3.6 "Volatility forecasting with sparse Bayesian kemel rnodels" {Tino, et al. 2005) ... 38
2.3.7 "Boosting frarneworks in financial applications: from volatility forecasting to portfolio strategy optirnization" (Gavrishchaka1, 2005) ... 38
2.4 Surnrnary and Discussion ... 39
CHAPTER 3 PROPOSED RESEARCH METHODOLOGY ... .42
3.1 Research Objectives ... 42
3.2 Research Plan and Procedure ... .44
3.3 Data Mining of the IV Time Series ... .47
3.3 .1 Rule-based Evo1utionary Algorithm F orecasting Method ... .48
CHAPTER 4 DSO FOR IV FORECASTING ... 53
4.1 Literature Review ... 53
4.2 Discrete Stochastic Optirnization Method ... 55
4.2.1 Typical Markov Chain Approach ... 56
4.2.2 More Conternporary Approch ... 56
4.3 Proposed Methodology ... 59
4.4 Proposed Procedure to Apply DSO with GA ... 6l 4.5 Rate ofConvergence ... 63
CHAPTER 5 FORECASTING WITH CI TECHNIQUES ... 65
5.1 IV Calculation ... 66
5.2 Wavelet Transform ... 67
5.3 Wavlet Packets ... 70
5.3.1 Strategie Deployrnent ofsome Wavelet Packet Techniques ... 71
5.4 F orecasting by Gene tic Algorithrns ... 72
5.4.1 Problem Formulation ... 73
5.4.2 Proposed Methodology ... 74
5.4.4 Implementation of the GA Forecasting Process ... 76
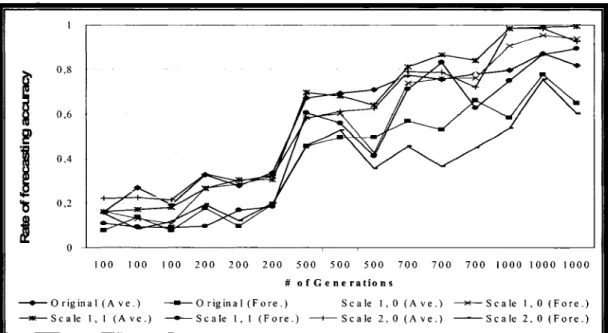
5.4.5 Testing of the Methodology and Results ... 78
5.4.6 Discussions on the Present Methodolgy ... 82
5.5 Forecasting by Genetic Programming ... 82
5.5.1 Forecast oflV fo a Financial Time Series ... 84
5.5.2 Problem Statement oflV Forecast.. ... 84
5.5.3 Data Analysis and Final Results ... 85
5.5.4 Discussions ... 88
CHAPTER 6 VALIDATION WITH THE DSO METHOD ... 90
6.1 Forecast with GARCH(l,l) method ... 90
6.2 Data Processing with S&P500 ... 92
6.3 Statistical Validation ... 94
6.4 Discussion of the Results ... 94
6.5 Application of the Results ... 97
6.5.1 Volatility- from an Option Trading Perspective ... 97
6.5.2 Potential Applications ofthe Proposed Methodology ... 98
6.5.3 Applications on a Winder Perspective ... 100
CONCLUSION ... 102
RECOMMENDATIONS ... 105
APPENDIX 1 GLOSSARY OF VOLATILITY CONCEPTS ... 110
APPENDIX 2 VOLATILITY CONCEPTS ... 115
APPENDIX 3 BASICS OF W A VELET TRANSFORM ... 126
APPENDIX 4 TIME SERIES DATA MINING ... l35 APPENDIX 5 GLOSSARY OF MARKOV CHAIN RELATED CONCEPTS ... l39 APPENDIX 6 GLOSSARY OF CONCEPTS OF GENETIC PROGRAMMING ... l42 APPENDIX 7 PUBLICATION LIST ARISING FROM THIS THESIS ... l45 BIBLIOGRAPHY ... 147
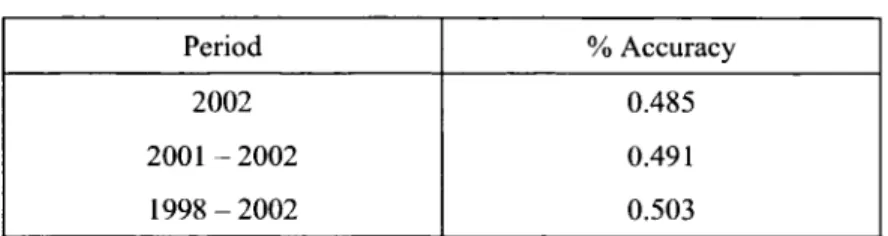
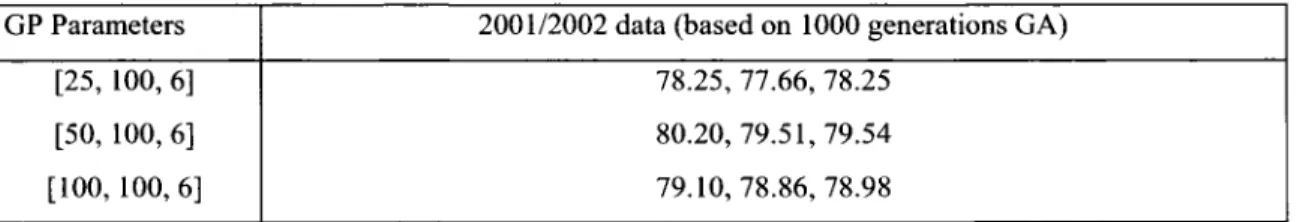
Table I Summary of the papers reviewed in details ... .40 Table II The one-day-ahead GARCh forecasting accuracy ... 81 Table III GP Configuration ... 86 Table IV Random samples of forecasting accuracy for 2003 IV data
(2002 training data set) ... 87 Table V Random samples of forecasting accuracy for 2003 IV data
(200 1 - 2002 training data sets) ... 87 Table VI The one-day-ahead GARCH forecasting accuracy
for the 2004 S&P500 daily data ... 91 Table VII Schedule of the Settlement dates for VIX Futures ... 125
Figure 1 Figure 2 Figure 3 Figure 4 Figure 5 Figure 6 Figure 7 Figure 8 Page
Proposed volatility directional forecasting system architecture ... .45
Research plan for this thesis work ... .45
Proposed volatility forecasting methodology ... 74
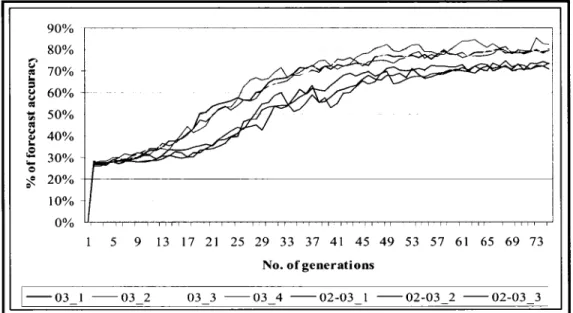
Daily 2003 S&P 100 forecasting accuracy based on 2002 S&P 100 data ... 79
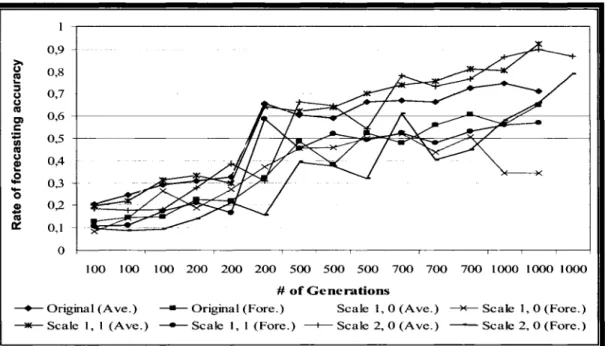
Daily 2003 S&P100 forecasting accuracy based on 2001-2 S&P100 data .... 79
Ho url y 2003 S&P 100 forecasting accuracy based on 2002 S&P 100 data .... 80
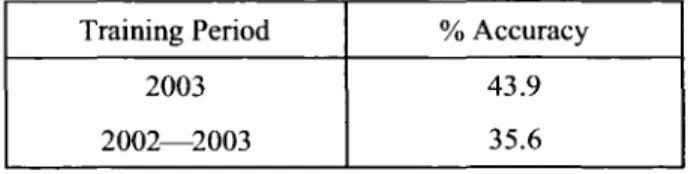
Daily 2003 S&P 100 forecasting accuracy with 2002 data as training set ... 92
Daily 2004 S&P500 forecasting accuracy trained by 2002-3 and 2002 data 93 Figure 9 Rule about volatility in the option marketplace ... 116
Figure 10 Volatility clustering ... 119
Figure 11 Continuous wavelet transform ... 127
Figure 12 Decimation process in a wavelet filter ... 128
Figure 13 Different scales of the wavelet transform ... 130
Figure 14 Different orders (levels) of the Dauberchies wavelets ... 131
Figure 15 Wavelet decomposition tree ... 133
Cj,k d d G(f) g(t) H(j) p(t)
Detailed (fine scale) coefficients ofwavelet transform
The first-order autocorrelation coefficient between the lagged squared retum and the current squared retum
Expected dividend
/h
class of the Daubechies wavelet familyThe distance between a random point( s) and a selected pattern in TSMD
Expected volatility Expected variance
IID variables representing the model approximation error or the dynamic noise
Scaling function (or farther wavelet) such that its dilates and translates constitute orthogonal bases
Scaling function (mother wavelet) such that its dilates and translates constitute orthogonal bases
Unit scale wavelet scaling low-pass filters
Transfer functions (Fourier Transforms) for the filters {g1} Event characterizing function in TSDM
Trans fer functions (Fourier Transforms) for the filters { h1}
Unit scale wavelet high- pass filters
The total number of matches between (}and the data sequence Fractions of fundamentalists and technical analysts
*
p
Pbid (ti) and
Pask (ti) 0 8 p Q r p s v x X(8) Fundamental priee
The bid and ask priees of the underlying asset at time ti.
Discrete feasible region containing at least two states, e.g. (};
One of the data point in the 4-lag recursive data set, which is converted from the IV time series
An IV data set or the 4-lag recursive data set (e.g.,
Bt,
B 1+~, B t+2, andBt+J)
V ector representing hidden patterns in a time series while conducting TSDM
Dimension of hidden patterns in a time series captured by a window while conducting TSDM
Discount rate
Rate of retum at time t
The first-order autocorrelation coefficient between lagged retums and current squared retums
An intensity factor that optimizes the past successful strategies Estimated integrated volatility
Performance measure, which is the evolutionary fitness of predictor h
in period t- 1 given by utilities of realized past profits
The square of the continuously compounded retum during day i-l
Fundamentalists' beliefthat tomorrow's priee will move in the direction of the fundamental priee p * by a factor v
The moment of the rate of retum distribution
Long term volatility, which is often a constant for a given asset The integrated volatility data set
An individual value in a time series e.g., a homogeneous sequence of logarithmic priees of S&P 100 index
Random variable indicating if a complete rule {
Bt,
B 1+J, B t+2, B tH8t+
4 } matches the data sequenceCBOE CFE CI DGP DSOM EA EMA FX GA GAB GARCH GP IV MAE MSE NIKKEI 225 S&P 100 S&P 500 TSDM
Chicago Board Options Exchange Chicago Futures Exchange
Computational Intelligence Data Generating Process
Discrete Stochastic Optimization Method Evolutionary Algorithm
Exponential Moving A verages Foreign Ex change
Genetic Algorithm
Guggenheim-Anderson-De Boer model
Generalized Autoregressive Conditional Heteroscedasity Genetic Programming
Integrated Volatility Mean Absolute Error Mean Square Error
Tokyo Stock Exchange Index with 225 selected issues Standard and Poor 100 Index
Standard and Poor 500 Index Time Series Data Mining
TSDMe2 TSE VIX VXB
Time Series Data Mining evolving temporal pattern method Toronto Stock Exchange
CBOE Market Volatility Index Futures ofVolatility Index
practical and effective methods have been well established and widely applied to solve a wide array of problems of different scales. However, sorne complicated and/or difficult problems would demand a systematic approach that synthesizes different methods and creates the synergy in order to overcome seemingly insurmountable obstacles. The subject of Financial Engineering or more specifically Applied Engineering in Derivatives is a relatively young field in both academie and scientific sense, and is full of newly emerged problems with many critically important ones. The following statement exemplifies one such typical problem:
"The benchmark mode! for option pricing is the classic Black-Merton-Scholes (BMS) mode! published in 1973. This colossal achievement was recognized when two of the three surviving founders of the mode! were awarded the Nobel Prize in Economies in 1997. Although the BMS mode! assumes volatility to be constant, its creators knew that volatility is itself volatile -- an observation underlined by the Nobel Prize awarded fast year to professor Engle for his pioneering work on mode ling volatility dynamics. " (Carr, 2004)
That is essentially the motivating force behind this research thesis to address the important problem of volatility dynamics inherent in financial systems through development of solutions. using judicious combination of engineering methodologies. Volatility is a commonly accepted measure of risk in the investment field. Volatility of an asset is used to determine the market priee for insuring against future events. It is usually defined as the standard deviation of the rate of return distributions, whereas the commonly understood mean of the rate of return distribution is the first statistical moment of the corresponding asset priee. In basic finance, risk is al ways associated with rate of return. Higher returns are usually obtained by taking higher risks.
Spot volatility is latent. One can only approximate it by short-windowed standard deviation of the retum rate. Bamdorff-Nielsen et al. (2001) and Meddahi (2002) showed that high frequency realized volatility converges to integrated volatility. lntegrated volatility (IV) is an effective measure of the daily volatility of the selected asset and is derived from the high frequency transaction priees (Andersen, 1998, 2001b). ln a strict sense, high frequency priees refer to tick-by-tick market priees, but for convenience purpose any intra day data such as minute by minute data are considered high frequency. The daily volatility is a crucial variable in evaluating option priees and in conducting different hedging strategies. lt can also be traded indirectly for its own sake by either configuring different option schemes such as spreads and straddles or traded directly through related futures con tracts. Unlike rate of retums, volatility has been confirmed to be reasonably predictable (Alexander, 2001) and therefore, is worth while for analysts to explore for prediction techniques. As defined by Anderson et al. ( 1998), IV at time t is expressed by the equation
1 n 2
cr(t)
= -
L
r (M,ti-n+ j)n J=l
(1)
where cr(t) represents the standard deviation of the time series or the volatility, ris the rate of retum, fit is the time interval of the data in which integration is done, n is the total time length of the integration, and i is the total number of data. Refer to APPENDIX 1 and 2 for further details on this IV representation. The volatility estimation and forecast are still far from successfully complete, judged by their lower than desirable accuracy. lt would be appropriate to link sorne well-established engineering analytical formulations and methods to the field of finance to help solve this critically challenging problem. ln this thesis, a general overview is provided about the data mining and forecasting of time series, which include the related concepts, available methods, potential applications and challenges that confront the contemporary researchers. The philosophy adhered in this research is to apply weil proven engineering approaches to solve difficult financial problems especially in the derivative asset analysis - a relatively young field. Such an approach happens to have a long history in a closely related field - economies. We
believe that not just one but a judicious combination of a multiple of engineering tools could be deployed to help understand, represent and eventually solve the problems in econometries and computational finance. And this is the objective of this thesis. Financial volatility is inherently a time series, thus potentially suitable for us to use different engineering methods such as those applied in a typical vibration test of sorne mechanical signais. For exemple:
a) Record the time-varying signal of g-force in the field from the corresponding accelerometers;
b) In a lab, such data are reduced to sorne manageable digital forms which become a time series for further study;
c) Analyzers equipped with different analytical tools such as FFT, Hilbert transform, orbit analysis, wavelet transform, etc. are applied to analyze the data to obtain the essential signal information for applications, and
d) By synthesizing the observed patterns, forecast could be made by comparing with the historical baseline.
Based on existing methods, the current research intends to develop and establish a systematic engineering approach to forecast effectively the volatility of selected financial indices i.e., to improve the accuracy of the forecast. The approach that is taken will revolve around evolutionary algorithms (EA) within a time series data mining framework, which is supported by a Markov chain based random search discrete stochastic optimization method. A key concept borrowed from engineering practice is to enforce a proper data transformation prior to any in depth analysis. As such, time series of equity index is first converted into IV and then into a set of wavelet coefficients. By converting the latent variance of a financial index into an effectively observable IV, we arrive at a typical time-series forecasting problem, which could be defined in an appropriate framework. Instead of going the classical econometrie route that has been put forward by many, a wavelet transform is used to pre-process the time series of IV
data and then an EA approach that comprises genetic algorithms (GA) and/or genetic programming (GP) is applied to explore the repetitive patterns inherent in the dynamic signal for forecasting purpose.
This thesis consists of three parts, Chapters 1 to 3 provide background information regarding volatility forecasting and the methodology that is formulated and adopted, followed by the general plan of deployment of the current research effort. The latter part of Chapter 3 and the body of Chapter 4 lay down the analytical foundation for the subsequent systematic evolutionary approach, whereas the last part describes the computational procedure to implement and to verify the proposed IV-wavelet-EA method including a complete analysis on market generated real data, and then the corresponding results are presented for critical discussion to enable application in practice.
More specifically, Chapter 1 de fines the challenge of the problem in a form of answering such basic questions as "what", "why", "when", "where", and "how", needed to define the precise scientific framework, whereas Chapter 2 reviews volatility related literature which tried to employ the EA techniques and/or attempted to address the inherent non-linearity problems associated with the volatility time series. Based on this review of the previous works, we try to establish the rationale to take the EA route in approaching the volatility forecasting problem. In Chapter 3 the general methodology to be developed and adopted in this research thesis is sequentially outlined. Here the four-step recursive data conversion is elucidated in the Time-Series-Data-Mining and Evolutionary-Algorithms (TSDM-EA) framework in search ofpractical means to forecast the value of a time series. Chapter 4 substantiates the GA approach by making use of a Markov chain based discrete time series optimization method. Chapter 5 describes data pre-processing procedure where the equity index data is transformed into IV time series and then wavelet coefficients by applying the wavelet packet technique. It forecasts the one-step-ahead direction and range of the transformed data sets. And it attempts to forecast the
one-step-ahead value of an IV series whereas Chapter 6 analyzes the IV series of another index for validation purpose. Results derived from this research effort are interpreted and critically discussed, and then we attempt to conclude what has been achieved during this Ph.D. investigation and recommend sorne future research directions for further study. Finally, relevant concepts and technical terms related to this research thesis are given in APPENDIX 1 through 6 to enable easy understanding of the financial and sorne engineering terms often employed in this manuscript as well as in the research solutions proposed here.
CURRENT STATE OF THE ART OF VOLATILITY FORECAST
1.1 Need to Forecast Financial Index Volatility
At the heart of financial risk modeling, the estimation and forecasting of volatility are critical for institutional investors like banks, mutual fund companies, credit unions, etc. as well as for borrowers e.g., governments, corporations and individuals. Specifically, asset managers require a reasonable volatility estimate of standard measures of the markets such as S&PlOO index, TSE30, Nikkei 225 index, etc. in order to estimate and to be able to forecast the priee of the related security as required in the prevalent model of priee development (Dupacova, 2002). Based on the forecasts, the concerned parties could hedge their investment portfolios according to the level of their risk tolerance. They could either ad just the contents of the portfolios themselves or use a combination of the corresponding put/call options - contracts that gives the holder the right to selllbuy the underlying security at a specified priee for a certain period of time. For example, with the forecasted direction and range of the volatility movement, one could buy/sell selected options to complement his/her investment strategy. If the forecast of volatility is up, the values of the relevant call and put options would go up given that other factors remain reasonably constant. The investor could decide to set up a straddle and expect the rate of return of options to go up, just like the approach associated with the rate of return of equity investment.
The hedging strategies are important for corporations in risk management to maintain their credit and borrowing power under the scrutiny and monitoring of the public and credit unions such as banks. This aspect is more important than before given the serious accounting allegations reported in recent news and the SEC tightening the regulatory controls.
When financial institutions design hedging strategies in portfolio management, they need to determine option priees, including index option, foreign exchange option, equity option, interest rate forwards, variance swaps and so on. All these investment vehicles are available in one or more financial markets in North America and in Europe, except in Asian financial markets where one may have fewer selections. Any forward looking investment vehicle that needs an estimate of risk premium will need to have a forecast of the volatility of the underlying security. To an equity option trader, volatility is a measurement of an underlying stock's priee fluctuation. lt is a critical factor in calculating an option's current theoretical value (The Option Industry Council, 2004). Volatility is the only major unknown entity in calculating priees of derivatives such as equity and index options and futures and likely to be the only unknown entity to quantify and understand in establishing a variety of trading strategies. Therefore, the accuracy of the forecast has a direct impact on the current priee of the security and eventually affects the rate of retum of the investment. It is the most vital factor in the outcome - success or failure.
Recently investors could also use the volatility itself as an investment vehicle by directly trading the variance swaps (Wang, 2005) or the Chicago Board Options Exchange (CBOE) Market Volatility Index (VIX) futures. By doing so, one could use VIX futures (VXB) to hedge equity option in the U.S. equity market. As summed up by Poon and Granger (2003), volatility forecasting is recognized as an important task in financial markets, especially in asset allocation, risk management, security valuation, pricing derivatives and monetary policy making.
At the current time, researchers are only beginning to address the fundamental questions of what "risk" or "volatility" mean in precise terms, and how best to model it -mathematically or otherwise. What we do know about volatility from the empirical research reported so far is very encouraging in this regard: volatility process is eminently more persistent and forecastable than the typical asset retum process. This indicates an
investment opportunity i.e., the potential for generating abnormal retums is more likely to be found in the relatively uncharted territory of volatility arbitrage. And volatility arbitrage is therefore, considered the most fruitful investment opportunity of the next decade, and has provided adequate means and descriptors that can be found to describe and model the underlying processes (Kinlay et al. 2001). As Kinlay (2005) recently claimed that his Caissa Capital Fund with $170 million market capitalization has achieved a compounded rate of retum 3 82.91% over the period between Oct 2002 and Jul. 2004. The fund's operation is mainly based on a non-directional market neutral strategy - making money from arbitrage opportunities rather than from directional trades. The core of the strate gy hinges on volatility forecasting - making use of genetic algorithms to construct long/short volatility portfolios. Please refer to APPENDIX 1 and B for the definition of arbitrage and other related financial terms.
Volatility is typically an unobservable random variable. It is thus not easy to estimate or predict where a pattern heads towards in the next time step; let alone what value it is going to take. Since it is the only unknown so to speak in determining option values, forecasting volatility becomes a major challenge in the financial engineering field that is rapidly evolving in many recent research undertakings.
1.2 Parametric Volatility Forecasting
Statistical methods typically use discrete time models to process the historical data of the underlying asset retums in order to calculate the variance, hence has a measure of the volatility of a time series. The contemporary research about the behavior of rate of retum of equities/indices, specifically their volatility is dominated by the parametric statistical approaches, such as a variety of Generalized Autoregressive Conditional Heteroscedastic (GARCH) models (Davidson & MacKinnon, 1993). The objectives of the se models are to ob tain the most efficient as well as the best fit of the time series, and only lately the effectiveness of these models is improving gradually. Volumes of
literature in this field have docurnented the use of a wide array of variant GARCH rnodels, such as stationary GARCH, unconstrained GARCH, non-negative GARCH, rnultivariate GARCH, exponential GARCH, Glosten, Jagannathan, and Runkle GARCH, integrated GARCH, GARCH with normal distribution, asyrnrnetric GARCH with (skewed) student-t densities, GARCH with rneasures of lagged volume etc. However, the resulting predicting power is still lagging (Harvey, Dec. 1999, Peters, 2001, Chong et al. 1999, Park, 2002, Brooks, 1998, 2003) and has not been known to be reliable in application to real practice.
JP Morgan's RiskMetrics (Neely & Weiler, 2001) system is arnong the most popular rnodels for market risk management, where weights on past squared retums decline exponentially as rnoving backwards in tirne. The RiskMetrics volatility rnodel or the exponential srnoother is written in the following form as
(2)
where cr~ is the variance of the rate of retum at tirne t, u1_1 is the rate of retum at tirne
t-1 and
IÀI
< 1 is a scaling factor. The RiskMetrics rnodel has sorne clear advantages. First, it tracks volatility changes in a way, which is broadly consistent with observed retums. Recent retums matter more for tornorrow's volatility than distant retums as À is less than one and therefore, gets srnaller wh en the lag r be cornes bigger, where r is the discrete tirne difference between the past and the current volatility. This is essentially a Markovian approach, at least in basic concept. For exarnple, when r =2, i.e. cr,_J has only 0.81 contribution to the current volatility cr, if À = O. 9. Second, the rnodel only con tainsone unknown pararneter, narnely, À. RiskMetrics actually sets À = 0.94 for every assets for dai1y volatility forecasting. In this case, no estimation is necessary, which is a huge advantage in dealing with large portfolios. However, the RiskMetrics rnodel does have certain serious shortcornings. For exarnple, it does not allow for a leverage effect, i.e. when the equity priee falls, the debt/equity ratio increases. As a result, the debt becornes more highly leveraged and the general risk level is elevated. The rnodel also provides
counterfactual longer-horizon forecasts. Please refer to APPENDIX 1 and 2 for more details.
The GARCH model helps resolve sorne of the above mentioned problems. From the analysis of empirical data, many stylized properties related to volatility are available. The most important ofthese properties is the long memory of the volatility, as measured by a lagged autocorrelation function that decays as a power law. This property is also called volatility clustering, and the slow decay of the autocorrelation means that this clustering is present at ali time horizons (Alexander, 2001 ). A simple model that describes volatility clustering is the GARCH(l,1) model described by Eq. (3). The GARCH( 1, 1) model is a GARCH model with the variance at ti me t completely defined
by the data at time t-1 :
(3)
where
cr;
andcr;_
1 are the variances at time i and i-1, is the square of thecontinuously compounded retum during day i-1; while ro, a and J3 are constants (Hall, 2000). Please refer to APPENDIX 2 for a more detailed mathematical treatment of the parametric forecasting.
1.3 Difficulties with Parametric Approach
An inconvenience shared by both RiskMetrics and GARCH models is that the multi-period distribution is unknown even if the one-day-ahead distribution is assumed to be Gaussian. Thus while it is easy to forecast longer-horizon variance in these models, it is not as easy to forecast the entire conditional distribution (Christoffersen, 2002). In practice, it is qui te desirable to forecast volatility at more than just one time horizon.
The GARCH(1,1) model has an exponential autocorrelation function for the volatility, meaning that it captures the volatility clustering only at one time horizon. In order to
remedy the shortcomings of the simplest GARCH( 1, 1) model, a large number of variations in the popular Autoregressive Conditional Heteroscedastic (ARCH) class of models have been studied, mostly using daily data (Zumbach et al., 2001). However, all ARCH/GARCH models are parametric. That is, they make specifie assumptions about the functional form of the data generation process and the distribution of error terms, which may not be amenable to be generalized. More importantly, both models lack the capability in dealing with non-linearity because of the rigid structure of the parametric modeling. Stated differently, one explanation to the poor forecasting performance of the entire GARCH model family could be that although the rate of retums are posited by sorne type of stochastic process, the volatility is formulated to be entirely deterministic in nature (Brooks, 1998), thus introducing inherent incompatibility in the basic hypothesis itself. These models all ignore the observation that the volatility of volatility is itself stochastic in character and behavior (Carr, 2004). These limitations are also present even in the more recent work by P. Christofferson, K. Jacob and Y. Wang (2004), in which better Root-Mean Square Error (RMSE) estimations were accounted for in comparison with th ose in the benchmark GARCH( 1, 1) model. Re fer to APPENDIX 2 for more details.
Partially due to these fundamental problems, a recent study (Christoffersen, 2002) found that while the risk forecasts on average tended to be overly conservative, at certain times the realized losses far exceeded the risk forecasts. More importantly, the excessive losses tended to occur mostly on consecutive days. Thus, looking back at the data on the a priori risk forecasts and the ex ante loss realization, one would have been able to forecast an excessive loss for tomorrow based on the observation of an excessive loss of today. This seriai dependence unveils a potentially serious flaw in current financial sector risk management practices, and it motivates the development and implementation of new tools such as those attempted and presented here.
1.4 Currently Best Known Results
In recent years, high frequency data have become available to the research teams and to the general public, particularly the bence derived data on the rate of retums that are based on minute-by-minute transaction priees. Volatility can be measured arbitrarily from retum series that are sampled sufficiently more frequently. For example, one could estimate daily or weekly volatility by integrating the realized volatility obtained in shorter time spans, e.g. say 15 minutes.
In modeling the volatility, emerging opinion on its theory suggests that the estimation of typical volatility in terms of IV possesses sorne specifie advantages. Under the usual diffusion assumptions, Andersen and Bollerslev ( 1998) have shown that IV computed with high frequency intra-day retums could effectively be an error-free volatility measure. Diffusion is a phenomenon that in any one direction at a unit time the net flux of molecule movement equals zero. As a result, we can treat volatility as observable in analyzing and forecasting by much simpler methods than the complex econometrie models that treat volatility as latent (Kinlay et al. 2001).
Although IV provides improved estimation accuracy, it has been shown that only about 50% of the variance in the one-day-ahead volatility factor could be accounted for. Beyond the 50%, this approach is hindered by the parametric nature of the GARCH model, which has difficulty in handling abrupt changes and discontinuities, where volatility is most significant. Therefore, the forecasting results are still far from being reliable and not useful for prediction purposes. Parametric models are easy to estimate and readily interpretable, but they possess major difficulty in dealing with non-linearity such as jumps, abrupt discontinuities, structural changes in data flow, etc. As a result, these type of approaches lack accuracy in forecast. For instance, one of their problems would be that IV measures do not distinguish between variability originating from
continuous priee movements and from jumps. As noted by Christoffersen and Diebold (2002), the dynamic impact may differ across the two sources ofvariabi1ity.
Investment ana1ysts have deve1oped proprietary research products based on undisclosed mathematical models. The best known of these products, the Volatility Report™, enables investors to identify opportunities to trade asset volatility at times of favorable market conditions, based on a proprietary volatility index that measures underlying volatility more accurately and efficiently than traditional methods. Using statistical techniques, they claim to be able to anticipate correctly the future direction of volatility an average of 72% - 75% of the time in the universe of stock and equity indices that are analyzed. They are able to identify regimes of unsustainably high or low levels of volatility with a high degree of accuracy (Kinlay 2001). More details could be found in Section 2.2.2. But the basis of these results are not known and hence the justification for this research to advance a fresh approach to the volatility problem.
Since the methodology employed in the Volatility Report™ (and other classified research projects) is proprietary, our research objective here is to achieve the same or better forecasting accuracy based on novel engineering-based techniques and thus generate methodologies for financial applications that can be made publicly available to the financial analysts, traders and the research community.
1.5 Alternative Forecasting Methods
In the domain of parametric estimation, there are many different forms of nonlinear regression models that are statistically weil behaved, i.e. different algebraic forms, such as the Oswin mode!, Smith mode!, Guggenheim-Anderson-De Boer mode! (GAB), etc. Ali these are mathematical models used for fitting data, which is of nonlinear nature (Stencle, 1999). Un1ike engineering, biochemistry or other scientific disciplines where much research has been done to establish the corresponding models for a variety of
phenomena, applications of nonlinear analysis is far from being systematic m their research efforts and has not been well-established in the financial time series analysis field. lt is therefore, necessary to observe in-depth the behavior of the volatility of different underlying securities before one could choose the appropriate model. That is why the solution for the problem at hand has to go beyond a model-based computational approach.
In the extreme case such as the far-from-linear type of nonlinear model, even if a model is selected and the respective parameters have been reasonably well-estimated, comparing different sets of data, in order to test the validity of the model will be difficult, because there usually exist following constraints and obstacles :
a) The parameter estimates may be very biased;
b) The standard errors of the parameter estima tes may be grossly underestimated.
Other, perhaps much more complex models, may giVe better representations of the underlying data generation process. If so, then procedures designed to identify these alternative models have an obvious payoff. Such procedures are described as non-parametric. Instead of specifying a particular functional form for the data generation process and making distributional assumptions ( e.g. Gaussian distribution) about the error terms, a non-parametric procedure will search for the best fit over a large set of alternative functional forms (Neely, 2001).
As observed from the relevant literature survey presented in the next chapter, there is an obvious lack of systematic approach to simplify the problem in a procedure similar to solving engineering problems such as machinery vibration analysis, which involve data acquisition, reduction, analysis, synthesis (base line comparison) and forecast. By employing the wavelet transform on the IV data, by working in the time series data mining framework to implement EA, and by substantiating the use of GA with the
discrete stochastic optimization method we will demonstrate a practical way to resolve the IV forecasting problem.
1.6 Engineering Perspective with Wavelet Transforms
In order to deal with the difficulty in forecasting volatility caused by non linearity in the underlying security transactions, sorne ingenious EA maneuvers could be employed to extract the unknown hidden patterns in the time series. However, it takes much computation time to compile the data each time. Wavelet analysis is a form of nonparametric regression analysis that decomposes a time function into a number of components, each one of which can be associated with a particular scale at a particular time (Hog, 2003). Thus it could be used to analyze time series that contain non-stationary components at many different frequencies (Daubechies, 1990). The proposed methodology uses wavelets packets to decompose the time series into a set of coefficients representing superposed spectral components ranging from low to high scales (frequencies). The wavelet coefficient of each scale can provide elues for patterns of the volatility in the corresponding time horizons. As a result, one could have a better understanding on behavioral patterns of institutional investors versus day traders i.e., long term versus short term transactions. This is particularly important because by employing the wavelet packet transform, analysts could focus on the forecasting time horizons where entropy value is the lowest or activity patterns repeat the most.
The flexibility of selecting different forecasting horizons helps analysts deal with sorne inherent constraints of IV. For example, any attempt to estimate a time-varying volatility model if there is any, for daily or hourly variations using low-frequency data such as weekly or monthly would not give very meaningful results. This is because any lower frequency data will not capture the volatility clustering that is a characteristic of most financial markets. On the other hand, it is important to be consistent with the horizon of the forecast i.e., to forecast a long-term average volatility it makes little sense to use a
high-frequency time-varying volatility model. With wavelet transform, user could easily match the estimation horizon with the forecast horizon by choosing the corresponding node on the tree instead of re-sampling from the original data set. Economy of calcula ti on time could th us be achieved and this factor is cri ti cal in many of the financial applications which require massive amounts of data to process and manipulate.
1.7 Finance Perspective with Evolutionary Algorithms
According to Chen and Wang(eds.)(2002): "Computation intelligence is a new development paradigm of intelligence systems which has resulted from a synergy between fuzzy sets, artificial neural networks, evolutionary computations, machine learning ... etc., broadening computer science, physics, engineering, mathematics, statistics, psycho/ogy, and the social sciences alike. "
Viewed from a traditional perspective, many general soft computing methods in the domain of computation intelligence such as the theory of GA, neural networks and rough sets are currently considered as a sort of exotic methods. They are applied to the evaluation. of ordinary share value expectations for a variety of financial purposes, such as portfolio selection and optimization, classification of market states, forecasting of market states and for data mining towards algorithm developments. This is in contrast to the wide spectrum of work do ne on exotic financial instruments, wherein other advanced mathematics is used to construct financial instruments for hedging risks and for investment (Tay and Cao, 2003).
In business and in most walks of life, goodness is judged as a measure only relative to its competition, while convergence to the absolute best is not necessarily an issue, because we are only concemed about doing better relative to others. The most important practical goal of optimization is just improvement in performance. Meanwhile, designers of artificial systems particularly those dealing on business systems, can only marvel at the
robustness, the efficiency and the flexibility of solutions pertaining to biological systems. Therefore, one can see why EA's are becoming ever more popular tools in attacking a wide variety of problems in the business world and the justification for our current approach.
EA's work from a rich database of points simultaneously (a population of strings), climbing many peaks in parallel; thus the probability of finding a false peak is reduced over methods that utilize point - to - point approach. By working from a population of well-adapted diversity instead of a single point, an EA adheres to the old adage that there is strength in numbers or in organized clusters; this parallel flavor contributes mainly to EA's robustness. The four main strategies - direct use of a coding, search from a population, blindness to auxiliary information, and randomized (stochastic) operators (one canuse econometrie models to guide, such as the clustering effect)- also contribute to an EA' s robustness and th us resulting in clear advantages over other more commonly used optimization techniques.
GA, a member of the EA family can optimize a broad class of functions with straightforward binary-coded or real-coded strings, by using the survival of the fittest paradigm. To perform an effective search for better and superior structures, they only require payoff values (biologists call this function the fitness function or a kind of objective function values) associated with individual strings. These characteristics make GA a more canonical method than many search schemes. After ail, every search problem has a metric (or metrics) relevant to the search; however, different search problems have vastly different forms of auxiliary information. Simplicity of operation and power of effect are two of the main attractions of the GA approach.
GA builds efficiently new solutions from the best solutions of the previous trials. lt ruthlessly exploits the wealth of information by reproducing high-quality notions according to their performance (Lawrenz, 2000) and crossing these notions with many
other high-performance notions from other strings (Bauer, 1994). Reproduction is a process in which individual strings are copied according to their objective function values. This function can be sorne measure of profit, utility, or goodness that we want to maximize. Thus the action of crossover with previous reproduction speculates on new ideas constructed from the high-performance building blocks (notions) ofpast trials. The notion here is not limited to simple linear combinations of single features or pairs of features. Biologists have long recognized that evolution must efficiently process the epitasis (position-wise non-linearity) that arises in nature. ln a similar manner, GA must effectively process notions even when they depend on their component feature in highly nonlinear and complex ways. ln other words, GA's are 1arge1y unconstrained by the limitations that hamper other methods such as continuity, derivative existence, unimodality and so on (Bauer, 1994). Finally, mutation in GA is the occasional (in other words, at a small probability) random alteration of the value of a string position. By itself, mutation is a random walk through the string space. When used sparingly with reproduction and crossover, it is an insurance policy against premature loss of important notions and to provide exploration capability to the search process. In conclusion, GA can be adopted as a suitable tool used to forecast IV even if non-linearity is to be considered.
GP, also being a member of the EA family, is a tool to search the space of possible programs for an individual case (computer algorithm) that is fit for solving a given task or problem (Koza, 1992). lt operates through a simulated evolution process on a population of solution structures that represent candidate solutions in the search space. The evolution occurs through different processes that will be described in the following sections.
A selection mechanism implements a survival of the fittest strategy by employing the genetic crossover and mutation of the selected solutions to produce offspring for the next generation. The generated programs are represented as trees, where nodes define
functions with arguments given by the values of the related sub-trees, and where leaf nodes, or terminais, represent task related constants or input variables.
The selection mechanism allows random selection of parent trees for reproduction, with a bias for the trees that represent better solutions. Selected parents are either mutated, or used to generate two new offspring by a crossover operator. Crossovers and mutations are the two basic operators used to evolve a population of trees. The mutation operator creates random changes in a tree by randomly altering certain nodes or sub-trees, whereas the crossover operator is an exchange of sub-trees between two selected parents. The evolution of trees' population continues un til a certain stopping cri teri on is reached. The initial population is composed of random trees, which are generated by randomly picking nodes from a given terminal set and function set. The only constraint is that the generated trees ought not to be too complex. A restriction on the maximum allowable depth or the maximum number of nodes is also frequently imposed for this approach.
Equipped with the EA methods, one could deal with the non-linearity in the process to search for either maxima or minima once the problem is properly formulated. Therefore, EA, incorporating both GA and GP features, becomes the key computational intelligence tool (Cl) in constructing the proposed systematic approach in order to forecast IV. Such a judicious combination of best attributes of the se powerful methods is attempted in this research thesis.
1.8 Impact of this Research
The main economical benefits resulting from the current research may be realized in four aspects: