Université de Montréal
Mécanisme(s) d'action de l'insuline dans la prévention de
l'hypertension et la progression de la tubulopathie dans le
diabète: Rôle de hnRNP F, Nrf2 et Bmf
Par Anindya Ghosh
Programme de science biomédcales Faculté de Médecine
Thèse présentée à la faculté des études supérieures
en vue de l’obtention du grade de docteur docteur en philosophie (Ph.D) en science biomédicales
Août 2018
ii
Université de Montréal
Mécanisme(s) d'action de l'insuline dans la prévention de
l'hypertension et la progression de la tubulopathie dans le
diabète: Rôle de hnRNP F, Nrf2 et Bmf
par Anindya Ghosha été évaluée par un jury composé des personnes suivantes :
Dre Jolanta Gutkowska
Présidente rapporteuse
Dr John S.D. Chan
Directeur de recherche
Dre Shao-Ling Zhang
Codirectrice de recherche
Ashok Srivastava
Membre du juryJun-Li Liu
Examinateur externeDaniel Bichet
Représentant de la doyenneiii
Résumé
Le diabète sucré est un trouble métabolique complexe qui se caractérise par une homéostasie anormale du glucose résultant en une concentration plasmatique trop élevée en glucose et due à un déficit absolu ou relatif de la production de l’insuline ou de son action. Les patients souffrant de diabète sont plus à risque de développer diverses complications comme la néphropathie diabétique (DN), qui demeure la principale cause de maladie rénale en phase terminale (ESRD) et est associée à une morbidité et mortalité cardiovasculaire accrue. Bien que les diabètes de type I et de type II (T1D et T2D) se développent par le biais de mécanismes différents, il n’existe pas de différences pathophysiologiques majeures entre la progression de la DN et ESRD pour les deux types de diabète.
La tubulopathie, qui comprend à la fois l’apoptose/atrophie tubulaire et la fibrose tubulo-interstitielle, est déjà bien acceptée comme marqueur final de la progression de la DN. Et quoique l’hyperglycémie et le stress oxydant soient tous deux associés à l’hypertension et aux lésions tubulaires, leurs mécanismes moléculaires précis d’action demeurent incertains. Pour les patients T1D, le traitement intensif à l’insuline par le biais d’injections quotidiennes demeure la thérapie la plus efficace mais est associé à de nombreux inconvénients, dont l’hypoglycémie. Le but de cette thèse est d’identifier des gènes ou molécules en aval de l’action de l’insuline comme nouvelles cibles thérapeutiques pour contrer la progression de la DN.
Dans un premier temps, nous avons examiné si l’insuline peut affecter l’expression rénale de Nrf2 dans le T1D et étudié les mécanismes sous-jacents. Le traitement avec l’insuline chez les souris Akita a permis de normaliser l’hyperglycémie, l’hypertension, le stress oxydant et les dommages rénaux; l’inhibition de l’expression rénale de Nrf2 et Agt et l’augmentation de l’expression de hnRNP F/K (ribonucléoprotéines nucléaires hétérogènes F et K) ont également été demontrées. In vitro en condition HG, l’insuline réprime la transcription de Nrf2 et Agt, mais stimule celle de hnRNP F/K via la signalisation p44/42 MAPK (p44/42 mitogen-activated protein kinase) dans les RPTCs. L’inhibition de p44/42 MAPK, hnRNP F ou hnRNP K au moyen de siRNA permet de renverser l’inhibition de la transcription de Nrf2 par l’insuline. Un élément de réponse a l’insuline (IRE) a également été identifié dans le promoteur du gène Nrf2 de rat auquel peuvent se lier hnRNP F/K. Dans des études réalisées sur des souris
iv
hyperinsulinémiques-euglycémiques, l’expression de Nrf2 et Agt était diminuée alors que celle de hnRNP F/K était augmentée, indiquant que les effets de l’insuline sur l’expression de Nrf2 et Agt le sont principalement indépendamment de son effet hypoglycémiant.
Finalement, les mécanismes sous-jacents de l’action de l’insuline sur la prévention de l’apoptose des RPTCs ont été élucidés. Nous avons créé une souris Tg surexprimant le gène Bcl2-modifying factor (Bmf) humain, spécifiquement dans les RPTCs, et caractérisé ce modèle. Les mécanismes moléculaires de l’action de l’insuline dans la prévention de l’apoptose des RPTCs induite par Bmf et la perte des RPTCs dans des souris diabétiques ont également été étudiés. Afin de démontrer l’effet de l’insuline sur l’expression de Bmf, des souris Akita traitées avec des implants d’insuline, ainsi que des souris surexprimant hnRNP F spécifiquement au niveau des RPTCs ont été utilisées. Les souris Bmf-Tg présentent une augmentation de la pression systolique (SBP), du ratio albumine-créatinine urinaire (ACR), de l’apoptose des RPTCs et un plus grand nombre de RPTCs urinaires que les souris non-Tg. Le traitement avec l’insuline et la surexpression de hnRNP F dans les souris Akita permet de supprimer l’expression de Bmf des RPTCs et leur apoptose. In vitro dans les RPTCs en culture, l’insuline inhibe l’expression du gène Bmf induite par le HG via la voie de signalisation p44/42 MAPK. La transfection de siRNA contre hnRNP F prévient l’inhibition de la transcription de Bmf par l’insuline. HnRNP F inhibe la transcription de Bmf via un élément sensible à hnRNP F localisé dans le promoteur du gène Bmf.
En résumé, ces études ont permis de démontrer que l’activation chronique de Nrf2 par l’hyperglycémie aggrave la dysfonction rénale par le biais de l’augmentation de l’expression intrarénale de l’Agt et l’activation du système rénine-angiotensine dans le diabète. Nous avons montré que l’insuline stimule l’expression de hnRNP F et hnRNP K dans les RPTCs afin d’inhiber l’expression de Agt, Nrf2 et Bmf, et ultérieurement atténue l’hypertension et les dommages rénaux chez les souris diabétiques Akita. Les travaux présentés dans cette thèse ont donc permis d’identifier hnRNP F/K, Nrf2 et Bmf comme cibles potentielles pour le traitement de l’hypertension et de la maladie rénale dans le diabète.
Mots-clés : Rein, système rénine-angiotensine, angiotensinogène, catalase, hypertension, Bmf, néphropathie diabétique, apoptose, fibrose tubulo-interstitielle, espèces réactives de l’oxygène
v
Abstract
Diabetes mellitus is a complex metabolic disorder characterized by abnormal glucose homeostasis, resulting in higher plasma glucose due to an absolute or relative deficit in insulin production or action. People with diabetes have an increased risk of developing complications including diabetic nephropathy (DN), which is the major cause of developing end stage renal disease (ESRD) and is associated with increased cardiovascular morbidity and mortality. Although, type I and type II diabetes (T1D and T2D) are developed by different mechanisms, there is no major pathophysiological difference between nephropathy progression and ESRD in both diabetes.
Tubulopathy including tubular apoptosis/atrophy and tubule-interstitial fibrosis is known to be final marker for DN progression. Hyperglycemia and oxidative stress are associated with hypertension and tubular injury; their precise molecular mechanisms remain unclear. Intensive insulin treatment for T1D patients, including daily insulin injections is the most effective therapy but is associated with drawbacks such as hypoglycemia. The aim of this thesis is to identify downstream target genes or molecules of insulin action as potential therapeutic targets to counter DN progression.
Firstly, we investigated whether insulin affects renal Nrf2 expression in T1D and studied its underlying mechanism and reported that insulin treatment normalized hyperglycemia, hypertension, oxidative stress, and renal injury; inhibited renal Nrf2 and Agt gene expression; and upregulated heterogeneous nuclear ribonucleoprotein F and K (hnRNP F/K) expression in Akita mice. In vitro, insulin suppressed Nrf2 and Agt but stimulated hnRNP F/K gene transcription in HG via p44/42 mitogen-activated protein kinase (p44/42 MAPK) signalling in RPTCs. Inhibition with siRNAs of p44/42 MAPK, hnRNP F, or hnRNP K, reversed insulin inhibition of Nrf2 gene transcription. We further identified an insulin-responsive element (IRE) in rat Nrf2 promoter that binds to hnRNP F/K. In hyperinsulinemic-euglycemic clamp studies, renal Nrf2 and Agt expression were downregulated, whereas hnRNP F/K expression was upregulated, indicating insulin-mediated effects on Nrf2 and Agt expression largely occur independently of its glucose-lowering effect.
vi
Secondly, the underlying mechanism of insulin action on preventing RPTC apoptosis was studied. In the present study, a Tg mouse overexpressing human Bcl2-modifying factor (Bmf) in RPTs was created and characterized. Furthermore, the molecular mechanism(s) of insulin action on preventing Bmf-induced RPTC apoptosis and loss in diabetic mice were investigated. To study the effect of insulin on Bmf expression, Akita mice implanted with insulin, specifically those overexpressing hnRNP F in their RPTCs, were used. Bmf-Tg mice exhibited higher systolic blood pressure (SBP), urinary albumin-creatinine ratio (ACR), RPTC apoptosis and more urinary RPTCs than non-Tg mice. Insulin treatment and hnRNP F-overexpression in Akita mice suppressed RPTC Bmf expression and apoptosis. In vitro, insulin inhibited HG-induced Bmf gene expression in RPTCs via p44/42 MAPK signaling. Transfection of hnRNP F siRNA prevented insulin inhibition of Bmf transcription. HnRNP F inhibited Bmf transcription via hnRNP F-responsive element in the Bmf promoter.
In summary, this thesis demonstrated that chronic Nrf2 activation by hyperglycemia aggravates renal dysfunction via enhanced intrarenal Agt expression and RAS activation in diabetes. It was demonstrated that insulin inhibits Agt, Nrf2, and Bmf expression in RPTCs via hnRNP F and hnRNP K expression and, subsequently, attenuates hypertension and kidney injury in Akita mice. This study identifies renal hnRNP F/K, Nrf2 and Bmf as potential targets for the treatment of hypertension and kidney injury in diabetes.
Keywords: Kidney, renin-angiotensin system, angiotensinogen, catalase, hypertension, diabetic nephropathy, Bmf, apoptosis, tubulointerstitial fibrosis, reactive oxygen species.
vii
Table of Contents
Résumé ... iii
Abstract ... v
Table of Contents ... vii
List of Tables ... xii
List of Figures ... xiii
List of Abbreviations ... xvi
Acknowledgements ... xx
Chapter 1: Introduction ... 1
1.1 Diabetes Mellitus ... 2
1.1.1 A Brief History of Diabetes Mellitus: From Ants to Analogues ... 2
1.1.2 Types of Diabetes Mellitus ... 3
1.1.2.1 Type 1 Diabetes Mellitus (T1D) ... 3
1.1.2.2 Type 2 Diabetes Mellitus (T2D) ... 3
1.1.2.3 Gestational Diabetes Mellitus (GDM) ... 4
1.1.3 Prevalence of diabetes. ... 4
1.1.4 Pathogenesis of Diabetes ... 5
1.2 Role of Kidney and Homeostasis ... 7
1.2.1 Renal Physiology ... 7
1.2.2 Renal Histology ... 7
1.2.2.1 The Nephron ... 7
1.2.2.2 The Glomerulus ... 9
1.2.2.2 Glomerular Filtration Barrier ... 9
1.2.2.3 Podocytes ... 11 1.2.2.4 Proximal Tubules ... 12 1.2.2.6 Loop of Henle ... 14 1.2.2.6 Distal Tubules ... 15 1.2.2.5 Juxtaglomerular Apparatus ... 15 1.2.2.6 Tubuloglomerular Feedback ... 15
viii
1.3 Chronic Kidney Disease (CKD) ... 18
1.3.1 Prevalence of Chronic Kidney Disease ... 19
1.3.2. Laboratory Measurements for CKD ... 19
1.4 Diabetic Nephropathy ... 20
1.4.1 The Pathogenesis and Progression of DN ... 20
1.4.2 Pathomechanisms of DN ... 22
1.4.2.1 Hyperglycemia and DN ... 23
1.4.2.2 Glycosylation and DN ... 24
1.4.2.3 Protein Kinase C and DN ... 26
1.4.2.4 Aldose Reductase Pathway and DN ... 27
1.4.2.5 Hypertension and DN ... 28
1.4.2.6 TGF-β and DN ... 30
1.5 ROS and Oxidative Stress ... 32
1.5.1 ROS Generation and ROS Sources in the Kidney ... 33
1.5.1.1 Mitochondrial ROS and DN ... 33
1.5.1.2 NADPH Oxidases and DN: ... 36
1.5.2 Antioxidants ... 40
1.5.2.1 Dietary antioxidant supplement: ... 40
1.5.2.2 Superoxide dismutase ... 40
1.5.2.3 Catalase ... 41
1.5.3 Nrf2-Keap1 system ... 42
1.5.3.1 Structure and Function of Nrf2 ... 42
1.5.3.2 Regulation of Nrf2 ... 43
1.5.3.3 Nrf2 activator Oltipraz ... 45
1.5.4.5 Nrf2 inhibitor Trigonelline ... 46
1.6 Renin-Angiotensin System (RAS) ... 47
1.6.1 Classical RAS ... 47
1.6.2 Local RAS ... 48
1.6.2.1 Intrarenal RAS ... 48
1.6.3 Components of intrarenal RAS ... 49
ix 1.6.3.2 Angiotensinogen (Agt) ... 49 1.6.3.3 Angiotensin II (AngII) ... 50 1.6.3.4 ACE ... 51 1.6.3.5 ACE2 ... 51 1.6.3.6 Angiotensin Receptors ... 52
1.6.4 Clinical trials with RAS blockers ... 54
1.7 Apoptosis ... 56
1.7.1 Mechanism involved in apoptotic cell death ... 56
1.7.1.1 Extrinsic apoptosis ... 56
1.7.1.2 Intrinsic apoptosis ... 58
1.7.2 Regulation of Apoptosis by Bcl-2 Family Proteins: The Sentinels of Life and Death ... 58
1.7.2.1 The BH3-only protein Bmf ... 61
1.8 The Heterogenous Ribonucleoproteins ... 64
1.8.1 hnRNP K ... 66
1.8.2 hnRNP F ... 66
1.9 Insulin Signaling in the Kidney ... 68
1.9.1 Insulin Receptors ... 68
1.9.2 Insulin Signaling Pathways ... 69
1.10 Animal model of Diabetic Nephropathy ... 72
1.10.1 Mouse Model of Type 1 Diabetes ... 72
1.10.1.1 Streptozotocin (STZ)-Induced Diabetes ... 72
1.10.1.2 Akita Ins2+/C96Y mutant mice ... 73
1.10.2 Mouse models of type 2 diabetes ... 73
1.10.2.1 db/db mouse model ... 73
1.10.2.2 High fat diet model ... 73
1.11 Objective and hypothesis of the present study ... 75
Chapter 2: Article 1 ... 78
Abstract ... 80
Introduction ... 81
x Results ... 87 Discussion ... 92 Acknowledgements ... 96 Disclosure ... 97 Abbreviations ... 98 Figure Legends ... 99 Chapter 3: Article 2 ... 119 Abstract ... 121 Introduction ... 122 Results ... 124 Discussion ... 130
Materials and Methods ... 134
Acknowledgements ... 140
Figure Legends ... 142
Chapter 4: Discussion ... 159
4.1 Genetically Modified Akita Mice Model (T1D) ... 161
4.2 Antioxidant Therapies for DKD ... 163
4.3 Effect of Catalase Overexpression in Diabetic Mice. ... 163
4.4 Nrf2 Activation: The Double-Edged Sword ... 165
4.5 Akita Mice Treated with Insulin ... 170
4.6 Insulin Signaling and Nrf2 ... 172
4.7 Promoter Studies and IREs ... 173
4.8 Insulin on Gene Expression is Independent of Glucose Lowering Effect ... 175
4.8.1 Hyperinsulinemic Euglycemic Clamp ... 175
4.8.2 Studies with SGLT2 inhibitor ... 175
4.9 Potential Activator of hnRNP F/K: Hordenine ... 176
4.10 Transgenic mice overexpressing hBMF in the RPTC ... 177
4.11 Effect of Bmf Overexpression in RPTC ... 178
4.12 Regulation of Bmf by Insulin ... 180
4.13 Regulation of Bmf by Nrf2 ... 182
xi
4.14.1 Limitations of Akita mice model ... 183
4.14.2 hnRNP F/K Knockout Mice ... 183
4.14.3 Role of Other BH3-only Proteins in Diabetic Kidneys ... 184
4.15 Conclusion ... 184
Chapter 5: Unpublished Results and Research Perspectives ... 186
5.1 Generation of Nrf2 transgenic mice ... 187
5.2 Bmf Promoter analysis ... 189
5.3 Role of Nrf2 in the regulation of Bmf ... 191
5.4 Adminstration of SGLT2 Inhibitor Canagliflozin in Akita mice ... 192
5.5 Future Experiments ... 195
5.5.1 Generation of Nrf2KO: KAP2-rNrf2-Tg Mice ... 195
5.5.2 Generation of Akita-Erk1-/-:Pax8-Cre-Erk2-/- Mice ... 196
Chapter 6: References ... 198
xii
List of Tables
Table 1-1: Substances secreted or reabsorbed in the nephron and their locations……….17
Table 1-2: Prognosis of CKD by GFR and albuminuria category. ... 18
Table 1-3: Pathological classification of diabetic nephropathy ... 22
Table 1-4: Action of angiotensin receptors in kidney and vasculature. ... 54
Table 1-5: Summary of major trials with RAS blockers. ... 55
Table 1- 6: Animal models of DN… ... 74
Table 2-1: Article 2: Table 1-Primer sequences…………...….………...………….103
Table 2-2: Article 2: Table 2-Antibodies..………...……….104
Table 2-3: Article 2: Table 3-Physiological Measurements………..105
Table 2-4: Article 2: Supplementary Table 1………....116
Table 3-1: Article 3: Table 1-Physiological Measurements………..………147
Table 3-2: Article 3: Supplementary Table 1………...…….157
Table 3-3: Article 3: Supplementary Table 2……….…………..158
xiii
List of Figures
Figure 1-1: Estimated diabetes-related deaths and healthcare expenditure in 2017 . ... 6
Figure 1-2: Estimated number of people with diabetes worldwide ... 6
Figure 1-3: Diagram of kidney, juxtaglomerular nephron and superficial nephron. ... 8
Figure 1-4: Anatomy of glomerulus.. ... 8
Figure 1-5: Transmission electron micrograph of the glomerular capillary cell wall. ... 10
Figure 1-6: Podocyte foot process effacement. ... 11
Figure 1- 7: Schematic location and ultrastructure of proximal tubular S1–S3 segments. ... 13
Figure 1-8: Proximal tubule markers of different segments.. ... 14
Figure 1-9: Proposed mechanism of tubuloglomerular feedback (TGF). ... 16
Figure 1-10: Pathological lesions of DKD. ... 21
Figure 1-11: Pathophysiology and progression of DN ... 21
Figure 1-12: Consequences of AGEs formation in the diabetic kidney. ... 25
Figure 1-13: Physiological effects and cellular mechanisms of DAG–PKC activation induced by hyperglycemia ... 27
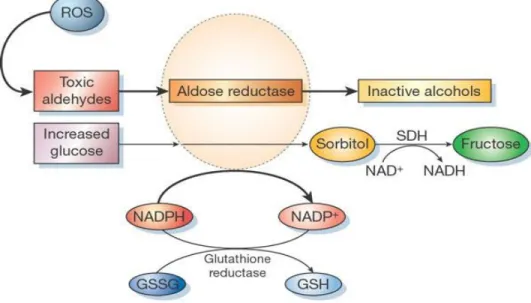
Figure 1-14: Polyol pathway and aldose reductase.. ... 28
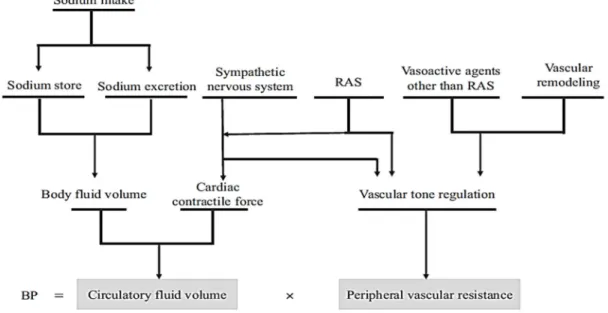
Figure 1-15: Pathophysiology of hypertension . ... 29
Figure 1-16: Overview of oxidative stress mediators involved in the pathogenesis of DKD...32
Figure 1-17: Various intracellular sources of ROS. ... 33
Figure 1-18: Factors associated with mitochondrial dysfunction and ROS generation in DN 34 Figure 1-19: Classical components of NOX ... 37
Figure 1-20: Function of Nox4 in different renal cells. ... 38
Figure 1-21: Domain structures of Nrf2 and repressor Keap1... 42
Figure 1- 22: Regulation of Nrf2 by different pathways. ... 44
Figure 1-23: Components of RAS. ... 47
Figure 1- 24: Pathways of cellular apoptosis ... 57
Figure 1- 25: Domain organization of various Bcl2 family members. ... 59
Figure 1-26: The two alternative models for Bax/Bak activation. ... 61
Figure 1-27: Function and regulation of Bmf. ... 62
xiv
Figure 1- 29: Domain structure of the hnRNP family members. ... 65
Figure 1-30: Insulin signaling pathways. ... 71
Figure 1-31 Proposed hypothesis for the current study………..77
Figure 2-1: Article 2: Figure 1……….……… 106
Figure 2-2: Article 2: Figure 2………..…………107
Figure 2-3: Article 2: Figure 3……….… 108
Figure 2-4: Article 2: Figure 4……….……….109
Figure 2-5: Article 2: Figure 5………..………110
Figure 2-6: Article 2: Figure 6………..………111
Figure 2-7: Article 2: Figure 7………..………112
Figure 2-8: Article 2: Supplementary Figure 1……….113
Figure 2-9: Article 2: Supplementary Figure 2……….114
Figure 2-10: Article 2: Supplementary Figure 3………..…….115
Figure 2-11: Article 2: Supplementary Figure 4………..……….116
Figure 2-12: Article 2: Supplementary Figure 5……….. ………….117
Figure 2-13: Article 2: Supplementary Figure 6……….………..118
Figure 3-1: Article 3: Figure 1………..………148
Figure 3-2: Article 3: Figure 2………..………149
Figure 3-3: Article 3: Figure 3……….……….150
Figure 3-4: Article 3: Figure 4………..………..………..151
Figure 3-5: Article 3: Figure 5……….……….152
Figure 3-6: Article 3: Figure 6……….……….153
Figure 3-7: Article 3: Figure 7……….……….154
Figure 3-8: Article 3: Figure 8……….……….155
Figure 3-9: Article 3: Supplementary Figure 1...……….……….156
Figure 4-1: Proposed Model……….185
Figure 5-1: Generation of KAP2-rNRF2-Tg mice………187
Figure 5-2: Gene expression pattern in rNRF2-Tg mice………...188
Figure 5-3: Bmf promoter analysis…….……….….…189
Figure 5-4: Rat Bmf promoter analysis……….……190
xv
Figure 5-6: Physiological Measurements……….192
Figure 5-7: Nrf2 and Agt expression ………193
Figure 5-8: Caspase 3 and Bmf expression………...194
Figure 5-9: Diagram to generate Nrf2KO:KAP2-rNrf2-Tg mice……… 195
Figure 5-10: Diagram to generate Akita-Erk1-/-:Pax8-Cre-Erk2-/- Mice………..196
xvi
List of Abbreviations
ACE Angiotensin converting enzymes.ACE2 Angiotensin-converting enzyme-2 ACEi ACE inhibitors.
ACR Albumin/creatinine ratio
AGEs Advanced glycosylation end products. Agt Angiotensinogen
Ang I Angiotensin I Ang II Angiotensin II Ang IV Angiotensin IV Ang1–7 Angiotensin 1-7 APS Pleckstrin homology. AR Aldose reductase.
ARBs Angiotensin receptor blockers. ARE Antioxidant response element. AT1R Angiotensin II type 1 receptor. AT2R Angiotensin II type 2 receptor. Bmf Bcl2-modifying factor
Cat Catalase
CKD Chronic kidney disease CNC Cap ‘n’ collar
CTGF Connective tissue growth factor Cul3 Cullin 3
DAG Diacylglycerol. DM Diabetes mellitus. DN Diabetic nephropathy ECM Extracellular matrix.
eGFR Estimated glomerular filtration rate eIF4E Eukaryotic translation initiation factor 4E EMSA Electrophorretic mobility shift assay ER Endoplasmic reticulum
ERK Extracellular-signal-regulated kinases ESRD End stage of renal disease
GBM Glomerular basement membrane GDM Gestational diabetes Mellitus GFR Glomerular filtration rate
Grb2 Growth factor receptor binder-2. GSH Glutathione
GSHPx Glutathion Peroxidase. gsk3 Glycogen synthase kinase-3. GTFs General transcription factors. H&E Hematoxylin and eosin H2O2 Hydrogen peroxide. HG High glucose
xvii
hnRNPK Heterogenous nuclear ribonucleoprotein K hnRNPs Heterogenous nuclear ribonucleoproteins HO-1 Hemoxygenase-1
hrACE2 Human recombinant ACE2 IDF Diabetes federation.
IGF-1 Insulin-like growth factor 1 IL-6 Interleukin-6
IR Insulin receptor
IRE Insulin-responsive element IRR Insulin receptor-related IRSs Insulin receptor substrates JGA Juxtaglomerular apparatus
KDOQI Kidney disease outcomes quality initiative Keap1 Kelch-like ECH-associated protein 1 MAPK Mitogen-activated protein kinase. Mapkk Map kinase kinase.
Mapkkk Map kinase kinase kinase. MAS Mas oncogene receptor MAU Microalbuminuria
NF-κB Nuclear transcription factor κappa B. NKF National kidney foundation
NO Nitric oxide.
NOD The non-obese diabetic. NOS Nitric oxide synthase NQO1 Quinone oxidoreductase 1. Nrf1 Nuclear respiratory factor 1 Nrf2 Erythroid 2-related factor 2 PAS Periodic acid schiff
PDK1 Phosphoinositide-dependant Kinase1. PI3K Phosphoatidylinositol 3-kinase. PKC Protein kinase C.
RAGE Receptor of advanced glycosylation end products RAS Renin-Angiotensin System
RBPs RNA-binding proteins RE Response Element rMLC-2 Rat myosin light chain-2. RNA Pol II RNA polymerase II ROS Reactive oxygen species RPTCs Renal proximal tubular cells SBP Systolic blood pressure SDH Sorbitol dehydrogenase. SH2 Src homology2.
siRNA Small interfering RNA SOD Superoxide dismutases. ssDNA Single strand DNA STZ Streptozotocin
xviii T1D Type 1 diabetes mellitus
T2D Type 2 diabetes mellitus. TBM Tubular basement membrane. TBP TATA-binding protein TF Transcription factors
TFBSs Transcription factors binding sites TGF-β Transforming growth factor. TNF-α Tumor necrosis factor- α TSS Transcriptional start site. UTR Untranslated region. Vitamin C Ascorbic acid
xix
But Mousie, thou art no thy-lane,
In proving foresight may be vain:
The best laid schemes o’ Mice an’ Men
Gang aft agley,
An’ lea’e us nought but grief an’ pain,
For promis’d joy!
xx
Acknowledgements
Foremost, I would like to express my sincere gratitude to my advisor Dr. Chan for the continuous support of my Ph.D. study and research, for his patience, motivation, enthusiasm and immense knowledge. His guidance helped me in all my time of research and writing of this thesis. I could not have imagined a better mentor for my study. Besides my advisor, I would like to thank my co-director Dr. Shao-Ling Zhang for her insightful encouragements and valueable guidance.
In addition, I would like to thank the rest of the thesis committee: Dr. Jolanta Gutkowska, Dr. Ashok Srivastava, Dr. Jun-Li Liu, and Dr. Daniel Bichet, for serving as my committee members and for their encouragement, insightful comments and hard questions.
A very special gratitude goes to Ms. Isabelle Chénier, whose help and advice are impossible to overestimate. Her helpful attitude, organizational skills, continuous support to all lab members and her bright ideas make our lab effective and efficient.
My sincere thanks go to Dr. Chao-Sheng Lo and Ms. Shuiling Zhao, who helped me everyday immensely with their valueable suggestions and technical expertise. I would like to thank all the lab members of our laboratory, Henry Nchienzia, Min-Chun Liao, Dr. Shiao-Ying Chang, Xinping Zhao, Dr. Shaaban Abdo, Dr. Yixuan Shi, Abouzar Otoukesh and Yessoufou Aliou, for their patience and valueable suggestions. Working with them and learning from them was a real pleasure and a valueable experience.
With all my gratitude I would like to thank my fellow mates in the CRCHUM, specially Ju Jing Tan, Henry Leung, Laura Sognigbé, Paul Tan, Estelle Simo, Ashish Jain for all of your support and encouragements.
Finally, I would like to thank my Maa and my brothers Liton and Rony. I thank you with all of my heart for your love and support.
2
1.1 Diabetes Mellitus
1.1.1 A Brief History of Diabetes Mellitus: From Ants to Analogues
The earliest description of diabetes was found in ‘Ebers Papyrus’ which was written around 1550 BC and describes various remedies to treat “too great emptying of urine” which probably refers to a polyuric state (1). Around the same time, ancient Hindu writings described people with ‘a mysterious and deadly disease that caused intense thirst, enormous urine output and wasting away of the body’. Hindu healers observed that flies and ants were attracted to the urine of the victims which can be described as the first clinical test of diabetes. They termed the condition ‘madhumeha’ or honey urine (2). Apollonius of Memphis probably used the Greek term ‘diabetes’ for the first time around 230 BC, which means ‘to go through’ or siphon as the disease drained patients of more fluids than they could consume. Gradually, the latin term for honey ‘mellitus’ was attributed to diabetes due to its link with sweet urine. In the fifth century AD, the Hindu physicians Charaka and Sushruta, were probably the first to differentiate between two types of diabetes mellitus by observing thin individuals who develop diabetes at a younger age in contrast to heavier individuals who develop the disease later and can live longer after diagnosis. (1, 3).
It was only in 1815 that Eugene Chevreul of Paris proved that the sugar present in the urine of diabetic patient was glucose (1, 4). Claude Bernard, a professor of physiology at Sorbonne University, discovered liver glycolysis and linked glycogen metabolism with diabetes and hypothesized that excess sugar secretion from liver glycogen into the blood leads to diabetes (5). In 1869, Paul Langerhans, a German medical student found islet cells in the pancreas and in 1893, French scientist Gustave–Edouard Laguesse suggested that islets of Langerhans might secrete the substrate that controls glucose. Later in 1909, Belgian physician Jean de Mayer named the presumed substance produced by the islets of Langerhans as “insulin” (1, 6, 7).
In 1921, the key breakthrough came from the findings of Frederick Grant Banting when he started working with John James Rickard Macleod, Charles Best and James Collip at the University of Toronto. On January 11, 1922, after successful experiments on animals with pancreatic extract, they injected Leonard Thompson, a 14-year-old patient, weighted 64 lb, with their extract. Although early results were very disappointing, a few weeks later, a second
3
injection with Collip’s refined “isletin” showed astonishing results. Leonard’s blood glucose fell from 520 to 120 mg/dl within 24h and urinary ketones disappeared. He gained weight and lived a relatively healthy life for 13 years but died of pneumonia at the age of 27. In 1923, their work was awarded by Nobel prize for the discovery of insulin (8). In 1978, with the emergence of recombinant DNA technology, production of the first recombinant insulin was announced and in July 1996, the FDA approved the first recombinant DNA human insulin analogue, lispro (Humalog). Today, more than 300 insulin analogues are available including about 70 from animal species, 80 chemically modified insulins and 150 biosynthetic insulins (2, 9).
1.1.2 Types of Diabetes Mellitus
Diabetes mellitus, or diabetes is a chronic condition that occurs when the blood glucose level or glycemia increases because the body cannot produce any or enough insulin or use insulin effectively. There are mainly three types of diabetes, type 1 diabetes, type 2 diabetes and gestational diabetes (10).
1.1.2.1 Type 1 Diabetes Mellitus (T1D)
T1D is caused by an autoimmune disease where antigen-specific T cells selectively destroy insulin producing pancreatic β-cells. As a result, no or very little insulin is produced by the body, leading to hyperglycemia. Although 5%-10% of people with diabetes have T1D, it remains a serious, life-threatening disease. It develops more frequently in children and adolescents and is considered the third most common disorder during childhood. The cause of T1D is not fully understood but multiple environmental and genetic risk factors (eg. HLA haplotypes) have been implicated (11). People with T1D need daily insulin injection to survive. 1.1.2.2 Type 2 Diabetes Mellitus (T2D)
T2D, also known as non-insulin dependent diabetes, is characterized by chronic insulin resistance and a progressive decline in pancreatic β-cell function leading to hyperglycemia. This whole process contributes to develop insulin resistance in liver, muscle and adipose tissue. To compensate for insulin resistance, β-cells start producing more insulin which might exceed maximum capacity resulting in β-cell failure (12). T2D accounts for 90% of all cases of diabetes. It is mostly seen in older people, but it is now seen increasingly in children, adolescents and
4
younger adults due to the rising prevalence of obesity, physical inactivity and poor diet. The cause of T2D is not completely understood but overweight and obesity, old age as well as genetics or family history have been linked with it (13).
1.1.2.3 Gestational Diabetes Mellitus (GDM)
One of the most common complications in pregnancy is GDM, which affects 14% of pregnancies worldwide. Mild hyperglycemia that is first detected during pregnancy is classified as GDM. Women with considerably higher blood glucose during pregnancy are classified as women with hyperglycemia in pregnancy. GDM usually exists as a transient disorder affecting pregnant women typically around the 2nd and 3rd trimesters of their pregnancy and resolves after
delivery. However, pregnant women with hyperglycemia have at least a seven-fold higher risk of developing GDM in subsequent pregnancies and half of them later develop T2D. Offspring born to mothers with GDM develop increased lifelong risks of developing obesity, T2D and metabolic syndrome (13-16).
1.1.3 Prevalence of diabetes.
Today, even with the most advanced pharmaceutical interventions and preventive health care system, the epidemic of diabetes is on the rise across the globe and the cure continues to elude us. Improved diagnosis, the rapid population growth, aging, urbanization, increased prevalence of obesity and physical inactivity are some of the main reasons for today’s diabetes epidemic. Current and future quantification of the prevalence of diabetes and affected people will allow rational planning and allocation of resources (17).
According to the International Diabetes federation (IDF) statistics, in 2017, 424.9 million people worldwide, or 8.8% of adults 20-79 years, were estimated to have diabetes. The number would increase to 451 million if the age group was extended to 18-99 years. The IDF anticipates this number will rise to 629 million of people by 2045. This could mean that one in every10 people will have the disease by 2045 (13). As a result, individuals with diabetes will be at higher risk for several complications such as myocardial infarction, stroke, blindness, lower limb amputation, and end stage renal disease (kidney failure, ESDR). According to IDF, 4 million adults (20-79 years) died due to diabetic complications worldwide in 2017. In 2017, North
5
America alone spent almost 52% (383 billion) of the total amount spent globally on diabetes. Figure1-1 summarizes worldwide diabetes related death and expenditure (13).
The good news is that we have learned a lot in past decades about preventive care for diabetes. Around 25 years ago, the Diabetes Control and Complications Trial (DCCT) showed that intensive glycemic control could reduce the risk of diabetes complications including diabetic nephropathy (18). Although the prevalence of obesity, a major cause of T2D, remains high, it has nonetheless remained stable between 2003-04 and 2009-10 in the United States (US) due to the focus given to public healthcare efforts on obesity (19). In the US, the rate of diabetic complications has declined during the past two decades (1990-2010) including cardiovascular events, but not ESRD. In fact, ESRD increased among older patients. A huge burden of disease still persists in the US because of the overall continued increase in the prevalence of diabetes (20). However, the largest increase will take place in developing countries with poor economy. According to the IDF estimates, by 2045, people with diabetes in South and Central America will increase by 61%, South East Asia by 81%, Middle East and North Africa by 110% and Africa by 156% (figure 1-2) (13). Asia became the “diabetes epicenter” of the world, characterized by a rapid increase in prevalence over a short period and onset at a relatively young age due to the presence of a metabolic obese phenotype (21). These alarming estimates indicate the need for urgent improvements in the performance of the health care system for people with diabetes in poorer economic countries.
1.1.4 Pathogenesis of Diabetes
Diabetes is a group of diverse and complex diseases characterized by chronic hyperglycemia. Without proper glycemic control, all types of diabetes can lead to complication in different parts of body, resulting in hospitalization and mortality. Usually, the injurious effects of hyperglycemia can be separated into microvascular and macrovascular disease (22). The microvascular complications are due to damage to small blood vessels and include diabetic retinopathy, nephropathy and neuropathy, whereas macrovascular complications affect larger blood vessels and cause cardiovascular diseases (CVD) including coronary artery disease (CAD) leading to myocardial infraction, peripheral artery disease contributing to stroke, diabetic encephalopathy and diabetic foot (13). In addition, diabetes had also been associated with other disease such as cancer (23), physical disability (24) and depression (25).
6
Figure 1-1: Estimated diabetes-related deaths and healthcare expenditure in adults (20-79 years) worldwide in 2017 (13).
Figure 1-2: Estimated number of people with diabetes worldwide and per region in 2017 and 2045 (20–79 years) (13)
7
1.2 Role of Kidney and Homeostasis
1.2.1 Renal Physiology
The kidneys play a vital role in maintaining the homeostasis of extracellular fluid. They serve three main functions. Firstly, they act as a filter and remove metabolic wastes (including urea, uric acid and creatinine) and toxins from the circulating blood and excrete them through urine. Secondly, they maintain the volume and composition of the extracellular fluid with in normal range by regulating water and electrolyte balances, osmotic balance, acid base balance and by actively reabsorbing essential molecules such as amino acids, ions, glucose and water. Thirdly, they produce or activate hormones such as erythropoietin, 1-25- dihydroxy-vitamin D3, renin, angiotensin II, which are involved in erythrogenesis, Ca++ metabolism and the regulation
of blood pressure and blood flow (26, 27).
1.2.2 Renal Histology
The kidney consists of three major parts – (a) Renal cortex, the outermost region of the kidney which lies immediately below the tough connective tissue capsule. (b) Renal medulla, situated below the cortex, comprises the inner part of the kidney. The cortex and medulla are mainly composed of nephrons, blood vessels, nerves and lymphatics. The medulla is divided into renal pyramids which are triangular structure containing densely packed nephrons. (c) Renal pelvis, it connects the kidney to the circulatory and nervous systems with rest of the body (28). Different parts of the kidney and nephron are shown in the figure 1-3.
1.2.2.1 The Nephron
The nephron is the main functional unit of the kidney. There are almost 1,200,000 nephrons in the human kidney (figure 1-3). They are responsible for producing urine by removing waste and excess substances from the blood. The nephron consists of a renal corpuscle, proximal tubule, loop of Henle and collecting duct system. The renal corpuscle also known as glomerulus, consists of glomerular capillaries and Bowman’s capsule. Based upon the
8
Figure 1-3: Diagram of a kidney, juxtaglomerular nephron and superficial nephron (28, 29). A. B.
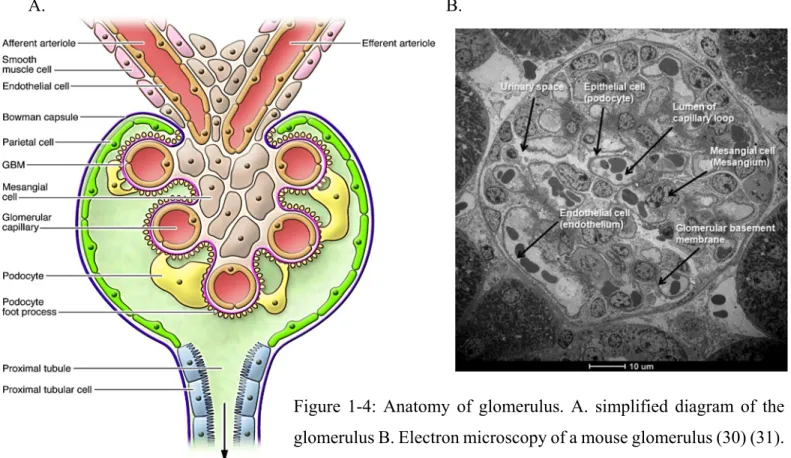
Figure 1-4: Anatomy of glomerulus. A. simplified diagram of the glomerulus B. Electron microscopy of a mouse glomerulus (30) (31).
9
location of the glomerulus, nephrons can be further divided in two types –. superficial or cortical nephron and juxtamedullary nephron (28). As shown in figure 1-3, glomeruli of superficial nephrons are located nearer to the outer parts of the cortex and their loops of Henle are short, whereas, juxtamedullary nephrons have a glomerulus near the junction of the cortex and medulla, with their loops of Henle penetrating deep into the medulla. In humans, about 85% of nephrons are superficial nephrons and only about 15% are juxtamedullary nephrons (32). 1.2.2.2 The Glomerulus
The glomerulus (or more precisely glomerular tuft) is a network of capillaries that receives its blood supply from an afferent arteriole of renal circulation that drains into the efferent arteriole. The glomerulus is surrounded by Bowman’s capsule (BC), which transforms into the epithelium of proximal tubules at the urinary pole, while Bowman’s space opens into the tubular lumen. The glomerular capillaries network is held together by the mesangium and covered by the glomerular basement membrane (GBM) (28).
Mesangial cells are specialized smooth muscle-like cells, which can contract and regulate blood flow to the glomerulus (31). The outer aspect of the GBM is surrounded by a layer of epithelial cells called podocytes (figure 1-4 and 1-5). The process of urine formation starts with the blood filtered through the glomerular capillaries into Bowman’s capsule by passive movement. The plasma ultrafiltrate collected in the Bowman’s capsule then flows into the proximal tubule, where smaller molecules, such as water, glucose and other minerals, ions get reabsorbed (28).
1.2.2.2 Glomerular Filtration Barrier
The glomerular filtration barrier (GFB) is a highly sophisticated blood filtration interface that allows the passage of small and midsize molecules, but it is impermeable to macromolecules, such as red blood cells and plasma albumin. The glomerular filter consists of three layers – glomerular endothelial cells, glomerular basement membrane and epithelial podocytes (figure 1-5). All three layers contribute greatly in the glomerular filtration barrier and damage to any layer might results in leakage of macromolecules passing through the GFB and ending up in the urine (33, 34).
10
Figure 1-5: Transmission electron micrograph of the glomerular capillary cell wall. GEnCs, glomerular endothelial cells whose fenestrations are denoted by ∆, the GBM, and podocytes, whose tertiary foot processes are denoted by FP. Examples of a slit diaphragm between the foot processes are indicated by thick arrows (31).
Proteinuria and microalbuminuria are widely used as clinical urinary biomarkers of diabetic nephropathy. Some other biomarkers that can predict which component of GBM is affected are given below:
a. Podocyte level: - nephrin and podocalyxin b. GBM level: collagen, laminin
c. Glomerular endothelial cells level: VEGF
11 1.2.2.3 Podocytes
Podocytes are highly specialized, terminally differentiated cells incapable of replication or proliferation. We are born with approximately 800 podocytes/glomerulus with roughly 2 million nephrons in two kidneys. The only way for the glomerulus to compensate the function of lost podocytes consists of cell hypertrophy which results in the glomerular tuft being covered by fewer podocytes, which eventually increases their vulnerability to further challenges (36).
Figure 1-6: Podocyte foot process effacement. a. Normal condition, b. After podocyte effacement. Podocyte foot process is denoted by * (37).
Podocytes have long fingerlike, regularly spaced, interdigitated foot processes that completely encircle the outer surface of glomerular capillaries and form 40 nm wide filtration slits between adjacent processes. Each filtration slit is bridged by a thin diaphragm, the filtration slit diaphragm, which inserts laterally into the podocyte cell membrane and connects adjacent processes (figure 1-5). Podocyte integrity is essential for the maintenance of GFB. Under pathological conditions, when podocytes are injured or lost, they respond in a similar pattern. The intercellular junctions and the cytoskeletal structure of the foot processes are altered to a simplified effaced phenotype which is known as podocyte effacement (figure 1-6). This alteration leads to the disappearance of the slit diaphragm structure and results in the development of albuminuria. (36, 38).
12 1.2.2.4 Proximal Tubules
Proximal tubules receive the plasma filtrate from glomeruli and reabsorb the major fraction of water, sodium and other solutes from the tubular lumen back to the blood compartment (or peritubular capillaries), whereas other solutes such as uric acid, creatinine, organic anions, potassium and protons are secreted into the filtrate. The most distinctive feature of the proximal tubules is the presence of a "brush" border on the apical end (luminal surface) of the tubules due to the presence of microvilli. The basolateral plasma membrane of adjacent proximal tubule cells is extensively interdigitated. This provides an increased apical and basolateral plasma membrane surface area that corresponds to a higher transcellular solute transport rate. Proximal tubules have a higher content of mitochondria in their cytoplasm to provide the excess energy necessary for pumping ions and molecules against their concentration gradient (39). Substances reabsorbed and secreted by proximal tubules are shown in table 1-1.
Proximal tubules can be divided into two parts based on their location, morphology and function – proximal convoluted tubules (PCT) and proximal straight tubules (PST). It is called proximal tubule as it begins at the urinary pole of the renal corpuscle and convolutes, as it twists around. PCT is mainly situated at the renal cortex (cortical labyrinth), whereas PST is the straight segment of tubule situated in the medullary rays of the cortex and outer medulla (figure 1-7a) (39). Although the PST of the juxtamedullary nephrons are not straight, they are defined as "straight parts" by their location in the outer stripe (40). Proximal tubules can be further defined ultra-structurally into three segments: S1, S2, and S3 (figures 1-7b and 1-7c). The S1 comprises the first half of the convoluted tubule. S1 segment contains the largest basolateral plasma membrane surface area with the highest Na-K-ATPase activity per unit membrane area and the highest mitochondrial density, which decreases from S1 to S3. S1 transforms into S2 gradually within the second half of the convoluted portion and is evidenced by a reduction in structural complexity. S2 cells also form the first part of the proximal straight tubules in the medullary rays. The S2 segment contains prominent lysosomes and endocytic apparatus which is diminished in the S3 segment whereas the amount and size of peroxisomes increase from S2 to S3. In rats, the size of microvilli in S2 is markedly shorter than in S1 (rat S1: ~4.5 -4.0 µM, S2: ~4.0 -1.0 µM). In rabbits, dogs and humans, the size of microvilli further decreases in S3,
13
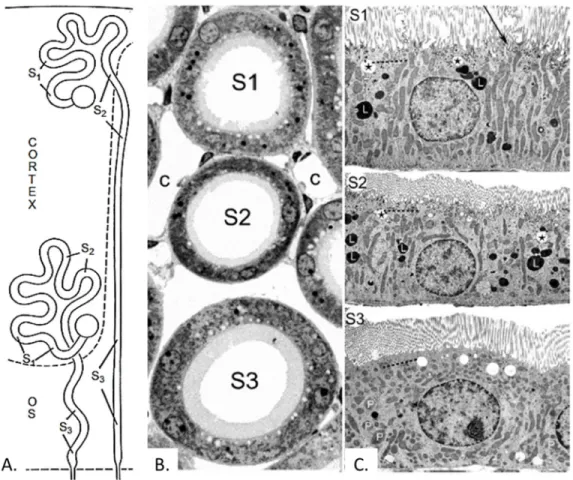
Figure 1-7: Schematic location and ultrastructure of proximal tubular S1–S3 segments in
superficial and juxtamedullary nephrons. (A.) For superficial nephrons, S1 segments begin at
the urinary pole of the renal corpuscle in the superficial cortex, transform gradually into S2
segments within the labyrinth, and S2 are transformed at different levels within the medullary
rays. S3 segments terminate at the border of the outer stripe (OS) to the inner stripe. For
juxtamedullary nephrons, S1 and S2 segments start at the urinary pole of the renal corpuscle in
the inner cortex, and S3 segments also terminate at the border of the outer stripe (OS) to the inner stripe. (B) Profiles of S1, S2, and S3 segments of juxtamedullary proximal tubules; note the differences in brush border length, in cell height, cytoplasmic density, and outer diameter (c: Peritubular capillaries; Rat: 1mm Epon section; ×~1000). (C): Ultrastructures of S1, S2 and S3 proximal tubular cells in the rat kidney. Note that the mitochondria in S1 and S2 are in lateral cell processes, whereas in S3 they are mainly scattered throughout the cytoplasm. The endocytic apparatus is in the subapical cytoplasm which is most prominent in S1 and S2 segments (broken lines), whereas endosomes (stars) and lysosomes (L) are localized deeper in the cytoplasm. There are few vacuolar apparatus and lysosomes present in the S3 segment, but peroxisomes (P) are more frequent in this segment. C, capillaries. Magnification: X ~5400 from transmission electron microscopy (39).
14
whereas it is longest in S3 in rats (39). However, ultrastructural analyses reveal no obvious segmentation of the proximal tubule in C57/BL/6J mice, including the length of the brush border microvilli (41).
There are several well-known markers to identify proximal tubules (PT) such as aquaporin 1 (AQP1), sodium glucose cotransporter (SGLT2 or SLC5A2), megalin, prominin-1. With the advancement of technologies, it is now possible to separate the S1, S2, S3 sections of PT. Recently, studies with single cell transcriptomics identified several genes that are specifically expressed in different segments as shown below in figure 1-8 (42, 43),
Figure 1-8: Proximal tubule markers of different segments. (A&B). Violin plot showing the expression level of different genes in S1, S2 and S3 segments of PT. PCT, proximal convoluted tubule, PST, proximal straight tubule. (C). The immunohistochemistry (IHC) data from The Human Protein Atlas showing marker expression patterns in proximal tubules (42, 43).
1.2.2.6 Loop of Henle
The loop of Henle carries filtrate from the proximal convoluted tubules to the distal convoluted tubules in the cortex. Functionally, it can be divided into three parts: A. The thin descending limb – where water is highly permeable, but ions are less permeable. B. The thin ascending limb that is impermeable to water but permeable to ions, C. The thick ascending limb (TAL), where almost 25% of the filtered sodium is reabsorbed by the Na+/K+/2Cl- co-transporter
A. B.
15
(NKCC2). Its main function is to create a concentration gradient by the specific ionic and aqueous channel composition of each part to concentrate the urine. Major substances reabsorbed or secreted are shown in table 1-1
1.2.2.6 Distal Tubules
The distal tubules are a short segment of the nephron between the loop of Henle and the collecting duct. Only 5-10% of filtered sodium and chloride is reabsorbed by distal tubules under physiological conditions (44). Sodium reabsorption is mainly mediated by the aldosterone regulated thiazide sensitive Na-Cl cotransporter (NCC) (45), and to a lesser extent by sodium proton exchanger NHE2. It also plays a central role in maintaining calcium and magnesium homeostasis and participates in net K+ and acid secretion (table1-1) (44). After distal tubules,
connecting ducts then descend towards the renal pelvis and empty urine into the ureter. 1.2.2.5 Juxtaglomerular Apparatus
The juxtaglomerular apparatus (JGA) comprise a collection of specialised cells where thick ascending limb (TAL) contacts the afferent and efferent arterioles of the same nephron (figure 1-3 and 1-4A). It performs two major functions: (1) the high distal tubular NaCl induced afferent arteriolar vasoconstriction (tubuloglomerular feedback) and (2) low tubular NaCl induced renin release (46). The JGA includes (a) macula densa cells which represent specialized tubular cells at the end of the thick ascending limb of Henle’s loop that are positioned adjacent to the glomerulus (figure 1-3). Their apical membrane is exposed to tubular fluid, whereas their basilar aspects are in contact with the cells of mesangium and the afferent arteriole, (b) the vascular smooth muscle cells (VSMC) and renin secreting granule cells in the afferent arteriole wall and (c) cells of extraglomerular mesangium, which fill the angle between the afferent and efferent glomerular arteriole, determine vasoconstriction or vasodilation via mesangial cell contraction (figure 1-4A) (47).
1.2.2.6 Tubuloglomerular Feedback
In the kidney, tubuloglomerular feedback (TGF) is the principal mechanism for autoregulation of GFR and renal blood flow (RBF). TGF acts as a negative feedback control mechanism which uses information from distal tubular fluid flow rate to control RBF. Because
16
GFR is affected by RBF, and thus distal fluid flow rate, TGF helps to maintains appropriate levels of GRF and RBF. TGF mechanism act by the coordinated interaction between cellular sensors – macula densa cells, mediators – juxtaglomerular cells and effectors – renal afferent and efferent arterioles. In response to increased flow of tubular fluid TGF decreases GFR by following a sequence of events (figure 1-9): (1) Changes in the Na+, K+, and Cl− concentrations
in the tubular fluid are sensed by the macular densa via the Na+-K+-2Cl− cotransporter (NKCC2)
in its luminal membrane. The macula densa then send this information to the justaglomerular cells via a concentration-dependent uptake of Na+, K+, and Cl− by NKCC2. (2) Cotransport
dependent hydrolysis of ATP in macula densa cells would lead to enhanced generation of adenosine (ADO) by 5′-nucleotidase. (3) ADO is then transported to the interstitium and activates adenosine A1 receptors, triggering an increase in cytosolic Ca2+ in extraglomerular
mesangial cells (MC). (4) Gap junctions transmit the Ca2+ signaling to the target cells in the
afferent arteriole, which results in the inhibition of renin secretion and afferent arteriolar vasoconstriction, thereby decreasing GFR. Local angiotensin II (Ang II) and neuronal nitric oxide synthase (NOS I) activity modulate this response (48). However, in response to decrease tubular fluid flow, TGF promotes renin secretion and RAS activation which leads to increased GFR.
17
Substance Description Proximal Tubule Loop of Henle Distal Tubule Collecting Ducts
Glucose
Almost 100% reabsorbed by proximal tubule. When blood glucose level exceeds 160-180 mg/dl kidneys fail to reabsorb all
glucose and secrete excess into urine developing glucosuria.
Almost 90% reabsorbed by SGLT2 (S1), and 10% by SGLT1 (S3) on the apical
side; and secreted by GLUT2 (S1), GLUT 1 (S3),
on the basolateral side
- - - Oligopeptides, proteins, amino acids Almost 100% reabsorbed by proximal tubules. Reabsorbed by Na+ -co-transporter, B(0)AT3, B(0)AT1, PEPT1, PEPT2
etc.
- - -
Urea
Maintains osmolality. Transported by urea transporter UT-A
(SLC14a2)
50% reabsorbed by diffusion; also secreted
Secretion, diffusion in descending limb - Reabsorption in medullary collecting ducts; diffusion
Sodium Uses mainly NHE3, NHE2, NKCC2, Na+-K-ATPase to
transport transcellularly.
65% reabsorped. Mainly mediated by the Na+/H+
exchanger NHE3 at brush border and partly by Na+
transporter coupled with substrates 25% reabsorbed, in thick ascending limb; mainly by NKCC2 5% reabsorbed, sodium-chloride symporter, NHE2 5% reabsorbed, stimulated by aldosterone, active Chloride
Usually follows sodium. Active (transcellular) and passive
(paracellular)
Reabsorbed, symport with Na+ and K+, diffusion Reabsorbed at thick ascending limb, NKCC2 reabsorption by sodium-chloride cotransporter reabsorbed symport, passive Water
Reabsorbed by aquaporin water channels. Influenced by antidiuretic hormone (ADH).
Mainly reabsorbed by. AQP1(S1), also reported by
AQP4 (mice, S3) Reabsorbed only in descending limb, impermeable to ascending limb Reabsorbed by AQP2 reabsorption increases by ADH, (via arginine vasopressin receptor 2) Bicarbonate Maintain acid-base balance. 80%-90% reabsorbed with sodium symport, (NHE3,
S3) reabsorption mainly by NHE3,NHE2 - reabsorption intercalated cells,
via band 3 and pendrin, Cl-antiport
Protons maintains electrochemical gradient across the cell to facilitate solute transport
Secrated, diffution - Secreted , active (intercalated cells) Secreted, active
Calcium Uses calcium ATPase, sodium-calcium exchanger reabsorption
reabsorption (thick ascending) via passive transport - reabsorbed in the presence of parathyroid hormone Phosphate 85% Reabsorption via Npt2a, NaPi-IIa, SLC34A1, Npt2c, NaPi-IIc, SLC34A3, Pit-2. Inhibited by parathyroid hormone. - reabsorbed, diffution - Potassium 65% reabsorbed 20% reabsorbed at thick ascending mainly by NKCC2 secreted, active secretion via Na+/K+-ATPase, regulated by aldosterone Magnesium Reabsorption, TRPM6, TRPM7 Reabsorbed in thick ascendinglimb reabsorption -
Carboxylate carboxylate transporters. 100% reabsorbed by - - -
18
1.3 Chronic Kidney Disease (CKD)
According to the international guidelines, CKD is defined as a decline in kidney function shown by a glomerular filtration rate (GFR) of less than 60 ml/min/1.73m2, or markers of kidney
damage or both, lasting more than 3 months regardless of the cause. The kidney function can no longer sustain life over time when GFR is decreased to less than 15 ml/min/1.73 m2, a condition
termed as End Stage Renal Disorder (ESRD) (50). When patients with CKD develop ESRD, they require kidney replacement therapy in the form of dialysis or kidney transplantation to survive. According to KDIGO recommendations CKD can be divided into different stages based on cause, GFR category (CKD Stage 1-5 as G 1-5), and by albuminuria category (A1, A2, A3) (measured by albumin: creatinine ratio or ACR) (Table-2) (51). For example, a patient with an estimated GFR of 40 ml/min/1.73 m2 and an ACR of 30 mg/mmol has CKD G3bA2 (or simply
CKD Stage 3b).
Table 1-2: Prognosis of CKD by GFR and albuminuria category. Green, low risk (if no other markers of kidney disease are present, no CKD); Yellow, moderately increased risk; Orange, high risk; Red, very high risk (51).
19
1.3.1 Prevalence of Chronic Kidney Disease
Patients with CKD have significantly higher rates of morbidity, mortality, hospitalization and healthcare utilization. Globally, diabetes and hypertension constitute the main causes of CKD. Worldwide, diabetes accounts for 30-50% of all causes of CKD, affecting 285 million (6.4%) adults, and this number is expected to reach by 69% in developed countries and 20% in developing low income countries (50). In 2000, hypertension accounted for 25% of all CKD patients and is estimated to increase 60% by 2025 (52). According to the latest report from United States Renal Data System (USRDS), overall prevalence of CKD in the US in 2011 to 2014 was 14.8% with stage 3 CKD (6.6%) among adults (53). In 2017, USRDS also reported, there were 741,037 prevalent cases of ESRD, with 285,614 of cases having diabetes. The prevalence of ESRD continues to rise by approximately 20000 cases per year (54). In 2015, the heath care associated cost for patients with CKD was $64 billion and another $34 billion for ESRD (55). The cost for ESRD is projected to rise by $54 billion by 2020 (56).
1.3.2. Laboratory Measurements for CKD
Clinically, CKD is defined by the persistent proteinuria and estimated GFR (eGFR) < 60 ml/min/1.73m2 persisting for more than 3 months. Normal kidneys usually do not allow proteins
to pass through the glomerular filter, but under pathological condition, they may allow large proteins such as albumin to leak from the blood to the urine. Proteinuria is easily measured by immunoassay, whereas GFR indicates the kidney function – it estimates how much blood passes through the glomeruli per minute. GFR is generally measured by an endogenous or exogenous filtration marker. KIDGO recommends to estimate GFR by using serum creatinine or serum Cystatin C (eGFRcreat or eGFRcys) (51). Inulin clearance is also used to precisely measure GFR,
but due to its complexity, it is not preferred clinically (57). Inulin clearance is routinely used for mouse models because of its fast and accurate GFR estimation. Changes in kidney structure, including interstitial fibrosis, scarring and tubular atrophy, are closely related to GFR and proteinuria. Histologically, tubular cell area measurement is also associated with GFR (50). CKD biomarkers including cystatin C, blood urea nitrogen, B2-microglobulin, kidney injury molecule-1, neutrophil gelatinase-associated lipocalin (NGAL), fibroblast growth factor 23 and asymmetric dimethylarginine (ADMA) gives valuable early detection method for CKD (58).
20
1.4 Diabetic Nephropathy
Diabetic nephropathy (DN) also known as diabetic kidney disease (DKD) is a major microvascular complication of diabetes and is the principal cause of ESRD, leading to the need of dialysis, otherwise resuling in fetal consequences. The rising global prevalence in diabetes and CKD has encouraged research efforts to tackle the growing epidemic of DN.
1.4.1 The Pathogenesis and Progression of DN
DN is a progressive disease that takes many years to develop. It is classically characterised by the presence of microalbuminuria (defined as >30mg but <300mg urinary albumin excreted, UAE, per day) and reduced renal function reflected by an increase in plasma creatinine concentration and a decrease in GFR (59). Hyperglycemia and increased blood pressure levels are the major risk factors for DN. If untreated, ~80% of T1D patients will progress to overt nephropathy or clinical albuminuria (>300mg UAE per day) by 10-15 years. 50% of T1D patients with overt nephropathy will develop ESRD within 10 years and 75% within 20 years, whereas, 20% to 40% of T2D individuals with microalbuminuria will develop overt nephropathy by 15 years. Only ~20% of T2D individuals with overt nephropathy will progress to ESRD by 20 years (60, 61).
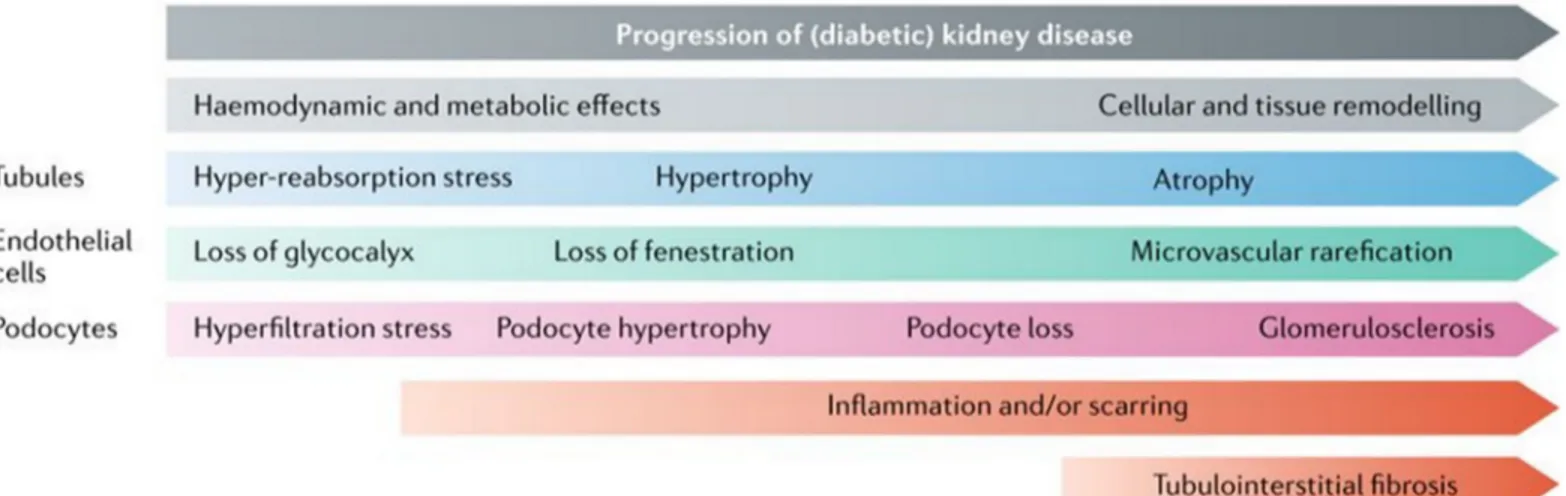
Different pathophysiological events leading to DN and progression to ESRD can be divided into early (haemodynamic and metabolic) and late (cellular and tissue remodelling) events (figure 1-11). In the early events, increased glucose filtration and glomerular hyperfiltration induce tubular hyper-reabsorption of glucose and sodium, which leads to glomerular and tubular hypertrophy and ultimately progresses to glomerulosclerosis and tubule atrophy. Injury and loss of glycocalyx and fenestration in endothelial cells leads to proteinuria and subsequently leads to microvascular rarefication promoting atrophy and scaring. Local expression of cytokines (angiotensin II etc.), chemokines, and immune cell recruitment (inflammation) also promotes tissue remodelling, contributing to atrophy and scarring (figure 1-10 and 1-11) (62).
21
Figure 1-10: Pathological lesions of DKD. The normal healthy glomerulus is impermeable to albumin. In contrast, the diabetic glomerulus displays arterial hyalinosis, mesangial expansion, collagen deposition, basement membrane thickening, podocyte loss and hypertrophy, albuminuria, tubular epithelial atrophy, accumulation of activated myofibroblasts and matrix, influx of inflammatory cells, and capillary rarefaction. Moreover, PAS staining of normal healthy human glomerular section and a kidney section from a sample with DKD has been shown (63).
22
Histopathologically DN can be distinguished in different phases of development. In the preliminary phase, glomerular hyperfiltration and hyperperfusion occur in the nephron at the glomerulus level, before the beginning of any measurable clinical changes. Afterwards, thickening of glomerular basement, glomerular hypertrophy and mesangial expansion, nodular glomerulosclerosis (Kimmelstiel-Wilson lesion) and arteriolar hyalinosis takes place (figures 1-10).
According to Tervaert et al., pathological classification of DN includes four classes as described in table 1-3 below (64).
Class Description and criteria
I Mild or nonspecific light microscopy changes and GBM thickening proven by electronic microscopy. GBM > 395 nm in female and GBM >430 nm in male individuals
IIa Mild mesangial expansion in >25% of the observed mesangium IIb Severe mesangial expansion in >25% of the observed mesangium
III At least one convincing Kimmelstiel–Wilson lesion (nodular sclerosis)
IV Advanced diabetic glomerulosclerosis. Global glomerular sclerosis in >50% of glomeruli Table 1-3: Pathological classification of diabetic nephropathy (DN) (64).
1.4.2 Pathomechanisms of DN
Although the pathogenesis of DN is not fully understood, several factors play an important role in its progression such as hyperglycemia, hypertension, heamodynamic factors (e.g. renin-angiotensin-aldosterone system, endothelin systems), podocytes, reactive oxygen species, activation of protein kinase C, activation of the aldose reductase pathway, increased advanced glycation end products (AGEs), and cytokines like angiotensin II, TGF-β etc. Some of these factors are discussed below in detail.
23 1.4.2.1 Hyperglycemia and DN
Hyperglycemia leads to kidney damage directly or through hemodynamic modifications. In a normal glycemic adult human (plasma glucose concentration ~5.5 mmol/L; GFR 125ml/min/1.73m2), kidneys can filter 160-180g of glucose per day. The proximal tubules
reabsorbs 99% of glucose mainly by SGLT2 (~97%). This reabsorbed glucose is returned to circulation w hich contributes to maintain blood glucose level and overall metabolic balances.
Hyperglycemia increases the amount of glucose filtrated through the glomerular filtration barrier and induces hyper-reabsorption of glucose by proximal tubules (500-600g/24h), reaching plasma glucose concentration of approximately 10-12 mmol/L. This hyper-reabsorption of glucose induces glucose transporter expression (e.g. SGLT2) and increases energy consumption in the proximal tubules leading to an increase in oxygen demand in the cortex and outer medulla. This contributes to ischemia and expression of stress markers like NGAL and KIM1 in proximal tubules. Overwork by proximal tubules leads to proximal tubule hypertrophy and elongation, subsequently leading to kidney hypertrophy. Furthermore, SGLT2 increases sodium reabsorption in the proximal tubules, thereby decreasing sodium delivery to the distal tubules and macula densa. A low concentration of NaCl in the macula densa disables the tubuloglomerular feedback mechanism and leads to dilation of the afferent arteriole and persistent glomerular hyperfiltration. Concomitant activation of the renin angiotensin system (RAS) further increases single-nephron GFR (SNGFR) and glomerular hypertension (62, 65).
Along with tubular cells, as discussed above, persistent hyperglycaemia also exposes endothelial cells, mesangial cells, and podocytes to several stressors like hyperfiltration, hyper-reabsorption, advanced glycosylation end products, oxidative stress, and epigenetic changes, leading to further nephron loss over a period of time.
However, hyperglycemia alone does not account fully as the causative risk factor for DN in humans. Mauer et al. showed that, kidneys from nondiabetic human donors develop GBM and mesangial lesions when transplanted into patients with diabetes but the rate of development of these lesions differs widely in different kidneys irrespective of the blood glucose control (66, 67). This indicates that, in humans, hyperglycemia is necessary but not sufficient to cause renal damage and that other factors are needed for the clinical manifestation of DN.
24
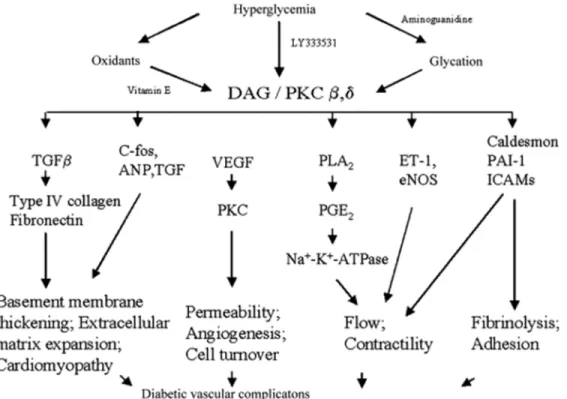
Three major mechanisms have been proposed that might explain how hyperglycemia causes tissue damage – (a) Non-enzymatic glycosylation, (b) Activation of PKC and (c) Aldose reductase pathway (68). Hyperglycaemia induced ROS generation and oxidative stress is a common factor in all three pathways (Figure 1-16) (69).
1.4.2.2 Glycosylation and DN
Glycosylation of proteins contributes to the development and progression of DN and other microvascular complications. During persistent hyperglycemia, some of the excess glucose reacts non-enzymatically with the free amino groups in a variety of proteins, lipids and nucleic acids, and gives rise to two major classes of glycation products via the Maillard reaction. This glycosylation process affects the GBM and other matrix components in the glomerulus, by formation of reversible early glycosylation end products and later, irreversible advanced glycosylation end products (AGEs). Non-enzymatic glycosylation could be involved in the pathogenesis of DN by the following possible mechanisms (Figure 1-12): (a) AGEs alter signal transduction pathways involving ligands on the extracellular matrix. (b) AGEs alter signal transduction by alteration in the level of soluble signals such as cytokines, hormones and free radicals, via AGE specific cellular receptors. (c) Intracellular glycation by glucose, fructose and metabolic pathway intermediates can directly change protein function, trafficking and breakdown in target tissues (70).
AGEs are involved in the accumulation of extracellular matrix (ECM) in glomerular mesangium and tubulointerstitium by creating an imbalance between synthesis and degradation of ECM components. This leads to the pathogenic accumulation of collagen, fibronectins and laminins. The formation of inter and intramolecular disulphide bridge crosslinking after glycation of collagen leads to structural alterations, including surface charge and packing density. This results in increased stiffness, reduced thermal stability, and resistance to proteolytic digestion of collagen (71).
Circulating AGEs are efficiently cleared by the normal kidney and excreted in the urine. However, with kidney dysfunction, AGEs start to accumulate in the serum, as seen in diabetic patients. Circulating AGEs with their biological activities, may contribute to further organ damage through re-deposition in the tissues (72). Several studies have implicated receptors for