O
pen
A
rchive
T
OULOUSE
A
rchive
O
uverte (
OATAO
)
OATAO is an open access repository that collects the work of Toulouse researchers and
makes it freely available over the web where possible.
This is an author-deposited version published in :
http://oatao.univ-toulouse.fr/
Eprints ID : 12031
To link to this article : DOI :
10.1117/12.859247
URL :
http://dx.doi.org/10.1117/12.859247
To cite this version :
Destic, Fabien and Petitjean, Yoann and
Massenot, Sébastien and Mollier, Jean-Claude and Barbieri, Stefano
THz QCL-based active imaging dedicated to non-destructive testing
of composite materials used in aeronautics. (2010) In: SPIE Optics
+ Photonics 2010, 1 August 2010 - 5 August 2010 (San Diego,
United States)
Any correspondance concerning this service should be sent to the repository
administrator:
[email protected]
THz QCL-based active imaging dedicated to Non Destructive
Testing of composite materials used in aeronautics
F. Destic
a, Y. Petitjean
a, S. Massenot
a, J.-C. Mollier
a,band S. Barbieri
ca
Universit´
e de Toulouse - ISAE - 10, avenue Edouard Belin - Toulouse, France
bONERA - 2, avenue Edouard Belin - Toulouse, France
c
Universit´
e Paris-Diderot - Mat´
eriaux et Ph´
enom`
enes Quantiques - Paris, France
ABSTRACT
This paper presents a CW raster-scanning THz imaging setup, used to perform Non-Destructive Testing of
KevlarTMand carbon fibre samples. The setup uses a 2.5 THz Quantum Cascade Laser as a source. Delamination
defect in a Kevlar sample was detected showing a sensitivity to laser polarization orientation. Detection of a break in a carbon/epoxy sample was also performed.
Keywords: Terahertz, active imaging, Quantum Cascade Laser, aeronautical composite materials, non destruc-tive testing, carbon fibre, Kevlar
1. INTRODUCTION
Composite materials such as glass fibre epoxy, carbon fibre and Kevlar have experienced a rapid development during the last decade. Their use in aeronautical engineering is now very important. For example, in the Airbus A380, fibrous composite materials have been deployed extensively in primary loadcarrying structure to achieve a 17% lower fuel use per passenger than comparable aircraft.
Non-Destructive Testing (NDT) is useful for initial inspection of test samples and analysis of reasons for failure. Several methods are currently used: ultrasonic testing with single element transducers and linear phased array probes in pulse echo and through transmission mode, resonance methods, shearography and thermography for example.
NDT using THz waves can be an alternative when “traditional” methods have poor efficiency (composite made from soft epoxy resin, for instance) or to improve spatial resolution.
During the five past years, some works have been conducted about characterization or imaging, in the THz range, of various composite materials. Most of these works used pulsed THz-Time Domain Spectroscopy
(THz-TDS). Rutz and coworkers1, 2studied low density polyethylene (LDPE) containing titanium dioxyde nanospheres
and glass-fibre reinforced polymers to measure the concentration of glass fibres. The orientation of glass fibres in reinforced plastics can also be determined,3 sand inclusion or metal in HDPE weld joints can be detected.4
Test of fire damages on carbon fibre using reflectivity dependance to polarization was reported.5, 6 Due to fibres orientation, the material exhibits a grid structure that causes the reflection coefficient to be dependant from the incident beam polarization state: reflectivity, for normal incidence, increases when the polarization is parallel to fibres orientation, penetration depth increases in the case of a polarization state perpendicular. Stoik
et al.7 also used THz-TDS to detect burn damages and delamination on glass fiber.
Only a few of these works have also performed CW THz imaging: at 1.63 THz with a gas laser5 or with
Gunn diodes at 0.2 and 0.38 THz5or 0.6 THz.6
Composite materials diagnostic using CW THz waves produced by Quantum Cascade Laser have not yet been investigated. This approch seems to be very promising as QCLs are THz sources emitting a few tens of mW, at frequencies in the [1-4] THz range, with a beam quality in constant improvement.
In this paper, transmission properties of Kevlar and carbon fibre samples are investigated with a QCL based imaging steup. Measurements have been made on various samples, known to present a defect, for two orthogonal electric field orientations relative to sample structure.
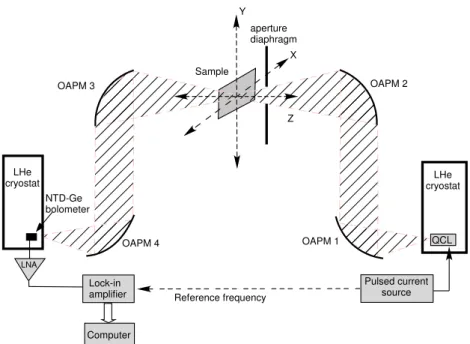
LHe cryostat Pulsed current source Lock-in amplifier NTD-Ge bolometer LHe cryostat Sample OAPM 3 OAPM 2 OAPM 4 OAPM 1 X Y Computer LNA Reference frequency QCL Z aperture diaphragm
Figure 1. Experimental setup
2. EXPERIMENTAL SETUP
The raster-scanning imaging experimental setup (fig. 1) uses a 2.5 THz Quantum Cascade Laser (QCL) as a THz source . The QCL is driven by an ILX Lightwave LDP3840P pulsed current source (Duty Cycle, up to 10%; Pulse Width, 100 ns to 10 ms). A ten of milliwatts at 2.5 THz are available at the output of the cryostat. The emitted beam is then collected by a set of four Off-Axis Parabolic Mirrors (OAPM) that allow us to focus it on the sample to be imaged. The four mirrors are 76.2 mm in diameter. The first one, labelled OAPM1 on the figure, exhibits an effective focal length (EFL) of 76.2 mm, the others mirrors have 152.4 mm EFL. The object is moved in X and Y by two Newport SMC100 motorized translation stages. Two types of detector can be used:
either a cooled NTD-Ge bolometer (QMC Instruments Ltd., NEP = 2.8 pW.Hz−1/2) or a Golay cell (Tydex,
NEP = 113 pW.Hz−1/2). The signal is acquired via a Signal Recovery 7270DSP lock-in amplifier.
2.1 Quantum Cascade Laser characteristics
QCLs used in this experiment are developped at Laboratoire Mat´eriaux et Ph´enom`enes Quantiques from Uni-versit´e Paris-Diderot.
Based on a bound-to-continuum active region and a single plasmon waveguide,8the laser consists of 90 repeat periods of a GaAs/Al0.15Ga0.85As heterostructure. The active region is embedded between upper (80 nm thick)
and lower (700 nm thick) GaAs layers which are doped at levels of n = 531018 cm−3 and n = 231018 cm−3,
respectively. These layers, together with the 11.57 µm thick active region, the semi-insulating substrate, and the top contact metallization, form a plasmon confinement waveguide. The two 12.0 and 11.4 nm thick quantum
wells were doped at a level of only 1.631016 cm−3, yielding a computed overlap factor of 27% and waveguide
losses of 10 cm−1. Lasers were grown by molecular-beam epitaxy and wetetched into ridge cavities 240 µm wide
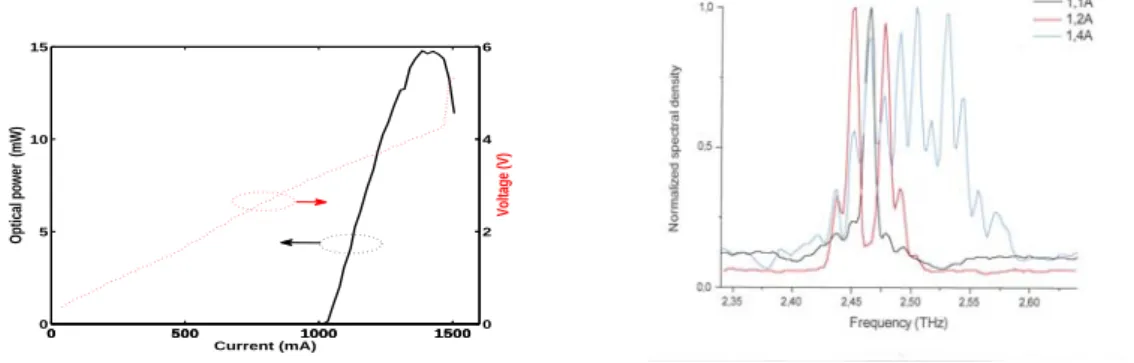
and 12 µm deep. Devices were indium bonded to copper holders and mounted on the cold head of a cryostat. This device emits at 2.5 THz and the threshold current, in pulsed operation (Duty Cycle=1%), is measured close to 1A at 4.2 K (see fig.2). At high injection current, the emission spectrum is multimode, centered at about 2.5 THz and a spectral width equal to about ±0.05 THz (fig.3).
The beam divergence was measured by the scanning slit method: the Golay cell, fitted with a 1 mm wide slit, was scanned in X (horizontal axis) and Y (vertical axis) as the power was measured.9 Then the full width
at 1/e2 was determined fitting the data to a Gaussian profile. Beam width variation as a function of distance
0 500 1000 1500 0 5 10 15 Optical power (mW) Current (mA) 0 500 1000 15000 2 4 6 Voltage (V)
Figure 2. L(I) and I(V) characteristics Figure 3. Spectra (measured at MPQ lab.)
experimental data: 16◦ in Y, corresponding to the large dimension (≈ 240µm) of the laser cavity and 21.5◦ in
X, corresponding to the small dimension (≈ 12µm).
Assuming a gaussian beam, we can write the relation tan θi= λ/πω0i where θ is the half-divergence angle (in radian), ω0i is the beam waist, i=X or Y refers to the axis and the measured divergence. Then, we can calculate
2ω0X≈ 200µm along X axis and 2ω0Y ≈ 280µm along Y axis in the laser facet plane. These values are in good
agreement with cavity dimensions as the THz mode has a significant part decaying within the substrate.10
Moreover, at a distance equal to the focal length of the first OAPM used in our setup (Effective Focal Length EFL=76.2mm, φ=76.2mm), the beam pattern has been imaged moving the Golay cell, masked by a metallic screen pierced by a 1.5 mm diameter hole, in X and Y with a 1.5 mm step (fig.5). Even if the pattern is slightly multimode, the beam size was found smaller than the mirror diameter, allowing a good collection efficiency.
0 20 40 60 80 100 −20 0 20 40 60 80 100 Position (mm)
Full Width at 1/e
2 (mm)
X axis 1/2 divergence = 21.5°
Y axis 1/2 divergence = 16°
Figure 4. Evolution of the beam width relative to laser distance −40 −20 0 20 40 60 −40 −20 0 20 40 0 0.2 0.4 0.6 0.8 1 X axis Y axis Normalized power
Figure 5. Beam pattern at ≈ 75mm from the laser facet
2.2 Setup characterization
2.2.1 Spot size
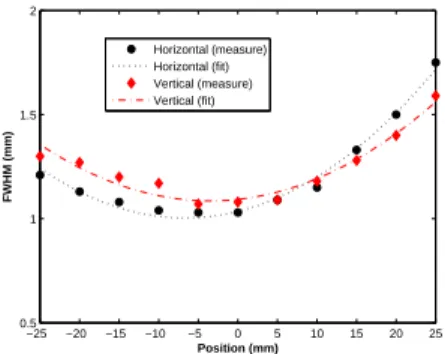
In order to determine the best position for sample, the spot size and its location have to be measured. To do this, the well-known “knife-edge method”11is used: a razor blade is moved by steps of 100 µm across the beam as the signal is measured. The spot size is obtained by derivating the data, fitting to a Gaussian, then determining
the full width at 1/e2 of the Gaussian curves. Various measurements were performed, moving the blade either
−25 −20 −15 −10 −5 0 5 10 15 20 25 0.5 1 1.5 2 Position (mm) FWHM (mm) Horizontal (measure) Horizontal (fit) Vertical (measure) Vertical (fit)
Figure 6. Evolution of the beam waist along Z axis 1 mm 1 .0 9 m m
Figure 7. Spot view imaged by a VOx mi-crobolometer camera
The spot is quasi-circular: the waist along vertical axis is 1.09 mm and 1 mm along the horizontal one. Due to the ellipticity of the QCL beam, the waist locations are slighty different wether we consider the horizontal or vertical axis. But, as seen on fig.6, around Z = -5 mm, the beam waist variation relative to Z position is weak so, we can determine a working region of ± 5mm mm where the spot size is still acceptable.
For experiments, the sample under test will be located at Z = -5 mm where the spot size is close to 1.1 mm x 1 mm.
2.2.2 THz power
The CW power measured at the focal point is about 0.5 mW. This value can be quite surprising regarding the 15mW CW emitted by the QCL at maximum current (fig.2). In fact, at 1400 mA the laser spectrum is multimode (fig. 3), lying between 2.45 and 2.55 THz. In this narrow window, under normal conditions, we can distinguish two regions: above 2.5 THz, transmission losses are close to 2.5 dB/m; below 2.5 THz losses can
reach 25 dB/m and even more than 60 dB/m around 2.46 THz.12 Our setup is not currently installed in dry
atmosphere and the optical path is close to 0.4 m. So, losses due to atmospheric propagation can achieve 10 dB or more, especially in wet atmosphere. Atmospheric propagation losses, transmission losses through the cryostat window (≈ 1.9dB) and 2 dB losses from diaphragm used to suppress diffraction give a total of about 15 dB losses, in good agreement with the power measured at focal point.
2.2.3 Spatial resolution
In order to estimate the setup spatial resolution, a “home-made” resolution target was imaged with a 1 mm step in X and Y. The narrowest metallic stripe is 0.7 mm wide. A processing algortithm is applied to datas: oversampling by a factor 4 and low-pass filtering. In fact, if the original image is M x N pixels, each pixel with
a surface a mm2, the processed image is 4M x 4N pixels whose surface is equal to a/4 mm2. By this way, we
obtain images with an improved spatial resolution. This treatment will be applied later on composite materials datas.
The raw image (fig.9 left) is 10 x 31 pixels and for the 0.7 mm wide stripe the metal-background contrast is not maximum: the stripe is not fully resolved but it can be seen. The processed image is 40 x 124 pixels, each pixel 0.25 mm2 (fig.9 right) and the 0.7 mm stripe is completely resolved.
Moving the sample under test with a 1 mm step, 0.7 mm spatial resolution can be achieved with datas processing .
3. COMPOSITE MATERIALS CHARACTERIZATION
Two samples, one Kevlar fibres and the second carbon fibres, both with resin epoxy, with known defects have been used. For all experiments, we performed two acquisitions for each sample. As the QCL is lineary polarized in the horizontal plane, the first image is made for a given position of the sample, taken as a reference. For the second image, the sample is rotated by 90◦. So, we obtain two images for two perpendicular orientations of the electric field, relative to the sample.
4.8 mm 2.6 mm 2.4 mm 2 mm 0.7 mm
Figure 8. Resolution target: visible image
5 10 5 10 15 20 25 30 10 20 30 40 20 40 60 80 100 120
Figure 9. Resolution target: THz images, raw (left) and processed (right)
3.1 Sample 1: Kevlar
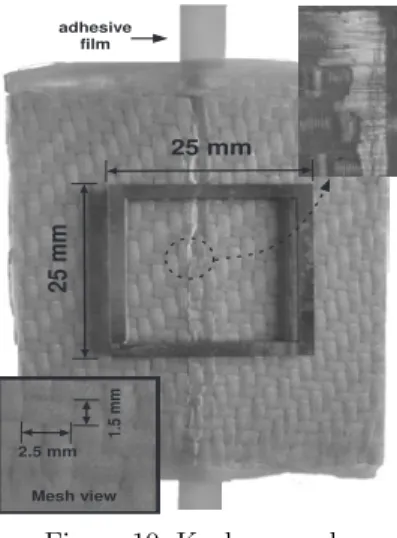
The first sample (fig.10) is made of four Kevlar sheets (thickness ≈ 0.5 mm, mesh size ≈ 1.5 mm x 2.5 mm), assembled with epoxy. A thin adhesive film, 5 mm wide, is inserted between two sheets to avoid polymerisation. By this way, a region of weakness is produced where, applying a stress, we can create delamination. The region
to be imaged is delimited by a 21 x 21mm2 inner dimension metallic frame used to rotate and surimpose images
before displaying and analyzing them.
NB: metallic frame is removed from displayed images
25 mm 2 5 m m adhesive film Mesh view 1 .5 m m 2.5 mm
Figure 10. Kevlar sample
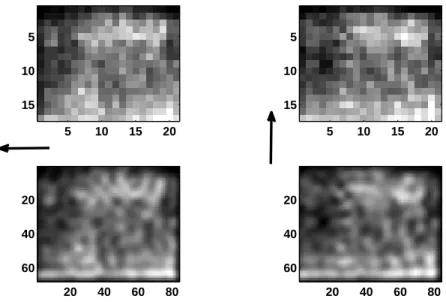
Figure 11 shows 21 x 21 pixels images acquired with a 1 mm step in X and Y. As explained before, the two images are obtained for two orthogonal positions of the sample relative to laser polarization, arrows showing electric field orientation.
The delamination appears as a dark region corresponding to low transmission. This can be explained by scaterring from Kevlar fibres. In fact, the stress was applied in a zone where epoxy is not present and, as Kevlar fibres are not teared due to their elasticity, fibres perpendicular to the delamination direction connect the opposite sides of the break whereas fibres parrallel to the break are retracted on each side (see microscopic inspection of the delamination zone fig.10). This fibres arrangement can behave as a subwavelength grating with a step Λ ≈ 10µm is well below the working wavelength (λ = 125µm), such structures are known to be polarization dependant.
5 10 15 20 5 10 15 20 5 10 15 20 5 10 15 20
Figure 11. Transmission images for two polarization orientations
On THz images, defect is more visible when electric field is perpendicular to the delamination main direction ie parrallel to fibres main orientation (fig.11 right).
20
40
60
80
20
40
60
80
20
40
60
80
20
40
60
80
Figure 12. Processed images (84 x 84 pixels or 21 mm2)
As a reference, the sample was imaged with the same experimental conditions, in a region without any defect. In this case, whatever the QCL polarisation state relative to the sample, nothing noteworthy can be observed on the raw images as on the processed ones.
3.2 Sample 2: carbon/epoxy
We also tested a 0.5 mm thick sample of carbon fibre epoxy. An adhesive film is also sandwiched between two sheets of fibre to create a weak region where a stress has been applied to break the fibres. Figure 14 shows the sample and a view of the mesh size. Figure 15 presents the 84 x 84 pixels processed images, white arrow indicating electric field orientation.
We can clearly identify the region where the fibres are broken, corresponding to a maximum in transmission. This surprising behavior, compared to the one observed for Kevlar, can be explained from the fact that, in this case, fibres are totally broken and an open failure is created. This failure dimensions are about a few wavelengths, allowing transmission of the THz wave with some diffraction and a low sensitivity to polarization.
4. CONCLUSION
Non-Destructive Testing of Kevlar and carbon fibre samples was realized by THz transmission mode imaging using a 2.5 THz Quantum Cascade Laser. A delamination defect in a Kevlar sample was detected showing a sensitivity to laser polarization orientation. A break in carbon/epoxy was also detected.
As a perspective, it will be interesting to test these samples in transmission at other frequencies and in reflection mode imaging, this evolution of the setup being essential to envisage in-situ evaluation of materials.
5 10 15 20 5 10 15 5 10 15 20 5 10 15 20 40 60 80 20 40 60 20 40 60 80 20 40 60
Figure 13. Kevlar: reference THz images
2 mm 2 m m Mesh view 2 5 m m 25 mm
Figure 14. Carbon sample: visible image (≈ 30 mm x 50 mm) and mesh view
Figure 15. Carbon sample: processed THz
im-ages (84 x 84 pixels or 21 x 21 mm2)
Obviously, samples tested in this paper are not real cases as they are thin and very damaged. However, these results seems to be promising.
REFERENCES
1. F. Rutz, M. Koch, S. Khare, and M. Moneke, “Quality control of polymeric compounds using terahertz imaging,” Terahertz and Gigahertz Electronics and Photonics IV 5727(1), pp. 115–122, SPIE, 2005. 2. F. Rutz, S. Wietzke, M. Koch, H. Richter, S. Hickmann, V. Trappe, and U. Ewert, “Non-destructive testing
of glass-fibre reinforced polymers using Terahertz spectroscopy,” in European Conference on Non Destructive Testing (ECNDT2006), 2006.
3. C. J¨ordens, M. Scheller, S. Wietzke, D. Romeike, C. Jansen, T. Zentgraf, K. Wiesauer, V. Reisecker, and M. Koch, “Terahertz spectroscopy to study the orientation of glass fibres in reinforced plastics,” Composites Science and Technology 70(3), pp. 472 – 477, 2010.
4. S. Wietzke, C. J¨ordens, N. Krumbholz, B. Baudrit, M. Bastian, and M. Koch, “Terahertz imaging: a new non-destructive technique for the quality control of plastic weld joints,” J. European Optical Society Rapid Publication , 2007.
5. A. Redo-Sanchez, N. Karpowicz, J. Xu, and X.-C. Zhang, “Damage and defect inspection with terahertz waves,” in 4th International Workshop on Ultrasonic and Adavanced methods for nondestructive Testing and material Characterization, www.ndt.net, ed., 2006.
6. N. Karpowicz, D. Dawes, M. J. Perry, and X.-C. Zhang, “Fire damage on carbon fiber materials characterized by THz waves,” Terahertz for Military and Security Applications IV 6212(1), p. 62120G, SPIE, 2006. 7. C. D. Stoik, M. J. Bohn, and J. L. Blackshire, “Nondestructive evaluation of aircraft composites using
transmissive terahertz time domain spectroscopy,” Opt. Express 16(21), pp. 17039–17051, 2008.
8. S. Barbieri, J. Alton, H. E. Beere, J. Fowler, E. H. Linfield, and D. A. Ritchie, “2.9 THz quantum cascade lasers operating up to 70 K in continuous wave,” Applied Physics Letters 85(10), pp. 1674–1676, 2004. 9. Y. Sidorin and R. V. Shack, “Measurement of laser diode astigmatism using the beam-line method,” Optical
Engineering 40(6), pp. 995–1000, 2001.
10. J. Alton, S. S. Dhillon, C. Sirtori, A. de Rossi, M. Calligaro, S. Barbieri, H. E. Beere, E. H. Linfield, and D. A. Ritchie, “Buried waveguides in terahertz Quantum Cascade Lasers based on two-dimensional surface plasmon modes,” Applied Physics Letters 86(7), p. 071109, 2005.
11. A. Siegman, M. Sasnett, and J. Johnston, T.F., “Choice of clip levels for beam width measurements using knife-edge techniques,” Quantum Electronics, IEEE Journal of 27, pp. 1098 –1104, apr 1991.
12. Y. Petitjean, “Etude th´eorique et exp´erimentale d’ondes T´erahertz ´emises par des Lasers `a Cascade Quan-tique refroidis `a l’h´elium liquide,” Master’s thesis, Supaero, 2007.