Information Diffusion, Information and Knowledge Extraction
From Social Networks
Diffusion d'Information, Extraction d'Information et de Connaissance
sans les Réseaux Sociaux
Contents
Contents i
List of Figures v
List of Tables vii
List of Abbreviations xi Acknowledgement 1 Abstract 3 Résumé 5 Publications 17 1 Introduction 19
2 Information Diffusion on Social Networks 23
2.1 Introduction . . . 24
2.2 Related work . . . 27
2.3 Predicting information diffusion on microblogs . . . 30
2.3.1 Tweet representation . . . 30
2.3.1.1 User-based features . . . 31
2.3.1.2 Time-based features . . . 35
2.3.1.3 Content-based features . . . 36
2.3.2 Processing time . . . 38
2.3.3 Machine learning model . . . 38
2.3.4 Data and evaluation framework . . . 39
2.3.5 Experiments and results . . . 41
2.3.5.1 Binary classification . . . 41
2.3.5.2 Multi-class classification . . . 44
2.3.6 Most important features. . . 47
2.3.6.1 Binary classification . . . 47
2.3.7 Correlations between features . . . 49
2.4 Predicting the diffusion of brand stories on microblogs . . . 53
2.4.1 Tweet representation . . . 55
2.4.2 Machine learning model . . . 56
2.4.3 Data and evaluation framework . . . 56
2.4.4 Experiments and results . . . 58
2.4.4.1 Binary classification . . . 58
2.4.4.2 Multi-class classification . . . 61
2.4.5 Further experiments on datasets collected from offi-cial account of companies . . . 64
2.5 Discussions and conclusions . . . 68
3 Location Extraction from Microblogs 71 3.1 Introduction . . . 72
3.2 Related work . . . 75
3.2.1 Location extraction . . . 75
3.2.2 Prediction of locations . . . 78
3.3 Combining location extraction methods . . . 80
3.4 Location prediction . . . 83
3.4.1 Location extraction on tweets containing locations . 84 3.4.2 Predictive model for locations in tweets . . . 85
3.4.2.1 Tweet features . . . 86
3.4.2.2 Learning models and evaluation framework 88 3.4.3 Experiments and results . . . 90
3.4.3.1 Most important features for training . . . 90
3.4.3.2 Optimized criteria . . . 92
3.4.4 Location extraction for predicted tweets . . . 95
3.4.5 Applying Doc2Vec to location prediction . . . 96
3.5 Conclusions and discussions . . . 105
4 Building a Knowledge Base using Microblogs 107 4.1 Introduction . . . 108
4.2 Related work . . . 111
4.2.1 Ontology-based information extraction . . . 111
4.2.2 Event detection . . . 112
4.2.3 Location extraction . . . 114 4.3 Knowledge base model: the geographical-festival ontology . 115
Contents iii
4.4 Populating the domain ontology . . . 117
4.4.1 Principles . . . 117
4.4.2 Location population . . . 119
4.4.3 Festival population . . . 120
4.4.4 Relationship between tweets, festivals and locations 120 4.4.5 Performance population . . . 121
4.4.6 Inferring new knowledge . . . 121
4.5 Conclusions and discussions . . . 121
5 Conclusions 124
List of Figures
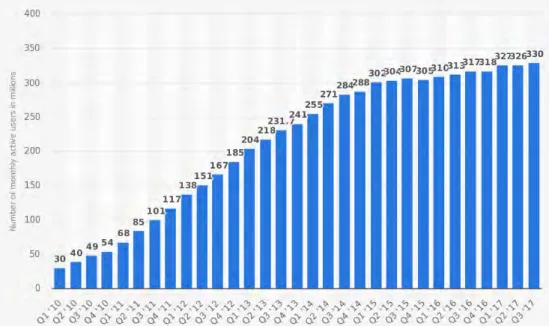
2.1 The number of monthly active Twitter users worldwide from
the 1st quarter 2010 to the 3rd quarter 2017 . . . 25
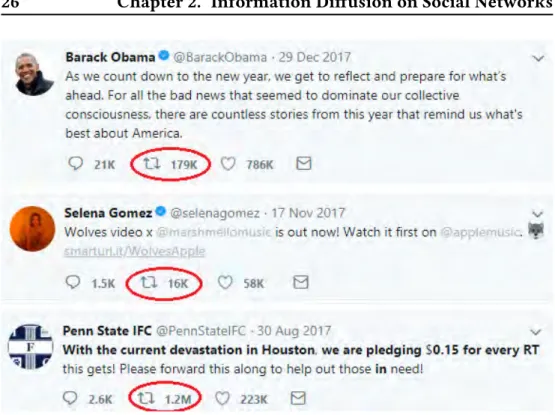
2.2 The retweet number of some tweet examples. . . 26
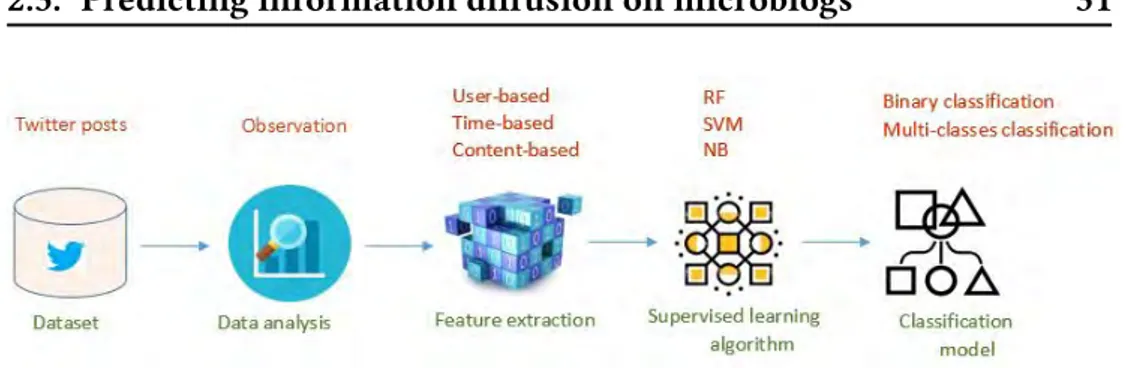
2.3 The process of our predictive model . . . 31
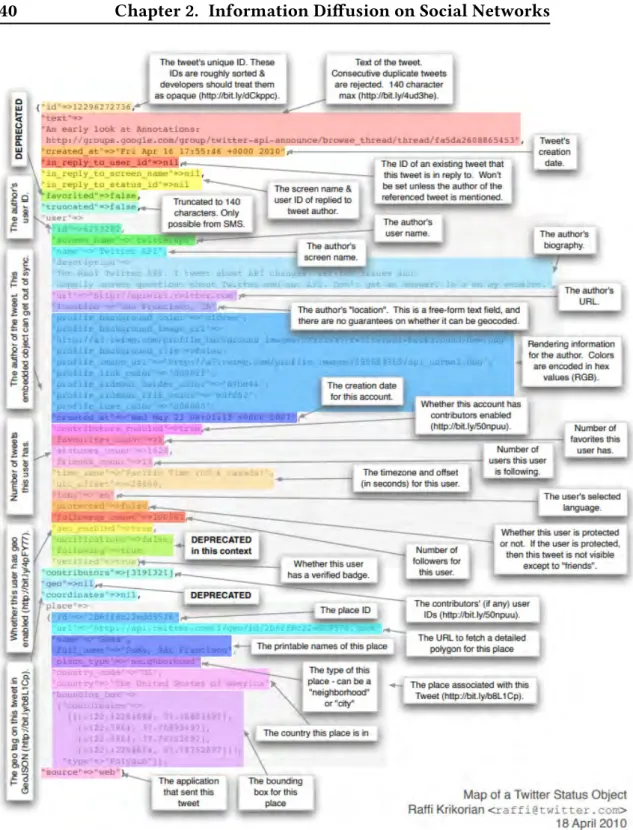
2.4 The map a Twitter status object. . . 40
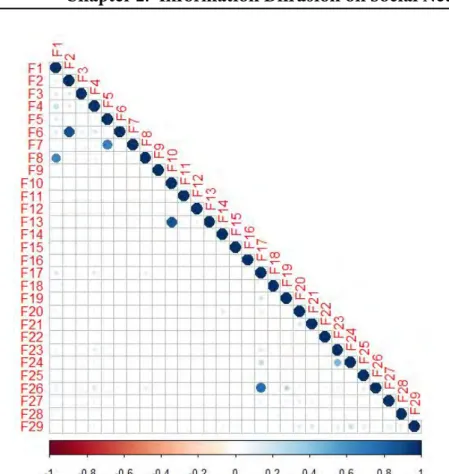
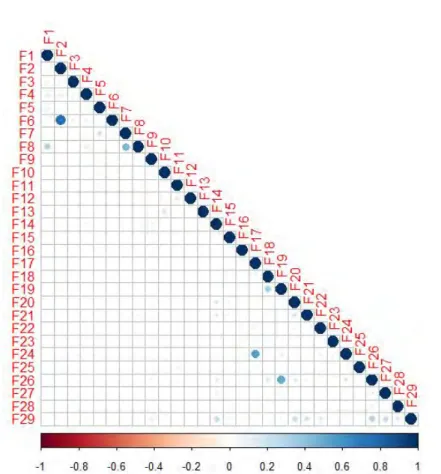
2.5 The correlation between features in the Sandy dataset. The large and bold circles represent high correlations. . . 50
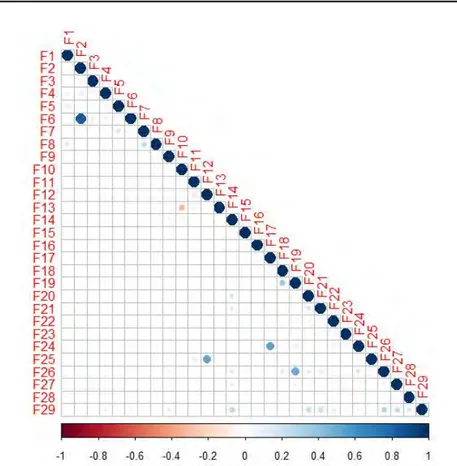
2.6 The correlation between features in the FirstWeek dataset. . 51
2.7 The correlation between features in the SecondWeek dataset. 52 3.1 The location extraction process. . . 85
3.2 Examples of tweets containing a location in the content. . . 86
3.3 Accuracy, TP, FP, and F-measure for TCL when optimizing accuracy and TP obtained by a RandomForest threshold of 0.5 for the Ritter dataset. . . 90
3.4 Accuracy, TP, FP, and F-measure for TCL when optimizing accuracy obtained by a RandomForest threshold of 0.75 for the MSM2013 dataset with different numbers of features rep-resenting tweets . . . 91
3.5 Accuracy, TP, FP, and F-measure for TCL when optimizing true positive obtained by a Randomforest threshold of 0.2 for the MSM2013 dataset with different numbers of features rep-resenting tweets. . . 92
4.1 Model to represent events - the case of the Festival ontology 116 4.2 The process of populating the knowledge base. . . 118
List of Tables
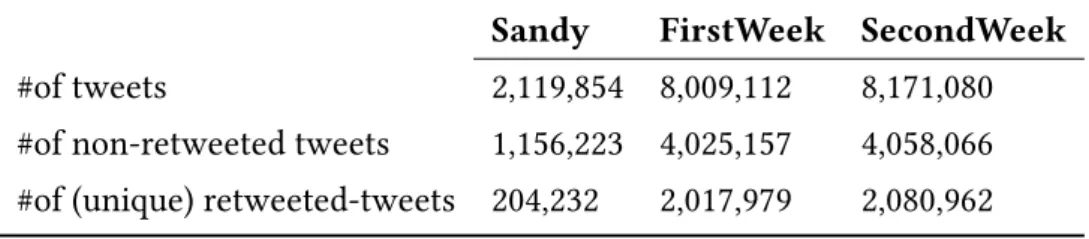
2.1 Features used to predict retweet rate of a given tweet. . . 32 2.2 The number of tweets and their distribution on the Sandy,
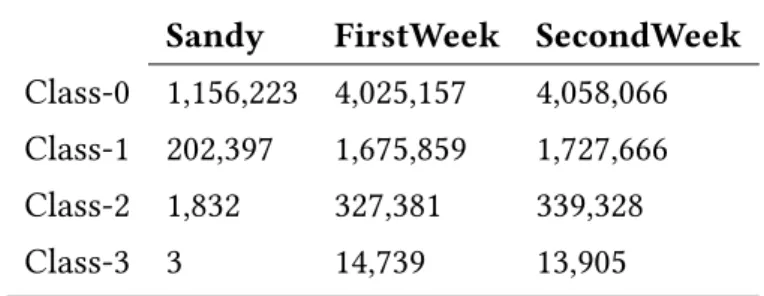
FirstWeek and SecondWeek datasets used to evaluate our predictive model. . . 39 2.3 Classes distribution of Sandy, FirstWeek and SecondWeek
datasets used for muti-class classification. . . 41 2.4 F-measure of the binary classification using Random Forest
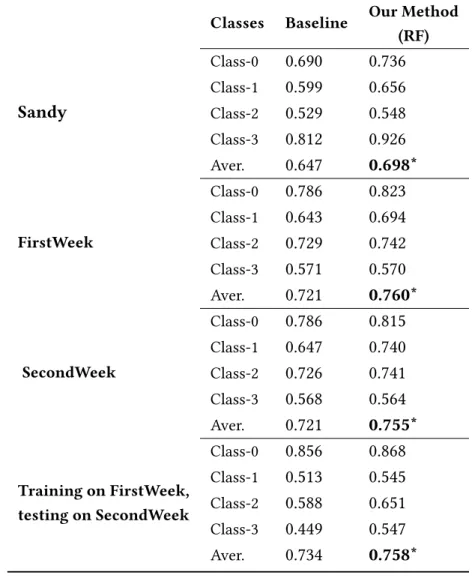
on three datasets. . . 43 2.5 F-measure of the multi-class classification using Random
For-est on the three datasets. . . 44 2.6 The number of tweets and their distribution for the IPhone,
Galaxy and Gucci datasets used to evaluate our predictive model. . . 57 2.7 Classes distribution of the three datasets used for multi-class
classification. . . 57 2.8 F-measure of the binary classification using different machine
learning models on the IPhone, Galaxy and Gucci datasets. . 58 2.9 F-measure of the multi-class classification using Random
For-est on the three datasets. . . 62 2.10 The number of tweets and their distribution on three datasets. 65 2.11 Classes distribution of three datasets used for muti-class
clas-sification. . . 65 2.12 F-measure of the binary classification using Random Forest
on the @Samsung dataset. . . 66 2.13 F-measure of the multi-class classification using Random
For-est on the three datasets. . . 66
3.1 Some features of the Ritter and MSM2013 datasets used to evaluate our location extraction and prediction models. . . . 81 3.2 Effectiveness when combining extraction models: Ritter, Gate,
Stanford, and filtering with DBPedia. . . 82 3.3 Effectiveness of combining location extraction tools on
Re-call, Precision, F-measure in tweets containing locations from the Ritter and MSM2013 datasets. . . 84
3.4 Features used to predict location occurrence in a tweet and examples of corresponding tweets. . . 89
3.5 Accuracy, TP, FP, and F-measure for TCL when optimizing eitheraccuracy or TP - 10-fold cross validation when using NB and RF for both collections. . . 93
3.6 Description of data used for training and testing. . . 95
3.7 Effectiveness of the Ritter algorithm for the Ritter and MSM2013 data collections in terms of Recall, Precision, F-measure. . . 95
3.8 Accuracy, TP, FP, and F-measure for TCL when optimizing eitheraccuracy or TP when using features: vectors inferred from the Doc2Vec model trained on the English Wikipedia collection, mean, max, min and standard deviation of these inferred vectors. . . 99
3.9 Accuracy, TP, FP, and the F-measure for TCL when optimiz-ing either accuracy or TP when using features: vectors in-ferred from the Doc2Vec model trained on the English Wikipedia collection, mean, max, min and standard deviation of these inferred vectors plus 10 features mentioned in Table 3.4. . . 100
3.10 Accuracy, TP, FP, and the F-measure for TCL when optimiz-ing either accuracy or TP when using features: vectors in-ferred from the Doc2Vec model trained on the CLEF festival collection, mean, max, min and standard deviation of these inferred vectors. . . 101
3.11 Accuracy, TP, FP, and the F-measure for TCL when optimiz-ing either accuracy or TP when using features: vectors in-ferred from the Doc2Vec model trained on the CLEF festival collection, mean, max, min and standard deviation of these inferred vectors plus 10 features mentioned in Table 3.4. . . 102
3.12 Accuracy, TP, FP, and the F-measure for TCL when opti-mizing either accuracy or TP when using features: vectors inferred from the Doc2Vec model trained on the 1Ptweets dataset, mean, max, min and standard deviation of these in-ferred vectors. . . 103
List of Tables ix 3.13 Accuracy , TP, FP, and the F-measure for TCL when
opti-mizing either accuracy or TP when using features: vectors inferred from the Doc2Vec model trained on the 1Ptweets, mean, max, min and standard deviation of these inferred vec-tors plus 10 features mentioned in Table 3.4. . . 104
List of Abbreviations
CRF Conditional Random Fields Doc2vec Document to Vector FP False Positive
Id Unique Identifier
LIW Location Indicative Words NB Naive Bayes
NE Named Entities
NER Named Entity Recognition POS Part Of Speech
RDF Resource Description Framework RF Random Forest
SGD Stochastic Gradient Descent SVM Support Vector Machine
Acknowledgement
First and foremost, I would like to express my sincere gratitude to my su-pervisor, professor Josiane Mothe. I highly appreciate all her contributions of time, dedicated help, advices, inspiration, encouragement and continuous supports to make my Ph.D experience productive and stimulating.
I also would like to thank professors Jacques Savoy and Alan Smeaton for accepting to review my thesis and for their valuable remarks.
My sincere thanks also goes to my friends and colleagues: Gia Hung Nguyen, Mahdi Washaha, Mahmoud Qudseya, Md Zia Ullah, Clement Leje-une and other lab mates for the stimulating discussions, precious supports and for all the funs we have had in the last three years.
A special mention of thanks to my best friend Giang, to Tran, Phuong, Trang, Hoai, Trinh and other friends in my hometown for their support and encouragement when I was stressful or in trouble.
Lastly, I would like to send a special thank to my parents and my brother for their unconditional love, constant inspiration and encouragement. Espe-cially, words cannot express my gratefulness to my beloved husband, Long, for his great love, patience and tremendous support. Without him, I would not have been able to complete much of what I have done. Finally, I am thankful to my son, Tri, for giving me happiness, motivation and strength during my PhD and my life.
Abstract
The popularity of online social networks has rapidly increased over the last decade. According to Statista1, approximated 2 billion users used social net-works in January 2018 and this number is still expected to grow.While serv-ing its primary purpose of connectserv-ing people, social networks also play a ma-jor role in successfully connecting marketers with customers, famous peo-ple with their supporters, need-help peopeo-ple with willing-help peopeo-ple. The success of online social networks mainly relies on the information the mes-sages carry as well as the spread speed in social networks. Our research aims at modeling the message diffusion, extracting and representing information and knowledge from messages on social networks.
Our first contribution is a model to predict the information diffusion on social networks. More precisely, we predict whether a tweet is going to be diffused or not and the diffusion level. Our model is based on three types of features: user-based, time-based and content-based features. Being eval-uated on various collections corresponding to dozen millions of tweets, our model significantly improves the effectiveness (F-measure) compared to the state-of-the-art, both when predicting if a tweet is going to be retweeted or not, and when predicting the level of retweet.
The second contribution of this thesis is to provide an approach to extract information from microblogs. While a message about an event is generally composed of several pieces of important information such as location, time, related entities, we focus on location which is vital for several applications, especially geo-spatial applications and applications linked to events. We pro-posed different combinations of various existing methods to extract locations in tweets targeting either recall-oriented or precision-oriented applications. We also defined a model to predict whether a tweet contains a location or not. We showed that the precision of location extraction tools on the tweets we predict to contain a location is significantly improved as compared to when extracted from all the tweets.
Our last contribution presents a knowledge base that better represents information from a set of tweets on events. We combined a tweet collection with other Internet resources to build a domain ontology. The knowledge
1
https://www.statista.com/statistics/272014/global-social-networks-ranked-by-number-of-users/(accessed February 7, 2018)
base aims at bringing users a complete picture of events referenced in the tweet collection (we considered the CLEF 2016 festival tweet collection).
Résumé long en français
Diffusion d’information, extraction d’information et de connaissance sans les réseaux sociaux
Les réseaux sociaux en ligne se sont rapidement développés au cours de la dernière décennie. Selon Statista2, environ 2 milliards d’utilisateurs ont utilisé les réseaux sociaux en janvier 2018 et ce nombre devrait encore aug-menter au cours des prochaines années. Selon une autre source3, le service Twitter comptait en moyenne 330 millions d’utilisateurs actifs par mois avec environ 500 millions de tweets par jour en janvier 2018. En outre, Twitter a toujours été cité comme l’un des réseaux sociaux les plus populaires pour les adolescents aux États-Unis et prend de plus en plus d’importance lors des événements dans le monde entier.
Tout en servant son but premier de connecter les gens, les réseaux soci-aux jouent également un rôle majeur dans le succès de connecter les spécial-istes du marketing avec les clients, les gens célèbres avec leurs fans, ceux qui ont besoin d’aide et ceux qui veulent aider. Le succès des réseaux sociaux en ligne repose principalement sur l’information que les messages véhicu-lent ainsi que sur la vitesse de propagation dans les réseaux sociaux. Notre recherche vise à modéliser la diffusion des messages, à extraire et à représen-ter l’information et les connaissances des messages sur les réseaux sociaux.
La première contribution de cette thèse est d’introduire une approche pour prédire la diffusion de l’information sur les réseaux sociaux. Plus pré-cisément, nous avons abordé deux questions de recherche:
1) Est-il possible de prédire si un message microblog (tweet) va être diffusé (retweeté) ou non?
2) Peut-on modéliser le niveau de diffusion et ainsi prédire le niveau de diffusion d’un nouveau message microblog?
Nous avons répondu à ces questions de recherche en considérant un mod-èle entraîné sur un sous-ensemble de tweets et en testant sur de nouveaux tweets. Nous avons étudié ce problème selon deux angles: une classifica-tion binaire (prédire si un tweet sera retweeté) et une classificaclassifica-tion multi-classe (prédire le niveau des retweets). Tout en réutilisant certaines
carac-2
https://www.statista.com/statistics/272014/global-social-networks-ranked-by-number-of-users/
3
téristiques pour représenter les messages issues de la littérature, nous avons ajouté plusieurs nouvelles caractéristiques, que nous avons regroupées en trois catégories: basées sur l’utilisateur, basées sur le temps et basées sur le contenu. Nous avons montré que notre modèle améliore significativement la F-mesure d’environ 5% par rapport à l’état de l’art pour les deux types de pré-diction lorsqu’il est évalué sur différentes collections avec un total d’environ 18 millions de tweets. De plus, nous avons également obtenu une F-mesure élevée sur les tweets de classe 1 (tweets retweetés moins de 100 fois) et de classe 2 (tweets retweetés moins de 10 000 fois) qui contiennent la majorité des tweets de chaque collection et qui étaient difficiles à prédire dans les travaux de l’état de l’art.
Certaines caractéristiques sont plus importantes que d’autres dans les modèles obtenus. Nous avons extrait les caractéristiques les plus importantes pour les deux types de prédiction et de manière cohérente à travers les jeux de données. Ces caractéristiques sont : le nombre de suiveurs, le nombre de suivis et le nombre de groupes dont l’utilisateur est membre, le nombre de favoris que l’utilisateur a réalisé dans son histoire. De plus, les fonctions temporelles que nous avons développées pour vérifier si un tweet est posté à midi, le soir, le week-end ou pendant les vacances sont également fortement corrélées avec la possibilité de retweet. Ces caractéristiques sont nouvelles par rapport à celles que l’on trouve dans la littérature.
Pour évaluer si les nouvelles caractéristiques que nous avons définies dépendent des caractéristiques existantes, nous avons également analysé les corrélations entre les caractéristiques sur trois jeux de données. Nous avons montré que la plupart des caractéristiques sont indépendantes les unes des autres. Certaines des nouvelles caractéristiques que nous avons développées sont:
• Importantes pour le modèle
• Ne sont pas corrélées aux caractéristiques existantes.
Quelques caractéristiques qui son corrélées aux caractéristiques existantes ont généralement un faible poids lorsque l’on considère leur impact pour les modèles prédictifs. De plus, les résultats présentés montrent que la combi-naison des caractéristiques que nous avons définies et des caractéristiques existantes améliore significativement la performance du modèle prédictif.
Ce travail a été présenté dans un article accepté par la revie internationale "International Journal of Computational Sciences" [Hoang 2017b].
Résumé 7 Comme une application du modèle prédictif proposé, nous avons ap-pliqué ce modèle pour prédire la diffusion des histoires de marque sur les réseaux sociaux. Nous avons ajouté plusieurs caractéristiques supplémen-taires et évalué notre modèle sur plusieurs types de collections associées à des actions de marketing : des collections d’histoires de produits ou de mar-ques (en termes de tweets) générées par les consommateurs et des collections d’histoires de produits ou de marques générées par la société qui possède le produit ou la marque. Les résultats des expériences concordent avec nos re-marques précédentes. Pour les deux types de collections, nous améliorons considérablement la F-mesure par rapport à l’état de l’art que ce soit dans le cas de la classification binaire ou de la classification multi-classe. Nous avons également classé les caractéristiques par l’ordre d’importance. Comme dans nos résultats précédents : le nombre de suivies, de suiveurs, de favoris de l’utilisateur et le nombre de groupes auxquels l’utilisateur appartient sont les caractéristiques les plus importantes pour faire retweeter un tweet sur une histoire de marque. De plus, la longueur du message, le fait qu’il conte-nienne un hashtag, une URL ou une image affectent également la retweet-abilité. L’âge du compte et le fait qu’une personne célèbre soit mentionnée dans le contenu d’un tweet à propos d’une marque ou d’un produit le rendra également plus retweeté lorsque ce tweet est écrit par la société qui possède la marque ou le produit.
Nous pensons que nos résultats sont utiles pour les gestionnaires d’entr-eprise afin qu’ils comprennent mieux la diffusion d’histoires liées à leur mar-que et à leur produits sur les réseaux sociaux. De plus, nous avons égale-ment proposé des caractéristiques qui pourraient être utilisées pour rendre un message populaire. En se basant sur ces caractéristiques proposées, les gestionnaires peuvent former des histoires en ligne pour diffuser leurs pro-duits ou leus marques. Ils peuvent également proposer des stratégies pour contrôler ou promouvoir les histoires générées par les clients. Notre modèle peut également être appliqué pour prédire la propagation de l’information dans d’autres domaines tels que la politique, les épidémies et les catastrophes. Nous n’avons pas évalué ces applications de notre modèle sur des collections de tweets appropriées, mais gardons cette piste de travail pour le futur.
Il y a des autres points qui pourraient être pris en considération à l’avenir. Les jeux de données que nous avons utilisés pour évaluer notre modèle pré-dictif ont été recueillis sur une période assez courte. Par exemple, le jeu de données de Sandy a été recueilli sur une période de trois jours, tandis que
les données de la première semaine et de la deuxième semaine ont été re-cueillies en une semaine. Il pourrait donc être intéressant d’analyser plus en détail l’impact du temps d’affichage du tweet sur la retweetabilité lorsque l’on considère des jeux de données recueillis sur des périodes plus longues. De plus, nous supposons également que certaines caractéristiques comme l’emplacement, les émissions de télévision mentionnées dans le contenu ou la réputation du nom d’utilisateur peuvent être plus importantes dans d’autres collections. Très peu de tweets contiennent de telles caractéristiques dans nos collections.
Pour les travaux futurs, nous aimerions mettre en œuvre certaines tâches. Tout d’abord, nous aimerions collecter des jeux de données plus importants qui incluent plusieurs tweets couvrant des caractéristiques que nous avons proposées telles que la présence d’entités nommées dans le contenu, la répu-tation de l’utilisateur et des temps de publication plus variés.
Par ailleurs, nous aimerions définir des caractéristiques supplémentaires pour représenter les tweets. Par exemple, nous pourrions considérer les vecteurs de type Doc-2vec [Le 2014] formé sur un jeu de données. Nous utiliserions alors ces vecteurs comme de nouvelles caractéristiques dans notre modèle. Notre hypothèse est que si les vecteurs Doc2Vec sont appris à partir des sujets, des événements et des histoires d’un grand ensemble d’information, il serait possible de déduire de "bons" vecteurs pour l’ensemble de tests et cela pourrait conduire à une amélioration de la classification.
L’analyse de sentiment d’un tweet est une des caractéristiques que nous pensions importante dans notre modèle mais cela n’a pas été confirmé dans les résultats de notre évaluation empiriqque. Une piste d’amélioration est d’appliquer des méthodes telles que celles proposée dans [Kummer 2012, Sahni 2017] pour améliorer l’efficacité de cette extraction de caractéristiques. Ces méthodes utilisent le z-score pour identifier les caractéristiques les plus saillantes appartenant aux catégories spécifiques et utilisent la subjectivité dans les tweet pour sélectionner les meilleurs tweets d’entraînement et ainsi augmenter la précision de la classification des sentiments.
Nous aimerions classifier un tweet en sujets tels que le sport, la musique, le cinéma, la mode, les nouvelles météorologiques quotidiennes ou les nou-velles technologiques avant de prédire la popularité de ce tweet. Nous pen-sons que les utilisateurs sont plus intéressés par certains sujets que par d’autres et que les modèles de diffusion dépendent des sujets. Enfin, une piste pour-rait être d’analyser l’influence d’un suiveur qui retweete un tweet sur un de
Résumé 9 ses amis.
Nous avons présenté ce travail dans un article qui a été accepté à la con-férence internationale "International Conference of Computational Linguis-tics and Intelligent Text Processing" 2018 [Hoang 2018b].
Il serait plus utile de prévoir la diffusion de l’information en tenant compte de l’aspect géographique. Par exemple, les spécialistes du marketing peu-vent se baser sur le niveau de diffusion de leurs histoires de marque par ré-gion pour proposer des campagnes de vente et de marketing appropriées pour chaque région. Les politiciens peuvent utiliser leur connaissance de la diffusion des nouvelles électorales par régions pour proposer des poli-tiques pertinentes pour leurs campagnes électorales. Ainsi, l’extraction des emplacements dans les tweets joue un rôle important dans la prédiction de la diffusion de l’information par région. En outre, bien que plusieurs élé-ments d’information importants comme le lieu, l’heure, les entités connexes soient inclus dans un message sur un événement, l’emplacement est vital pour plusieurs applications, surtout les applications géospatiales et les appli-cations liées aux événements [Goeuriot 2016a]. L’un des premiers éléments d’information transmis aux systèmes d’aide en cas de catastrophe est le lieu où la catastrophe s’est produite [Lingad 2013]. Un emplacement dans le texte d’un message de crise rend le message plus précieux que les autres qui ne contiennent pas un emplacement [Munro 2011]. Les utilisateurs de Twitter sont les plus susceptibles de transmettre des tweets avec des mises à jour sur l’emplacement et la situation, ce qui indique que les utilisateurs de Twitter eux-mêmes trouvent que l’emplacement est très important [Vieweg 2010].
Notre deuxième contribution dans cette thèse est de fournir une approche pour extraire efficacement la localisation dans les messages de Twitter.
Étant donné qu’il y a des applications qui nécessitent un rappel élevé (par exemple ce qui s’est produit à un endroit donné) et d’autres qui né-cessitent une grande précision (par exemple sur quels endroits devrions-nous devrions-nous concentrer en premier pour un problème donné), devrions-nous avons émis l’hypothèse que la combinaison des outils d’extraction existants pour-rait améliorer la précision de l’extraction des emplacements.
Nous en sommes donc arrivés à notre première question de recherche: 1) Dans quelle mesure pouvons-nous améliorer la précision et le rappel en com-binant les outils existants pour extraire les mentions de lieux des microblogs?
Pour répondre à cette question, nous avons combiné différents outils, à savoir l’outil Ritter [Ritter 2011], l’environement Gate NLP[Bontcheva 2013]
et l’outil NER Stanford [Finkel 2005]. Nous avons également proposé de fil-trer les emplacements extraits en utilisant DBpedia4.
Nous avons obtenu trois résultats importants:
• La combinaison des emplacements reconnus par l’outil Ritter avec les emplacements reconnus par Stanford filtrés par DBpedia augmente la F-mesure pour l’extraction des emplacements.
• La combinaison des emplacements extraits par Ritter avec les emplace-ments reconnus par Gate améliore considérablement le rappel. Nous avons obtenu un taux de rappel de 82% (pour le jeu de données Ritter), ce qui est très approprié pour les applications de rappel, tandis que le meilleur outil de cette collection, Ritter, atteint 71% de rappel. Ce ré-sultat peut s’expliquer par le fait que ces méthodes utilisent des indices différents pour extraire les emplacements des tweets.
• En utilisant DBPedia pour filtrer les emplacements que Ritter recon-naît, nous avons atteint une précision remarquable de 97% (pour le jeu de données Ritter). Ce résultat élevé a été obtenu parce que les noms de lieux imprécis et inconnus ont été écartés par le filtrage DBPedia.
Une quantité énorme de tweets sont postés chaque jour, mais très peu d’entre eux contiennent des emplacements. Par exemple, dans le jeu de données Rit-ter [RitRit-ter 2011], disponible à des fins de recherche et qui a été recueilli en septembre 2010, seulement 9 % environ des tweets contiennent un emplace-ment. De plus, nous avons réalisé une étude préliminaire en utilisant des out-ils d’extraction de localisation uniquement sur les tweets qui contiennent des localisations; nous avons obtenu une précision significativement plus élevée que lors de leur implémentation sur l’ensemble des jeux de données. Nous avons donc émis l’hypothèse que nous pourrions grandement augmenter la précision si nous pouvions prédire l’emplacement des occurrences dans les tweets. Cela nous amène à notre deuxième question de recherche pour cette deuxième contribution :
2) Est-il possible de prédire si un tweet contient un emplacement ou non? L’une des principales contributions de ce travail est une méthode perme-ttant de prédire si un tweet contient un emplacement ou non. Nous avons défini plusieurs nouvelles fonctions pour représenter les tweets et évalué
4
Résumé 11 intensivement les paramètres d’apprentissage automatique pour prédire les occurrences de localisation en variant les algorithmes d’apprentissage au-tomatique et les paramètres utilisés. Les résultats ont montré que:
• Random Forest et Naïve Bayes sont les meilleures solutions d’appren-tissage automatique pour ce problème - elles fonctionnent mieux que le Support Vector Machine (et d’autres algorithmes que nous avons essayés mais dont nous n’avaons pas rapporté les résultats car plus faibles).
• Le fait de modifier les critères d’optimisation (soit l’exactitude, soit le nombre de vrais positifs) ne modifie pas beaucoup la F-measure.
• En ce qui concerne l’extraction de localisation, nous avons amélioré la précision en nous concentrant uniquement sur les tweets dont on prévoit qu’ils contiennent une localisation.
Une autre contribution est que nous avons évalué les tweets à l’aide d’algorithmes de classification avec différents paramètres. Dans la section expérimentale, nous montrons que la précision des outils NER pour les tweets dans lesquels nous prévoyons qu’il est fait mention d’un emplacement est significativement améliorée: de 85% à 96% pour la collection Ritter et de 80% à 89% pour la collection MSM2013. Cette augmentation de la précision est sig-nificative et cruciale dans les systèmes où l’extraction de l’emplacement doit être très précise, comme les systèmes d’aide en cas de catastrophe et les sys-tèmes de sauvetage. Nous avons montré que la prédiction de l’emplacement est une étape de prétraitement utile pour l’extraction de l’emplacement.
Notre modèle donne une prédiction exacte pour les tweets qui contien-nent des mots du répertoire géographique ou qui incluent une préposition juste avant un nom propre. Nous avons également obtenu une bonne prédic-tion sur les tweets basés sur ‘nombre de noms propres’ ou ‘mots spécifiant des endroits juste après ou avant le nom propre’. Toutefois, dans certains cas, la prédiction n’est pas appropriée. Puisque nous n’avons considéré que les abréviations des lieux inclus dans le répertoire toponymique de l’outil "Gate", certains tweets ne sont pas prédits avec précision s’ils mentionnent des abréviations qui ne sont pas incluses dans le répertoire toponymique telles que: “‘@2kjdream Bonjour! Nous sommes ici JPN !" où JPN n’est pas reconnu. Nous n’avons pas non plus abordé la question de la désambiguï-sation des lieux. Pour les travaux futurs, afin de résoudre ce problème, le
contexte donné par tous les mots du message devrait être pris en compte [SanJuan 2012].
Dans le cadre de travaux futurs, nous aimerions également créer des jeux de données d’entrainement pertinents pour le modèle Doc2Vec afin de dé-duire les caractéristiques vectorielles représentant les tweets. Des jeux de données d’entrainement appropriés permettront de surmonter les limites de notre modèle, par exemple, de mieux gérer les abréviations et la désambiguï-sation. Les tweets qui contiennent des mots similaires au sujet des mêmes histoires ou événements devraient être représentés dans les vecteurs.
Nous prévoyons également d’extraire d’autres caractéristiques pour amél-iorer la précision de notre modèle prédictif. Certaines caractéristiques peu-vent être intéressantes à considérer comme l’apparition d’un nom de l’évén-ement dans le contenu (les gens mentionnent souvent l’emplacl’évén-ement avec l’événement dont ils parlent), les emplacements fréquemment vus dans les messages de l’historique d’un utilisateur et les messages de l’historique de ses amis.
Ce travail a été décrit et évalué dans deux articles acceptés par deux re-vues internationals: "International journal of Information Processing & Man-agement" [Hoang 2018c] et "International Journal of Computational Linguis-tics and Applications [Hoang 2018a]. Ce travail a également donné lieu à des présentations et publications dans plusieurs conférences internationales et nationales et ateliers [Hoang 2017a, Hoang 2018d, Hoang 2018e].
La troisième contribution de cette thèse porte sur la construction d’une base de connaissances qui représente de façon globale et intégrée l’information provenant d’un ensemble de tweets sur des événements.
Les médias sociaux comme Twitter sont largement utilisés lors d’un événe-ment (conférence, catastrophe, événeévéne-ment culturel...) pour commenter ou conseiller les acteurs liés à cet événement. Les utilisateurs des réseaux soci-aux sont alors avertis par l’intermédiaire des personnes qu’ils suivent ou en cherchant des tweets en rapport avec l’événement. Cependant, étant donné le format de 140 caractères5 d’un tweet, l’information obtenue par un seul message est souvent très partielle. Il est plus probable qu’un utilisateur ait plutôt besoin de lire un ensemble de tweets pour avoir une image claire d’un événement. Nous avons développé l’idée que l’utilisation d’un ensemble de tweets sur un événement pourrait permettre d’avoir une vue plus complète de cet événement en combinant toutes les informations partielles données
5
Résumé 13 en particulier par les tweets. La question de recherche à laquelle nous nous sommes intéressés est:
Est-il possible d’apporter à une personne une vue complète d’un événement en utilisant une base de connaissances?
Nous proposons un modèle qui représente une collection de micro-blogs sur une ontologie de domaine qui permet de mieux représenter l’information d’un ensemble de tweets sur des événements. Nous avons étudié le cas d’un festival. En combinant la collection de tweets existante sur des festivals avec d’autres ressources d’Internet, nous visons à donner une image complète du contenu de la collection qui peut donner un aperçu complet des événe-ments référencés dans cette collection. Ce modèle peut être appliqué dans des systèmes de recommandation dans les domaines du tourisme, du trans-port ou du marketing. Bien que nous ayons considéré une collection de fes-tivals, la méthode que nous proposons peut être adaptée à d’autres types d’événement.
En ce qui concerne l’ontologie du domaine, nous utilisons Wikipedia (ou plutôt DBPedia6) ainsi que des sites web qui fournissent des informations officielles sur la géographie, la liste des festivals et des détails connexes. Cette information est assez stable dans le temps. Ensuite, les tweets relat-ifs à chaque festival sont sélectionnés à l’aide de méthodes de recherche d’information. Ils sont analysés pour reconnaître et extraire les entités nom-mées (NE) telles que les lieux, les artistes, les noms de festivals, le temps. Ces informations extraites peuvent être utilisées pour remplir les instances des classes correspondantes dans l’ontologie.
Comme preuve de ce concept, nous avons combiné la collection de tweets de festivals [Goeuriot 2016a] avec d’autres ressources Internet pour constru-ire une ontologie du domaine. Cette ontologie vise à donner une image com-plète du contenu de la collection qui peut donner une vue d’ensemble des événements du festival référencés dans cette collection.
La base de connaissances que nous avons conçue pourrait être utilisée dans des applications où les utilisateurs:
• Choisiraient un nom de festival spécifique et auraient une image de ce festival sur les tweets
6
BDpedia structure les informations des pages de Wikipedia ; cette base peut être inter-rogée en utilisant SPARQL pour extraire des informations structurées
• Choisiraient un lieu et obtiendraient une liste des festivals correspon-dants, etc.
L’utilisateur recevrait des informations officielles provenant des sites web touristiques, accompagnées des informations les plus récentes provenant des tweets, telles que l’heure à laquelle le festival se déroule, les artistes qui se produisent et les dates auxquelles ils se produisent pour chaque festival. Les tweets liés à un festival apporteraient à l’utilisateur des nouvelles fraîches sur le trafic, la météo, l’atmosphère, les opinions et les commentaires des partic-ipants. De plus, les capacités d’inférence ontologique pourraient apporter de nouvelles connaissances à partir des données existantes.
Nous croyons qu’en utilisant une ontologie, nous avons fourni un sys-tème de base de connaissances facilement accessible. Par rapport au stock-age de données dans des bases de données traditionnelles, notre approche présente plusieurs avantages. Premièrement, les données sont présentées dans un langage commun qui peut être facilement récupéré par SPARQL. Un modèle de données RDF est également plus facile à mettre à jour sans effets négatifs sur l’application et nécessite donc moins de maintenance. Deux-ièmement, le mécanisme d’inférence du langage ontologique permet d’inférer facilement de nouvelles connaissances à partir de données existantes (dans la preuve de concept, nous programmons l’inférence, mais l’ontologie permet un tel processus). Enfin, en combinant plusieurs ressources telles que DBPe-dia, des sites web et Twitter, notre système pourrait apporter une connais-sance complète et fraîche des festivals par villes dans le monde, y compris les informations officielles des sites web et les dernières nouvelles de Twitters.
Nous supposons que notre modèle de base de connaissances a un large éventail d’applications dans plusieurs domaines tels que le tourisme, le trans-port, le marketing et la publicité. Par exemple, dans le domaine du tourisme, cette base de connaissances peut être utilisée pour construire un système de recommandation graphique avec des résumés très informatifs sur les événe-ments, les personnes célèbres, les activités connexes agrégées à partir de tweets.Dans le domaine du transport, un système développé sur notre mod-èle qui suggérerait un itinéraire ou un moyen de transport approprié pour éviter les foules, les embouteillages ou autres problèmes pourrait être bien accueilli par les voyageurs.
Pour les travaux futurs, nous aimerions évaluer notre modèle à partir d’un ensemble de données réelles et volumineuses. En outre, nous souhaitons également extraire de BDpedia des résumés courts sur les festivals ou des
Résumé 15 techniques de réutilisation comme celle présentée dans [Ermakova 2015] pour proposer aux utilisateurs une idée de base des festivals qui les intéressent. En outre, nous prévoyons de développer notre base de connaissances pour la recommandation d’événements en fonction de l’emplacement actuel de l’utilisateur et d’autres aspects tels que son profil, son intérêt et les festivals auxquels ses amis participent.
Ce travail a été présenté à la conférence internationale ’Conference and Labs of the Evaluation Forum CLEF’ 2016 [Hoang 2016a] et à une conférence nationale CORIA-RJCRI 2016 [Hoang 2016b].
Publications
The research reported in this thesis has resulted the following publications:
International journal papers
1. Thi Bich Ngoc Hoang and Josiane Mothe. Location extraction from tweets. Information Processing & Management 54.2 (2018): pp 129-144, Elsevier. Access:https://www.sciencedirect.com/science/
article/pii/S0306457317303734
2. Thi Bich Ngoc Hoang and Josiane Mothe. Predicting information dif-fusion on Twitter–Analysis of predictive features. Journal of Computa-tional Science , Elsevier (2017). Access:https://www.sciencedirect.
com/science/article/pii/S1877750317305860
3. Thi Bich Ngoc Hoang, Véronique Moriceau and Josiane Mothe. Can we Predict Locations in Tweets? A Machine Learning Approach. In-ternational Journal of Computational Linguistics and Applications (ac-cepted), 2018.
International conference papers and presentations
1. Thi Bich Ngoc Hoang, Josiane Mothe, Predicting the diffusion of brand’s stories in social networks (regular paper). In : Computational Linguis-tics and Intelligent Text Processing, Hanoi, Vietnam, 18-24 March 2018, Springer LNCS.
2. Thi Bich Ngoc Hoang, Josiane Mothe, Véronique Moriceau. Predict-ing Locations in Tweets (poster). In : Computational LPredict-inguistics and Intelligent Text Processing, Budapest, Hungary, 17-23 April 2017.
3. Thi Bich Ngoc Hoang, Josiane Mothe. Building a Knowledge Base using Microblogs: the Case of Cultural MicroBlog Contextualization Collection (regular paper). In : Conference and Labs of the Evaluation forum (CLEF 2016), Evora, Portugal, 05-08 September 2016. Access:
National conference papers and presentations
1. Thi Bich Ngoc Hoang, Josiane Mothe. Méthode d’apprentissage pour extraire les localisations dans les MicroBlog. In : EGC - Atelier Ex-traction et Gestion Parallèles Distribuées des Connaissances (poster), Paris, 22-26 January 2018.
2. Thi Bich Ngoc Hoang, Josiane Mothe. Extraction de Localisations dans les MicroBlogs. In : GAST - Gestion et l’Analyse de données Spatiales et Temporelles, Paris, 23 January 2018. Access: https://gt-gast.
irisa.fr/files/2018/01/ActesGAST2018-1.pdf
3. Thi Bich Ngoc Hoang, Josiane Mothe. Building a knowledge base using MicroBlogs: the case of festivals and location-based events (regular paper). In : Rencontres Jeunes Chercheurs en Recherche d’Information (RJCRI 2016), Toulouse, 09-11 March 2016. Access: https://www.
Chapter 1
Introduction
The online social networks has rapidly increased over the last decade. Ac-cording to Statista 1, approximated 2 billion users used social networks in January 2018 and this number is still expected to grow in the next years. While serving its primary purpose of connecting people, social networks also plays a major role in successfully connecting marketers with customers, fa-mous people with their supporters, need-help people with willing-help peo-ple. The success of online social networks mainly relies on the information the messages carry as well as the spread speed in social networks. Our re-search aims at modeling the message diffusion, extracting and representing information and knowledge from messages on social networks.
The first contribution of this thesis is to introduce an approach to pre-dict the diffusion of information on social networks. More precisely, we ad-dressed two research questions:1) Is it possible to predict whether a microblog post (tweet) is going to be diffused (retweeted) or not? and 2) Can the level of diffusion be modeled and thus can we predict the level of the diffusion of a new microblog post?
We answered these research questions by considering a model that we trained on a subset of tweets and test on new tweets. Our model uses three types of features: user-based, time-based and content-based features. We showed that our model significantly improves the F-measure by about 5% (statistically significant – using Student t-test, p-value < 0.05) compared to the state-of-the-art when evaluated on various collections corresponding to dozen millions of tweets. We also showed that some features we introduced are very important to predict the retweetability. This work was presented in a paper accepted by the international Journal of Computational Sciences [Hoang 2017b]. In addition, we applied this predictive model to predict the diffusion of brand stories in social networks. We added several additional features and evaluated our model on multiple ‘marketing’ collections. The
1
https://www.statista.com/statistics/272014/global-social-networks-ranked-by-number-of-users/(accessed February 7, 2018)
results showed that our approach is more effective than the state-of-the-art. We presented this work in a paper which was accepted to present in the international Conference of Computational Linguistics and Intelligent Text Processing 2018 [Hoang 2018b].
The second contribution of this thesis is to provide an approach to ex-tract information in Twitter posts. While several pieces of important infor-mation included in a message about an event such as location, time, related entities, we focus on extracting location which is vital to several applica-tions, especially geo-spatial applications and applications linked with events [Goeuriot 2016a]. One of the first pieces of information transmitted to disas-ter support systems is where the disasdisas-ter has occurred [Lingad 2013] and a location within the text of a crisis message makes the message more valuable than the others that do not contain a location [Munro 2011]. Our work first answered to the following research question: 1) How much can we improve precision and recall by combining existing tools to extract the location from mi-croblog posts? We have proposed several combinations of different existing methods to extract locations in tweets. We showed which combinations are effective for either recall-oriented or precision-oriented applications.
Originating from the fact that there is a huge amount of messages posted daily, but only a very small proportion contains locations, we hypothesized that predicting whether a post contains a location or not, prior to extracting locations, could make the efficiency improved. Indeed, in the Ritter dataset [Ritter 2011], available for research purposes, which was collected during September 2010, only about 9% of the tweets contain a location. This leads us to our second research question for this second contribution:2) Is it possible to predict whether a tweet contains a location or not? To answer this question, we defined a number of features to represent tweets and use these features as location predictors. We showed that the precision of location extraction tools for the tweets that we predict to contain a location is significantly im-proved: 11% and 9% (statistically significant) when evaluating our model on two tweet collections. The increase of precision is meaningful and crucial in systems where the location extraction needs to be very precise such as disaster supporting systems and rescue systems.
Our approach was described and evaluated in one paper accepted by the international journal of Information Processing & Management [Hoang 2018c], one other paper accepted by International Journal of Computational Linguis-tics and Applications [Hoang 2018a] and presented in several international
21 and national conferences, workshops [Hoang 2017a, Hoang 2018d, Hoang 2018e].
The third contribution of this thesis investigated the building of a knowl-edge base that better represents information from a set of tweets on events. Social media are widely used during an event to collaboratively comment or advise on that event. Given the size of a tweet, the information obtained by single post is often very partial. A research question is formed as follow: Is it possible to bring a person a complete view about an event using a knowledge base?
We developed the idea that using a set of tweets about an event could enable having a more complete view of that event by combining all informa-tion posted. As a proof of concept, we combined the festival tweet collecinforma-tion [Goeuriot 2016a] with other Internet resources to build a domain ontology. This ontology aims at bringing a complete picture of the collection content that can make a complete view of festival events referenced in this collec-tion. This work was presented in an international conference CLEF 2016 [Hoang 2016a] and in a national conference RJCRI 2016 [Hoang 2016b].
To develop these three main contributions of our work, this thesis is or-ganized into 5 chapters. The content of each chapter is described as follows:
Chapter 1 is this introduction in which the research questions and main contributions have also been presented.
Chapter 2 presents our model of predicting the information diffusion on social networks. Firstly, we describe the features that represents tweets. Afterward, we detail the experiments and evaluation of our model on various collections. We also present the application of our model on predicting the diffusion of brand stories on social networks.
Chapter 3 introduces an approach for extracting locations from tweets. We first present results when combining several named entities extraction tools to extract locations from tweets, targeting either precision-oriented or recall-oriented results. Subsequently, a model for predicting whether a tweet contains a location or not is proposed. The results of location extraction on predicted tweets are detailed.
Chapter 4 proposes a model to represent the collection of microblogs into a knowledge base. The domain ontology and the way to populate this ontology are presented. Finally, we describe how the knowledge base could be used to provide a complete view of an even.
Chapter 5 concludes this thesis, discusses main contributions of our work and outlines some future work.
Chapter 2
Information Diffusion on Social
Networks
Summary
2.1 Introduction . . . 24 2.2 Related work . . . 27 2.3 Predicting information diffusion on microblogs . . . . 30 2.3.1 Tweet representation . . . 30 2.3.1.1 User-based features . . . 31 2.3.1.2 Time-based features . . . 35 2.3.1.3 Content-based features . . . 36 2.3.2 Processing time . . . 38 2.3.3 Machine learning model . . . 38 2.3.4 Data and evaluation framework . . . 39 2.3.5 Experiments and results . . . 41 2.3.5.1 Binary classification . . . 41 2.3.5.2 Multi-class classification . . . 44 2.3.6 Most important features. . . 47 2.3.6.1 Binary classification . . . 47 2.3.6.2 Multi-class classification . . . 48 2.3.7 Correlations between features . . . 49 2.4 Predicting the diffusion of brand stories on microblogs 53 2.4.1 Tweet representation . . . 55 2.4.2 Machine learning model . . . 56 2.4.3 Data and evaluation framework . . . 56 2.4.4 Experiments and results . . . 58 2.4.4.1 Binary classification . . . 58 2.4.4.2 Multi-class classification . . . 61 2.4.5 Further experiments on datasets collected from
2.5 Discussions and conclusions . . . 68
Information propagation on online social networks focuses much at-tention in various domains such as varied as politics, disasters, or marketing. Modeling information diffusion in such growing com-munication media is crucial in order both to understand information propagation and to better control it. Our work aims at predicting whether a tweet is going to be forwarded or not. Moreover, we aim at predicting how much it is going to be diffused. Our model is based on three types of features: user-based, time-based and content-based. Evaluating our model on vaious collections corresponding to about 18 millions of tweets, we show that our model significantly improves the F-measure by about 5% compared to the state-of-the-art (statisti-cally significant – using Student t-test, p-value < 0.05). Some features from the literature are confirmed to be important such as the num-ber of followers and followees of a user. We also show that some features we introduced are very important to predict retweetability such as the number of groups that a user is a member of, the posting time of a tweet. In the last part of this chapter, we apply our model to predict the diffusion of brand stories on social networks and show that the results are consistent with previous findings.
Abstract.
2.1
Introduction
On-line social networks are more and more popular as information channels. For example, Statista1 reports 2.2 billion monthly active FaceBook users in the fourth quarter of 2017. In another source2, the monthly active Twitter users has been dramatically increased from 2010 to 2017 (see Figure 2.1). The Twitter service averaged at 330 million monthly active users with about 500 million tweets per day in the third quarter of 2017. In addition, Twitter
1
https://www.statista.com/statistics/264810/number-of-monthly-active-facebook-users-worldwide/
2
2.1. Introduction 25 has consistently been named as one of the most popular social networks for teenagers in the United States and is becoming increasingly prominent during events over the world.
Figure 2.1: The number of monthly active Twitter users worldwide from the 1st quarter 2010 to the 3rd quarter 2017.
Source: https://www.statista.com/statistics/282087/number-of-monthly-active-twitter-users/
While serving its primary purpose of connecting people, social networks also play a major role in successfully connecting marketers with customers, famous people with their supporters, help-needed people with help-willing people and information-sharing people with information-searching people. Many people and organizations use Twitter as a way to share and spread their messages. As shown in Figure 2.2, Barack get 179,000 retweets for his words about new year while supporters of Selena forward her movie adver-tisement post 16,000 times. In Houston devastation, Penn State was success-fully in asking 1.2 millions of people to retweet the post to help victims of devastation in Houston.
Modeling information diffusion in such growing communication media is crucial in order both to understand information propagation and to better control it. Indeed, some studies have investigated the impact of social media in the recent elections both in US or in France, focusing mostly on fake news
Figure 2.2: The retweet number of some tweet examples.
and their propagation on social media. The authors in [Allcott 2017] have collected 115 pro-Trump fake stories shared on Facebook for a total of 30 millions times while 41 pro-Clinton fake stories were shared a total of 7.6 million times. Since a high percent of voters use social media (35% of people 18 to 29 years old, according to Pew Research Center3), the hug number of share make fake stories successfully reach voters.
This chapter provides an approach to predict the diffusion of messages on social networks, specifically on Twitter. More precisely, we studied two related questions: (1) Is it possible to predict whether a post (a tweet) is going to be propagated (or re-tweeted)? and (2) Can the level of propagation be modeled and thus can we predict the level of propagation of a new post? We answer these research questions by considering a model that we train on a subset of tweets and test on new tweets. Our model is based on three types of features: user-based, time-based and content-based. While some features are reused from previous work in the domain of tweet diffusion [Suh 2010], we also introduce new features and evaluate the added value
3
http://www.journalism.org/2016/02/04/the-2016-presidential-campaign-a-news-event-thats-hard-to-miss/
2.2. Related work 27 of these new features for both predicting whether a tweet is going to be retweeted or not and predicting the level of the propagation.
In the later part of this chapter, we apply our model to a specific area - Marketing. The emergence and growing of social media allows one sumer or company to communicate with thousands or millions other con-sumers. The consumer-generated stories or company-generated stories about a brand or a product can be widely propagated and as a consequence, can have a big impact on the marketplace and indirectly affect the success of the brand. Therefore, modeling the brand stories diffusion on social media is crucial for business managers in order both to understand the brand stories propagation and to better control it.
The remainder of this chapter is organized as follows: Section 2.2 presents the related work. Section 2.3 describes the model, features and the evaluation of the predictive model for predicting the information diffusion on Twitter. Section 2.4 present results of applying the proposed model to predict the brand stories on social networks. Section 2.5 is the conclusions and discus-sions.
2.2
Related work
Information diffusion have attracted a number of researchers’ attention in recent years. Several pieces of work have made efforts to study the prediction of information propagation on social networks.
Suhet al. [Suh 2010] identified a number of features that may correlate with the number of retweets of a given tweet. They evaluated the correlation considering a large-scale analysis on 74 million tweets. They showed that numbers of followers, numbers of followees, and ages of the account have a very strong relationship with the retweet number. The larger the number of the followers and followees of the sender is, the more likely his tweets get retweeted is. In addition, tweets posted by “senior users”, who registered more than 300 days before writing, get a higher number of retweets than the average. On the contrary, the presence of hashtag or URL in a tweet does not highly correlates with the number of retweets. The authors reported that 20.8% of retweets only contain hashtags while 28.4% of retweets con-tain URL. They also found that the number of past tweets has little or no relationship with the average number of daily tweets or with the retweet rate; the number of tweets that are favorited by users seem not to impact
the retweetability since only 8.7% of retweets are written by authors with more than 100 favorited items [Suh 2010]. In our work, we considered all the features proposed by Suhet al. including the presence of hashtags and URL in the tweet content, the number of followers, followees, number of tweets that the user has liked in his timeline, total of past tweets and ages of the user’s account [Suh 2010]. We also added several new features including user-based, time-based, and content-based features.
Kwaet al. [Kwak 2010] studied the relationship between the number of followers of a user and the number of retweets for his posts on a collection of 106 million tweets. The authors constructed retweet trees and examined tree temporal and spatial characteristics. They showed that people only retweets from a small number of people and only a subset of a user’s followers actu-ally retweet. In addition, users with less than 1,000 followers tend to have the same average number of retweets for their posts. Similarly, Remyet al. [Remy 2013] studied the correlation between the number of users’ followers and the capacity to spread their messages. They implemented their method on a Twitter dataset centered on the Japanese Earthquake and Tsunami in March 2011. Surprisingly, they showed that the impact of users with a lot of followers is not statistically greater than users with a few followers . In our model, we also took into account the relationship between the number of followers of a user and the retweetability of his or her tweets.
Honget al. [Hong 2011] addressed the problem of predicting the future retweet number of a given tweet. They formulated the task into binary clas-sification and multi-class clasclas-sification. For binary clasclas-sification, class-0 rep-resents for tweets that are not retweeted while class-1 includes tweets that are retweeted. For multi-class classification, the authors suggested 4 classes: class-0 (not retweet), class-1 (retweets less than 100), class-2 (retweets less than 10,000), and class-3 (retweets more than 10,000). They used logistic regression as a classifier considering the message content, meta data and structural properties of the users’ social graph features. However, in their paper, Hong et al. did not describe the features they used explicitly. They achieved 0.60 F-measure for binary classification (recall 0.44 and precision 0.99). With regard to multi-class classification, Hong et al. achieved good accuracy only for the smallest and largest categories: class-0 and class-3 but very low accuracy for the two other classes: 0.15 on 1 and 0.43 on class-2 [Hong class-2011].
2.2. Related work 29 evaluation section of our work (Section 2.3.5), we show that using Random forest as a machine learning algorithm and several new features we intro-duced, recall and F-measure can be improved for binary classification. We also improve the F-measure for class-1 and class-2 which are supposed to be more challenging classes since most of the tweets are in these two classes.
Huet al. [Hu 2016] proposed an approach for predicting the short-term popularity of viral topics based on time series forecasting. They used his-torical popularity data of a given topic and showed that the popularity is relatively changeable for burst topics and past popularity have an impact on future popularity for non-burst topics. Xionget al. [Xiong 2012] charac-terized information propagation on Twitter by considering the topic of the tweet. They proposed a propagation model with four possible states: sus-ceptible, contacted, infected and refractory. People who read a message but have not decided to forward it are in the contacted state. They may become infected or refractory, and these two states are stable. They supposed that users select the topic that they are most interested in and then retweet. The more topics a user participates in, the less the user will turn attention to a new topic. The authors also supposed the inhibition between topics is im-portant to user’s decision. As a result, by using more than 20,000 tweets to train the model, they found that individual decision mainly depends on the topic itself. In our work, we did not consider the topic of the tweet but in-stead we added several content features which users may use to enhance the tweet content such as checking if the tweet contains location name, company name, TV show, picture or video.
Other work related to the diffusion of information on social networks can be found in [Ren 2016, Zhang 2013, Yang 2010]. Yanget al. [Yang 2010] stud-ied the retweet process on social network. They first performed an analysis on a Twitter dataset. They found that almost 25.5% of the tweets posted by users are actually retweeted from their friends’ posts. Then, they proposed a semi-supervised framework on a factor graph model to predict Twitter user’s retweeting behaviors. The features of the users’ history preferences, messages content and information of the trace were considered but are not explicitly described in their paper. In the experiments, the authors reported F-measure of 0.33 on the prediction, outperforming the L1-regularized lo-gistic regression method. However their method did not outperformed the Support Vector Machine baseline in terms of recall. In a similar study, Zhang et al. [Zhang 2013] addressed the problem of how users’ behaviors are
fluenced by friends in their ego network. They first tested whether the in-fluence locality exists in the microblog network and whether it significantly influences user’s retweet behavior. They found that the fraction of active users (retweeted a message) with two active neighbors (followees who have retweeted the same message) is about double compared to the fraction of ac-tive users with only one acac-tive neighbors. They also showed that, although the probability a user retweets a message is positively correlated with the number of active neighbors, it is negatively correlated with the number of connected circles that are formed by those neighbors. We did not consider the influence of followers’ retweeting behavior on their friends in our work since the datasets we used do not contain any information of users’ follow-ers (except number of followfollow-ers); but this could be an interesting feature to improve our model in the future.
In our work, we re-used some main features that previous research has shown to be good indicators for retweetability. We also suggest several new features that use to evaluate for the task of predicting retweets.
2.3
Predicting information diffusion on microblogs
In this section, we present the model, features and evaluation of the modelfor predicting information diffusion on Twitter.
The model in itself is based on machine learning; with this respect it is similar to Hong’s, which used machine learning techniques to predict the popularity of messages as measured by the number of future retweets [Hong 2011] (see Section 2.2). Using machine learning implies that (1) each tweet is represented by a set of features (2) a training set is used in order to learn the model before the model is used on the test set or new tweets.
The process of our predictive model is described in the Figure 2.3.
2.3.1
Tweet representation
We hypothesized that both the tweet content and the user who writes it have an impact on tweet diffusion. To decide on possible useful features to represent tweets, we manually analyzed about 500 tweets from the Sandy collection [Tamine 2016]. The idea was to detect clues that could be useful to predicted retweet or/and the retweet rate. We also relied on large scale
2.3. Predicting information diffusion on microblogs 31
Figure 2.3: The process of our predictive model .
analytics of factors affecting retweetability [Suh 2010] to enrich the tweet representation.
Finally, in our model, tweets are represented by user-based, time-based and content-based. There are a total of 29 features. The features along with their short description are presented in Table 2.1.
Shu et al. mentioned that some features highly correlate with retweet rate such as the number of followers, number of followees, age of the user’s account while other features have slight impact only on this rate such as the presence of URL and hashtag. Moreover, the total number of past tweets and the number of tweets that are favorited by the user seem to have little or no relationship with the retweet number [Suh 2010]. We reused all these features in our model. Those features are marked with a+in Table 2.1 and in the rest of this chapter. The other features are features that we defined and correspond to one main contribution of the work reported in this chapter.
2.3.1.1 User-based features
We hypothesized that a person who highly interacts with other people will in turn receive corresponding attention. Thus we took into account the in-teraction between the user who sends the tweet and social networks. We first reused the features that are related to the retweet number mentioned in [Suh 2010]:
- Total_of_tweets+: the total tweets that the user has posted in his timeline
in the past.
- No_of_followers+: the number of followers this user currently has. - No_of_followees+: the number of other users that this user is following.
T able 2.1: Featur es use d to pr e dict r etw e et rate of a giv en tw e et. Featur es with a + corr esp ond to Suh et al. featur es [Suh 2010] while the other featur es corr esp ond to one imp ortant contribution of this w ork. Featur es Description Data T yp e User- base d 1. T otal_of_tw e ets + The total of past tw e ets that the user has p oste d in the time line #Numeric 2. No_of_follo w ers + The numb er of follo w ers this user curr ently has #Numeric 3. No_of_follo w e es + The numb er of other users that this user is follo wing #Numeric 4. A ge_of_account + The numb er of days since the user account has b e en cr eate d #Numeric 5. No_of_fav ourite + The numb er of tw e ets the user has like d in the timeline #Numeric 6. No_gr oups_user_b elongs The numb er of public gr oups that the user is a memb er of #Numeric 7. A v er_fav ou_p er_day The av erage of likes that the user has made p er day #Numeric 8. A v er_tw e ets_p er_day The av erage of tw e ets that the user has p oste d p er day #Numeric 9. User_name_len The length of the user’s name #Numeric Time- base d 10. Is_p oste d_at_hol The tw e et is cr eate d on public holiday Bo olean 11. Is_p oste d_at_no on The tw e et is cr eate d fr om 11.am-13.pm Bo olean 12. Is_p oste d_at_e v e The tw e et is cr eate d fr om 6.pm-9.pm Bo olean 13. Is_p oste d_at_w e e The tw e et is cr eate d at w e ekend Bo olean Continue on the ne xt page
2.3. Predicting information diffusion on microblogs 33 T able 2.1 Featur es use d to pr e dict retw e et rate of a giv en tw e et. Continue d fr om pr e vious page Featur es Description Data T yp e Content- base d 14. Contain_lo cation The tw e et contains a lo cation name Bo olean 15. Contain_org The tw e et contains an organization name Bo olean 16. Contain_tvsho w The tw e et contains a tele vision sho w name Bo olean 17. Sentiment_le v el The tw e et is classifie d into sentiment le v els {p ositiv e , negativ e , obje ctiv e} 18. Contain_vide o The tw e et contains a vide o Bo olean 19. Contain_pictur e The tw e et contains a pictur e Bo olean 20. Contain_upp er The tw e et contains upp er w or ds Bo olean 21. Contain_numb er The tw e et contains numb er Bo olean 22. Contain_e xcl The tw e et contains an e xclamation mark Bo olean 23. Contain_rt_term The tw e et contains ’RT’ term Bo olean 24. Con_user_mentione d The tw e et mentions a user name Bo olean 25. Contain_rt_sugges The tw e et contains one of the r etw e et suggestion term:P ls RT , please r etw e et, RT for .. Bo olean 26. Contain_URL + The tw e et contains an URL Bo olean Continue on the ne xt page
T able 2.1 Featur es use d to pr e dict retw e et rate of a giv en tw e et. Continue d fr om pr e vious page Featur es Description Data T yp e Content- base d 27. Contain_hashtag + The tw e et contains a hashtag Bo olean 28. Opt_length The length of the content is b etw e en 70 to 100 characters Bo olean 29. Len_of_te xt The length of the content #Numeric
2.3. Predicting information diffusion on microblogs 35 - Age_of_account+: the number of days since the user account has been
created until the day the tweet was collected.
- No_of_favourite+: the total number of tweets the user has liked in the time-line.
In addition, we added several new features:
- No_groups_user_belongs: the number of public groups or communities that the user is a member of.
- Aver_favou_per_day: Average number of likes that the user likes per day. This features is calculated by dividingNo_of_favourite by Age_of_account. - Aver_tweets_per_day: Average number of tweets that the user writes per day. This features is calculated by dividingTotal_of_tweets by Age_of_account. - User_name_len: the length of the user’s name.
All the features from this category are numeric values. These features are ex-tracted and calculated from the fields a tweet is composed of when collected using Twitter API4.
2.3.1.2 Time-based features
We hypothesized that a majority of retweets are written shortly after the tweet is posted and thus that a tweet posted in ‘free hours’ is more likely to receive more retweets. The time-base features that consider the time the tweet is generated, include:
- Is_posted_at_hol: we checked if the tweet is posted during holidays using the Holiday python library (https://pypi.python.org/pypi/holidays). We first considered the public holiday of the user’s location during the time of collecting the datasets (as available in subsection 2.3.4). If the user does not mention any location in her or his profile, we checked the tweet post-ing time with holidays of all 23 countries which is included in the Holiday python library such as United States, United Kingdom, Spain, Germany and others.
- Is_posted_at_noon: we checked whether the tweet is posted at noon from 11 a.m to 1p.m or not.
- Is_posted_at_eve: we checked whether the tweet is posted in the early evening from 5 p.m to 9 p.m or not.
- Is_posted_at_wee: we checked whether the tweet is posted at the weekend or not.
4