This is an author-deposited version published in: http://oatao.univ-toulouse.fr/
Eprints ID:5213
To link to this article: DOI: 10.2166/ws.2011.031 http://dx.doi.org/10.2166/ws.2011.031
To cite this version:Vialle, Claire and Sablayrolles, Caroline and Lovera, Maurin and Huau, Marie-Christine and Montrejaud-Vignoles, Mireille Modelling of a roof runoff harvesting system: The use of rainwater for toilet flushing. (2011) Water Science and Technology: Water Supply . pp. 151-158. ISSN 1606-9749㩷
makes it freely available over the web where possible.
Any correspondence concerning this service should be sent to the repository administrator: staff-oatao@inp-toulouse.fr㩷
Modelling of a roof runoff harvesting system: The use of rainwater for
toilet flushing
C. Vialle*, C. Sablayrolles*, M. Lovera**, M.-C. Huau***, M. Montréjaud-Vignoles*
* Université de Toulouse; INP; LCA (Laboratoire de Chimie Agro-Industrielle); ENSIACET, 4 Allée Emile Monso, F-31030 Toulouse, France
(E-mail : claire.vialle@ensiacet.fr)
* INRA; LCA (Laboratoire de Chimie Agro-Industrielle), F-31030 Toulouse, France
** Veolia Water North America, Technical Direction Group, 101, W Washington Street, Suite 1440 East, IN-46204 Indianapolis, USA
*** Veolia Eau, Direction des collectivités publiques, 36-38 avenue Kleber, F-75016 Paris, France
Abstract The water balance of a four-people family rainwater harvesting system was calculated in
a case study. The experimental water saving efficiency (WSE) was calculated as 87 %. A simple computer model was implemented to simulate the behaviour of the rainwater harvesting system. In general, the rainwater collector volumes predicted by the daily model had shown a good correlation with the experimental values. The difference between the experimental and the predicted values for the stored volume can be explained by the lack of maintenance of the system that can affect its performance. On the basis of a long-term simulation of 20-year rainfall data, the following parameters were calculated: rainfall, water demand, mains water, rainwater used, over-flow and WSE. The collection of rainwater from roofs, its storage and subsequent use for toilet flushing can save 42 m3 of potable water per year for the studied system. The model was also used to find the optimal size of the tank for the single-family household: a storage capacity of approximately 5 m3 was found to be appropriate. The storage capacity and tank size were distinguished. The importance to take into account the dead volume of the tank for the sizing was indeed highlighted.
Keywords modelling; rainwater collection; simulation; system efficiency; water saving efficiency
INTRODUCTION
At present, the availability of fresh water resource is one of the major issues the human race is facing due to world population increase, urbanisation, land use transformation, and pollution. Hence, the harmful consequences, such as health problems or social conflicts, could occur.
Thanks to the EU Water Framework Directive implemented to protect the aquatic environment, certain requirements have been set out involving potential use of rainwater harvesting. Rainwater harvesting has been a common practice worldwide for thousands of years (Pinfold et al., 1993; Simmons et al., 2001). The process consists in collecting and storing rainwater for the future use, such as toilet flushing, washing machines, garden watering, cleaning purposes, fire fighting, etc. The idea is to use collected roof runoff as a substitute for valuable drinking water. However, every European country has adopted a different perspective regarding the use of rainwater due to individual interpretations of the word “domestic” used in the European Directive 98/83/CE (European Official Journal, 1998).
Thus, in France, only external use (garden watering, cleaning, etc.) is allowed, except in special cases (drought, no mains network). Nevertheless, the rainwater harvesting devices were already available in the market, which according to suppliers accounted for 10,000 systems in 2007, out of which 67 were used in large buildings. Despite reluctance from the sanitary authorities (C.S.H.P.F, 2006), the increasing demand from private customers leveraged a reconsideration of rainwater
development at a large scale, French law has still forbidden the use of rainwater for drinking and bathing or clothes washing.
Now a question arises: Is the use of rainwater for toilet flushing perennial and financially viable at the scale of an individual household? On one hand, the system efficiency varies over the years depending, in particular, on rainwater. On the other hand, the cost of installation is relative to its storage capacity, which must also be optimal to satisfy the desired level of performance. Thus, the modelling of systems becomes necessary to simulate water flows. Results obtained by simulations will permit to assess the efficiency of the systems over years and to optimize the tank size. For rainwater harvesting, a number of models have been proposed (Dixon et al., 1999; Herrmann et Schmida, 1999; Vaes et Berlamont, 2001; Fewkes, 2004; Liu et al., 2007). Most of these models are not accessible to neophytes, or they were not validated with experimental data. In contrast, the proposed model, in this paper, to simulate the rainwater harvesting system is simple to implement and only consists of equations developed with a spreadsheet. In addition, this model was verified using data collected from an operational system.
In the present study, a commercially available rainwater collection system, installed in the south-west of France, was monitored over a period of one year. The inflows and outflows were determined from this operational system. Then, the collected data were used to validate a rainwater collection sizing model. Finally, this model was used to produce a continuous long-term simulation of the hydraulic performance of the rainwater usage system and to determine the optimal size of the tank.
PRESENTATION OF THE CASE STUDY
Description of the rainwater harvesting system and instrumentation
For the study, a commercially available domestic rainwater collection system was installed in a rural area of south west of France (Figure 1). The pilot house occupied by a family of two parents and two children is located in a village situated in country. The climate is oceanic with warm summer. Every year, it falls about 760 mm of rain in the region.
Rainwater is first collected from the 204 m2 surface area tiled roof. This water is then channelled via open zinc gutters and down pipes to a wire filter with a mesh before entering into an underground, 5 m3 capacity PEHD storage tank (Sotralentz Habitat), through a calm inlet. Any overflow is led into a nearby canal. A pumping system using a submerged (approximately 0.10 m) intake with an inlet filter attached to a float, then pumps water inside the house, through a treatment process composed of a 25 µm filter and an active carbon filter. When insufficient water is available in the tank, a probe activates a valve to allow pumping from a backup drinking water tank. Rainwater collected is available for toilet flushing and can supply two 9-L flush WCs.
The device also includes a rain gauge with tipping bucket and a pressure transducer to measure water tank level. A triangular weir and a flow meter were used to measure the volume evacuated via the overflow. Water meters were installed to measure the total volume delivered to the toilet flushing system and another to record the quantity of mains water supplied. A central processing unit monitored these parameters every 5 minutes or 15 minutes for the water meters.
Figure 1. Rainwater harvesting system
Pi is the rainfall level (mm), A is the roof area (m2), Cf is the roof runoff coefficient, Ti is the volume in storage (m3), Oi is the rainwater volume overflowed (m3), Mi is the mains water supply
(m3), Wi is the volume delivered to the toilet flushing system (m3). Experimental results
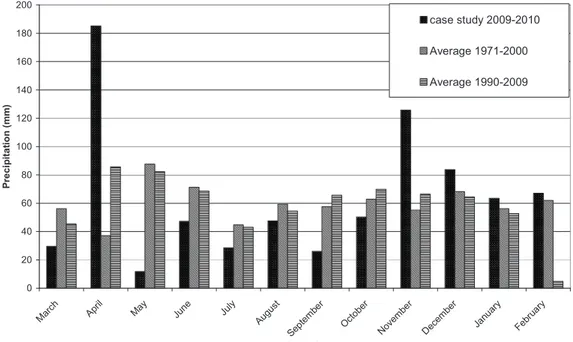
The quantitative monitoring of the rainwater harvesting system installed in a household in the south-west France was done from March 2009 to February 2010. This period corresponds to a rainfall of about 766 mm distributed among 174 days and 40 % of these rainy days presented precipitations inferior to 2 mm. The rainfall recorded at the test site is shown in Figure 2. The figure also shows the 30-year (1971-2000) averages of monthly rainfall data monitored at a station located approximately 40 km (Albi, Meteo France) away from the test site, and the average values for the 20-year period from 1990 to 2009.
0 20 40 60 80 100 120 140 160 180 200 Mar ch Apr il May June Ju ly Aug ust Sep tem ber Oct ober Nov embe r Dec embe r Janu ary Febr uary P re c ip it a ti o n ( m m ) case study 2009-2010 Average 1971-2000 Average 1990-2009
In this study, the daily WC flushing demand varies between 0 L and 309 L for the household with an annual average of 120 L, which corresponds to 30 L i.e. 3.3 flushes per day per inhabitant. This value is approximately 20 % of the average per person domestic water consumption (137 L per day) in France (C.I.Eau, 2010). The family, in this case study, was also a representative of a French household. In July, the WC usage in the test house was higher than expected due to a faulty ballcock, which resulted in the loss of almost 3 m3 of water in one day.
The water saving efficiency (WSE) is a measure of how much mains water has been conserved in comparison to the overall demand of the WC and is also given by dividing the used rainwater volume by the WC demand volume, as given in Equation 1.
Equation 1. WSE (%) 100 × − = t t t W M W WSE
Where Wt is the total volume delivered to the toilet flushing system during the studied period (m3), Mt is the mains water supplied (m3).
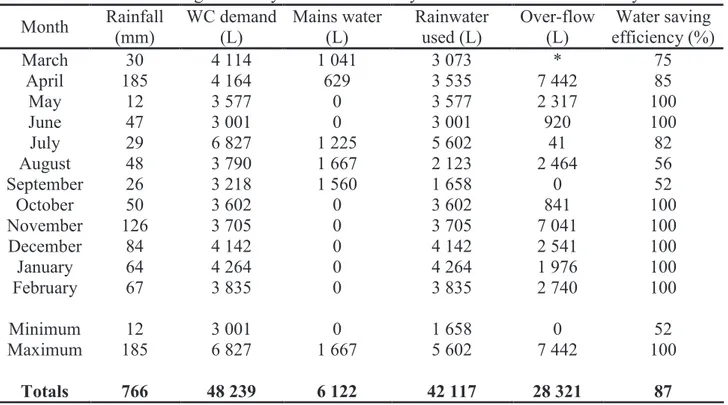
The results of the 12-month period are given in Table 1. Mains water supply was used for 53 days over the entire study period: 15 days in March-April, 5 days in July and 33 days from mid-August to the end of September. WSE ranges from 52 % in September to 100 %. A similar study in the UK was realised with a storage tank of 2.032 m3 and a house occupancy varying between three and five people. A monthly WSE ranging from 4 % to 100 % was obtained (Fewkes, 1999). Our study showed that 48 m3 of water was used for toilet flushing over the whole study period, of which 6 m3 was supplied from the mains network. As a result, 42 m3 of potable water was saved. The corresponding WSE of the system was 87 % for the toilet flushing.
Table 1. Water saving efficiency of the rainwater system for March 2009-February 2010 Month Rainfall (mm) WC demand (L) Mains water (L) Rainwater used (L) Over-flow (L) Water saving efficiency (%) March 30 4 114 1 041 3 073 * 75 April 185 4 164 629 3 535 7 442 85 May 12 3 577 0 3 577 2 317 100 June 47 3 001 0 3 001 920 100 July 29 6 827 1 225 5 602 41 82 August 48 3 790 1 667 2 123 2 464 56 September 26 3 218 1 560 1 658 0 52 October 50 3 602 0 3 602 841 100 November 126 3 705 0 3 705 7 041 100 December 84 4 142 0 4 142 2 541 100 January 64 4 264 0 4 264 1 976 100 February 67 3 835 0 3 835 2 740 100 Minimum 12 3 001 0 1 658 0 52 Maximum 185 6 827 1 667 5 602 7 442 100 Totals 766 48 239 6 122 42 117 28 321 87
Rainfall loss occurred from the system due to absorption by the roofing material, wind effects around the roof and gutter overflowing. The roof runoff coefficient (Cf) and overall efficiency (OE) of the system were evaluated using relationships given in Equation 2.
Equation 2. Roof runoff coefficient (Cf) and overall efficiency (OE) of the rainwater system A P Vc Cf t t × = −3 10 . with Vct =Wt −Mt +Ot A P Vu OE t t × = −3 10 . with Vut =Wt −Mt
Where, Pt is the total rainfall level during the study period (mm), A is the roof area (m2), Vct is the volume of rainwater counted (m3), Ot is the rainwater volume overflowed (m3), Vut is the volume of
rainwater used (m3), Wt is the total volume delivered to the toilet flushing system (m3), Mt is the mains water supply (m3).
From April 2009 to February 2010, the precipitation (Pt) multiplied by the roof area (A) resulted in 150 m3 of roof runoff, while the total volume counted (Vct) was 76 m3. The roof runoff coefficient (Cf) was thus evaluated to 0.51, which indicates a loss of approximately 50 % of the rainwater. This value is low for a tiled roof (Fewkes, 1999) and after verifications it was highlighted that the time step for overflow measuring was too long and it was checked on site that the overflow volume was under evaluated. A volume of rainwater used of 39 m3 corresponds to an overall efficiency (OE) of the system of 0.26. At the same time, it was highlighted a rain inferior to 2 mm did not generate a runoff.
In the rainwater harvesting system studied, the wire filter at the entrance of the tank is automatically rinsed once a week. Frequency of cleaning is independent of the weather. Thus, when a rain occurs just after the cleaning, a partial clogging can occur that will remain till the next week, which can affect the overall efficiency of the system. Indeed some overflows were registered, even when the tank was not full. In addition, when the mains water supply was used, 1 150 L of stored runoff remained in the tank, which corresponds to 20 % of the 5 000 L. It is also important to dissociate the commercial tank volume and the effective volume available for the storage.
MODELLING THE SYSTEM PERFORMANCE Description of the model
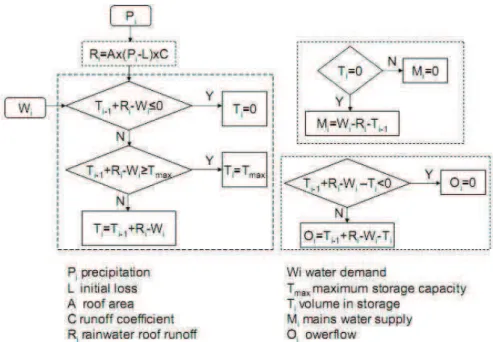
A computer model was developed in a spreadsheet to simulate the behaviour of a rainwater harvesting system. An initial loss (L) was considered. The information needed is the maximum volume of storage available (Tmax), the roof area and the runoff coefficient (C). The input data are precipitation (Pi) and water demand (Wi) based upon time interval of the day. Equations developed in the spreadsheet were used to simulate collection (Ri), storage (Ti), use of mains water (Mi) and over-flow (Oi) (Figure 3).
Figure 3. Flowchart for rainwater tank storage model Validation of the model with experimental data
The selected roof area was 204 m2, which corresponds to the area of the studied household. The volume available for the storage is 3.848 m3 because of the dead volume as explained before. The volume stored in tank was initialised with the experimental value. An initial loss of 2 mm was considered. Considering this loss, the runoff coefficient was evaluated to 0.71 when only precipitation superior to 2 mm were considered. The rainfall and WC usage data, collected during the 12-month monitoring period, were used as input into the model as daily time series.
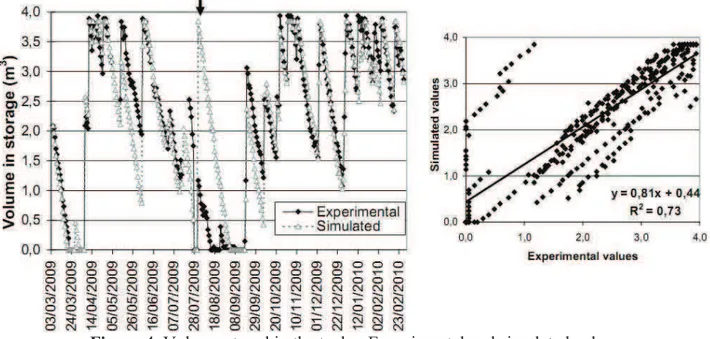
The simulation results were plotted against the corresponding values predicted for the stored volume (Figure 4). For stored volume, the regression y=0.81x+0.44 with R2 of 0.72 was observed. The overflow events and their volumes obtained through the simulation and on site are shown in Figure 5. A linear trendline y=1.26x+0.00 with a correlation coefficient R2 of 0.68 was observed. Some simulated stored volumes were lower than the experimental values. The too small experimental value of C can explain that.
Some overflow events measured on site are not included in the simulated results because of the clogging of the wire at the entrance of the tank. The most evident example of such events occurred on 1st August 2009 and is indicated by an arrow in Figures 4 and 5. As a result, the experimental stored volume was less than the simulated one.
In order to verify the above proposed explanation, experimental data were corrected: the volume overflowed on 1st August 2009 because of the clogging of the wire was erased and was considered to have been stored in the tank. New tank volumes calculated from the simulation were compared to the corrected experimental data (Figure 6). The regression obtained for the volume in storage was greatly improved with these corrections: y=1.03x-0.22 with R2 of 0.91. For the overflow volumes, the regression of simulated values against corrected experimental data was enhanced to y=1.40x+0.00 with R2 of 0.70.
Figure 4. Volume stored in the tank – Experimental and simulated values
The arrow highlights an overflow event that occurred when the tank was not full because of the clogging of the wire at the entrance of the tank.
Figure 5. Volume overflowed – Experimental and simulated values
The arrow highlights an overflow event that occurred when the tank was not full because of the clogging of the wire at the entrance of the tank.
Figure 6. Volume stored in the tank – Corrected experimental and simulated values Correction realised on the experimental data is shown by a vertical dotted line.
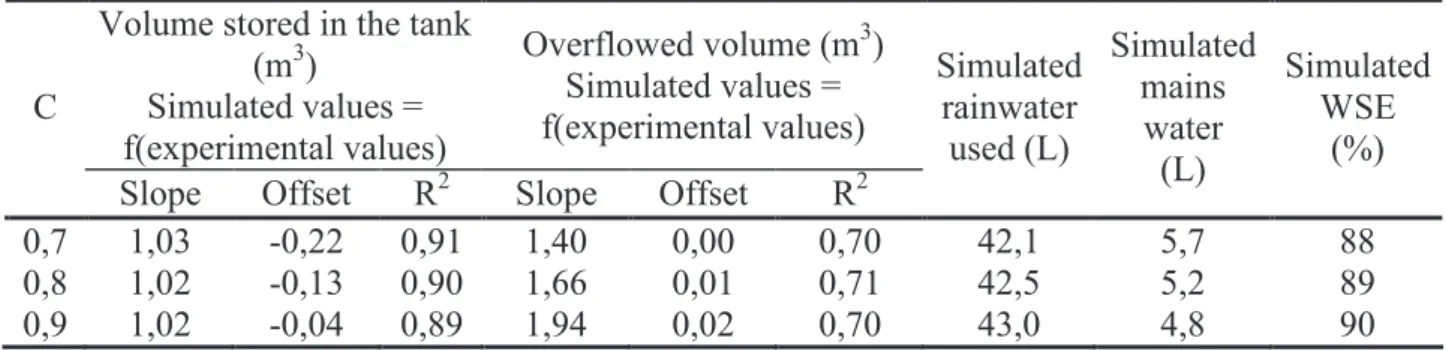
To evaluate the sensitivity of the model to this parameter, two other values of C were tested for the simulation. Results are presented in Table 2. C is not crucial for the simulation of the stored volume in this case. But considering the overflowed volume, the increase of C particularly affects the slope of the regression of simulated values against experimental values. Nevertheless results are coherent with the experimental observation that the overflowed volume was under evaluated because of the inappropriate time step of 5 minutes. This under evaluation resulted in a too low runoff coefficient evaluation. According to simulations, the WSE of the system is 88 - 90 %, which is near the experimental value of 87 %.
Table 2. Sensitivity of the model to the runoff coefficient Volume stored in the tank
(m3) Simulated values = f(experimental values) Overflowed volume (m3) Simulated values = f(experimental values) C
Slope Offset R2 Slope Offset R2
Simulated rainwater used (L) Simulated mains water (L) Simulated WSE (%) 0,7 1,03 -0,22 0,91 1,40 0,00 0,70 42,1 5,7 88 0,8 1,02 -0,13 0,90 1,66 0,01 0,71 42,5 5,2 89 0,9 1,02 -0,04 0,89 1,94 0,02 0,70 43,0 4,8 90 LONG-TERM SIMULATION Hypothesis
The model was used to simulate the system performance over twenty years. The same values were used for the roof area, the roof runoff coefficient and the available storage volume. Historical daily rainfall data measured in Albi (Meteo France, 40 km away from the study site) for the period 1990-2009 (Figure 2). According to another study (Fewkes et Butler, 2000), the use of daily data was appropriate. They indeed recommend using a daily data model for a storage fraction i.e. the storage
result, the water demand series obtained during the one year experiment was reproduced twenty times. The abnormal consumption due to the malfunctioning of the ball was replaced by the mean value of 120 L. The operation of the system was simulated for twenty years.
Results
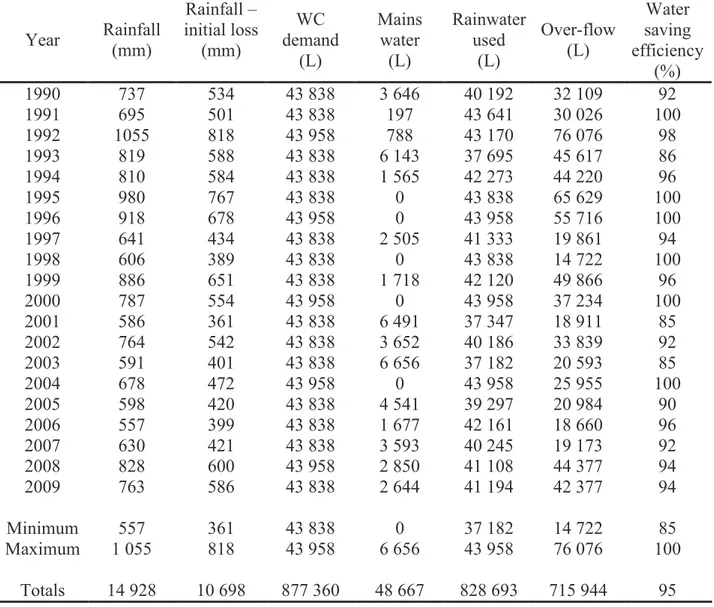
On the basis of a long-term simulation of 20-year rainfall data, the following parameters were calculated for each year: rainfall, WC demand, mains water, rainwater used, over-flow and WSE (Table 3). The annual WSE ranges from 85 to 100 %. A 20-year period simulation showed that 829 m3 of potable water can be saved for a single-family household that corresponds to an average of 42 m3 per year. Now the average domestic water consumption is 137 L per day per person in France (CIEau, 2010) which corresponds to 50 m3 per year per person. As a result rainwater use for toilet flushing permits to save around 21 % of domestic water consumption.
Table 3. Water saving efficiency of the rainwater system – 20 years simulation
Year Rainfall (mm) Rainfall – initial loss (mm) WC demand (L) Mains water (L) Rainwater used (L) Over-flow (L) Water saving efficiency (%) 1990 737 534 43 838 3 646 40 192 32 109 92 1991 695 501 43 838 197 43 641 30 026 100 1992 1055 818 43 958 788 43 170 76 076 98 1993 819 588 43 838 6 143 37 695 45 617 86 1994 810 584 43 838 1 565 42 273 44 220 96 1995 980 767 43 838 0 43 838 65 629 100 1996 918 678 43 958 0 43 958 55 716 100 1997 641 434 43 838 2 505 41 333 19 861 94 1998 606 389 43 838 0 43 838 14 722 100 1999 886 651 43 838 1 718 42 120 49 866 96 2000 787 554 43 958 0 43 958 37 234 100 2001 586 361 43 838 6 491 37 347 18 911 85 2002 764 542 43 838 3 652 40 186 33 839 92 2003 591 401 43 838 6 656 37 182 20 593 85 2004 678 472 43 958 0 43 958 25 955 100 2005 598 420 43 838 4 541 39 297 20 984 90 2006 557 399 43 838 1 677 42 161 18 660 96 2007 630 421 43 838 3 593 40 245 19 173 92 2008 828 600 43 958 2 850 41 108 44 377 94 2009 763 586 43 838 2 644 41 194 42 377 94 Minimum 557 361 43 838 0 37 182 14 722 85 Maximum 1 055 818 43 958 6 656 43 958 76 076 100 Totals 14 928 10 698 877 360 48 667 828 693 715 944 95
SIZING THE TANK
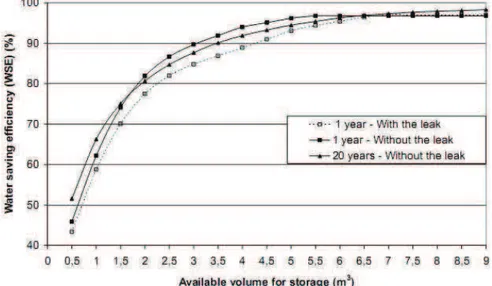
The theoretical WSE was calculated for different volumes of storage using the model. First time, the one-year experimental WC demand series was used. Second time, the impact of the unusual
increased the amount of water available for the use, to finally reach an asymptote (Figure 7). The optimal size is assumed to correspond to that tank size where further increase in size produced only a small increase in reliability. We considered the optimum was reached when the increase in WSE becomes inferior to one percent for a storage rise of 0.5 m3. With this criteria and according to the simulation, the maximum theoretical WSE of 97% can be achieved with a storage volume of 6,53 and 5 m3 if no leak is considered. The sizing was validated by the 20-year simulation results, which conduct to an optimal storage volume of around 5 m3.
In fact the storage volume of 5 m3 used in our case study was firstly selected because it is most widely used for a single-family household in France. Now our results confirm this sizing was quite optimal to satisfy the WC demand of the family. But as discussed previously, 20 % of the tank volume was dead volume and only 3.85 m3 was actually available for the storage.
It is also important to complete the possible mains water saving using rainwater by vigilance against leaks. To be optimal, the dimensioning of a tank for rainwater harvesting must take into consideration the volume remaining in the tank when the system transfers to mains water supply.
Figure 7. Optimization of rainwater tank size for a 4-people household with a 204 m2 tiled roof area
CONCLUSIONS
A rainwater collection system of a 4-people household with a 5 m3 tank was monitored over a twelve-month period. An average daily consumption of 30 L per person was established. Results indicate that 87 % of the WC flush was saved over a year. It was highlighted that 20 % of the tank were in fact not available for the storage. A simple model was developed in a spreadsheet to simulate water balance of the studied system. The calculated volumes were compared to the experimental data. The model produces acceptable results to predict the system performance. The noticed difference between the experimental and the predicted values highlights the importance of the maintenance. The clogging of the filter at the entrance of the tank can indeed affect the overall efficiency of the collection system. Experimental daily flushing demand and twenty years of historical daily rainfall data were used as input to the system simulation model. The results for the system efficiency clearly show that rainwater collection systems can significantly reduce the potable water consumption. Thus, an average saving of 42 m3 of water was determined. Finally, the model was used to find the optimal size of the tank. A volume available for the storage of 5 m3 was found to be appropriate for the single-family household. Nevertheless, it is important to distinguish the volume available for the storage from the commercial volume of the tank, which must be higher.
ACKNOWLEDGEMENT
The authors would like to thank the Sotralentz Habitat for their provision of rainwater-harvesting equipment and Camille Grandet (2EI, Veolia) for its contribution to the drafting of the model.
REFERENCES
C.I.Eau (Centre d'Information sur l'Eau) 2010 http://www.cieau.com/le-service-de-l-eau/les-usages (accessed 10 november 2010)
C.S.H.P.F. (Conseil Supérieur d'Hygiène Publique de France) 2006 Position relative aux enjeux sanitaires liés à l'utilisation des eaux de pluie pour des usages domestiques (Position relating to sanitary stakes related to rainwater use for domestic uses).
http://www.sante.gouv.fr/IMG/pdf/Avis_du_CSHPF_du_5_septembre_2006_relatif_aux_en jeux_sanitaires_lies_a_l_utilisation_d_eaux_de_pluie_pour_des_usages_domestiques.pdf (accessed 10 november 2010)
Decree August 21th 2008 Relatif à la récupération des eaux de pluie et à leur usage à l'intérieur et à l'extérieur des bâtiments (Relating to rainwater harvesting and their use at the interior and the outside of buildings). Official Journal n°201
http://www.legifrance.gouv.fr/affichTexte.do?cidTexte=JORFTEXT000019386409 (accessed 10 november 2010)
Dixon A., Butler D. and Fewkes A. 1999 Water saving potential of domlestic water reuse systems using greywater and rainwater in combination. Water science and technology 39(5), 25-32. European Official Journal 1998 Council Directive 98/83/EC of 3 November 1998 on the quality of
water intended for human consumption, L 330
http://eur-lex.europa.eu/LexUriServ/LexUriServ.do?uri=OJ:L:1998:330:0032:0054:EN:PDF (accessed 10 november 2010)
Fewkes A. 1999 The use of rainwater for WC flushing: the field testing of a collection system. Building and Environment 34, 765-772.
Fewkes A. 2004 The Modelling and Testing of a Rainwater Catchment System in the UK. PhD Thesis, Department of Building and Environmental Health, The Nottingham Trent University, Nottingham, UK.
Fewkes A. and Butler D. 2000 Simulating the performance of rainwater collection and reuse sustems using behavioural models. Building Services Engineering Research and Technology 21(2), 99-106.
Herrmann T. and Schmida, U. 1999 Rainwater utilisation in Germany: efficiency, dimensioning, hydraulic and environmental aspects. Urban Water Journal 1, 307-316.
Liu S., Makropoulos C., Butler D. and Memon F.A. 2007 An object based household water cycle model: concept and construction. Water Practice and Technology 2, http://www.iwaponline.com/wpt/002/02/default.htm (accessed 10 november 2010)
Pinfold J.V., Horan N.J., Wirojanagud W. and Mara D. 1993 The bacteriological quality of rainjar water in rural northeast thailand. Water Research 27(2), 297-302.
Simmons G., Hope V., Lewis G., Whitmore J. and Gao, W. 2001 Contamination of potable roof-collected rainwater in Auckland, New Zealand. Water Research, 35(6), 1518-1524.
Vaes G. and Berlamont J. 2001 The effect of rainwater storage tanks on design storms. Urban Water 3, 303-307.