En vue de l'obtention du
DOCTORAT DE L'UNIVERSITÉ DE TOULOUSE
Délivré par :Institut National Polytechnique de Toulouse (INP Toulouse)
Discipline ou spécialité :
Génie des Procédés et de l'Environnement
Présentée et soutenue par :
Mme CAROL VERHEECKEle mardi 25 novembre 2014
Titre :
Unité de recherche : Ecole doctorale :
MODULATION OF AFLATOXIN B1 PRODUCTION BY ASPERGILLUS
FLAVUS
Mécanique, Energétique, Génie civil, Procédés (MEGeP) Laboratoire de Génie Chimique (L.G.C.)
Directeur(s) de Thèse : MME FLORENCE MATHIEU
M. THIERRY LIBOZ Rapporteurs :
M. MASSIMO REVERBERI, UNIV. DEGLI STUDI DE ROME SAPIENZA Mme SABINE GALINDO, UNIVERSITE MONTPELLIER 2
Membre(s) du jury :
1 M. NASSERDINE SABAOU, ECOLE NORMALE SUPERIEURE KOUBA - ALGER, Président
2 Mme FLORENCE MATHIEU, INP TOULOUSE, Membre
2 M. OLIVIER PUEL, INRA TOULOUSE, Membre
2 Résumé
Les mycotoxines sont des molécules toxiques produites par de nombreuses espèces fongiques. Les seules mycotoxines avérées aujourd'hui cancérigènes pour l'homme sont les aflatoxines. Elles sont produites par le genre Aspergillus principalement et sont retrouvées tout au long de la chaine alimentaire (champs, stockage, transformation, etc.). A cause du réchauffement climatique, la France devient de plus en plus exposée à la présence de ces mycotoxines. Afin de limiter l'exposition des consommateurs, de nombreuses stratégies de prévention ou de décontamination sont développées. Dans ce contexte, nous avons recherché à mettre au point un système de lutte biologique permettant de prévenir la production d'aflatoxines sur le maïs au champ. Pour cela, nous avons choisi des bactéries issues du sol et déjà connues pour être commercialisées pour la lutte biologique, les actinomycètes. Nous avons étudié l'interaction in vitro sur boites de Pétri entre Aspergillus flavus, principal producteur d'aflatoxines, et certains actinomycètes. Nous avons démontré que l'interaction peut réduire la concentration en aflatoxines mesurée par HPLC. De plus, certains isolats bactériens sont aussi capables de réduire, en culture pure, la concentration d'aflatoxine B1 dans le milieu. Des premiers tests d'adsorption ont été réalisés pour comprendre la nature de ce mécanisme. Par ailleurs, une étude approfondie via RT-qPCR sur 6 souches bactériennes du genre Streptomyces sp. a montré que celles-ci étaient capables d'impacter l'expression de différents gènes impliqués dans la voie de biosynthèse chez A. flavus et A. parasiticus. Enfin, nous avons complété les données déjà existantes sur l'impact de facteurs environnementaux (température, disponibilité en eau et du temps d'incubation) sur la production d'aflatoxines.
Abstract
Mycotoxins are toxic contaminants of foodstuffs produced by a wide range of fungal species. Aflatoxins are the only mycotoxins carcinogenic for humans. They are mainly produced by the
Aspergillus genus and can be found at each step of the agrofood chain (e.g. field, storage, process).
Due to climate changes, France is starting to be exposed to aflatoxins. In order to limit the consumer exposure, many prevention or decontamination techniques have been developed. To this aim, we started the development of a biocontrol against aflatoxins accumulation for maize field application. Actinomycetes, are soil-borne bacteria that has already been commercialized as biocontrol. In Petri dishes, we studied the in vitro interaction between some actinomycetes and Aspergillus flavus, the main aflatoxins producer. We revealed that the interaction reduced the aflatoxins content (monitored by HPLC). Moreover, some bacterial isolates were able to reduce pure-aflatoxin B1 added in the medium. To understand this mechanism, adsorption tests has been conducted. Otherwise, RT-qPCR methodology was used to study the impact of Streptomyces-Aspergillus sp. on aflatoxin gene expression. Finally, the current knowledge of the impact of environmental factors (temperature, water activity and incubation time) on aflatoxins production was supplemented.
3
When the going gets tough,
5
Je souhaite dédier cette thèse ainsi que l'intégralité du travail qu'elle
représente à ma grand-mère Pierrette Semper.
"Les souvenirs que tu m'a laissé
valent plus que tout ce que je
possède au monde"
7 Acknowledgements:
Je n'aurai jamais assez de mots ni de place pour tous vous remercier comme il se doit. J'adore les films, alors je vais me servir d'eux pour m'aider à exprimer mes sentiments.
Dans un premier temps je souhaite remercier le Pr. Sabine GALINDO, professeur à l'Université Montpellier 2 et le Dr. Massimo REVERBERI, assistant professeur à l'Université de Sapienza de Rome, Italie pour avoir accepté d'être rapporteurs de ce mémoire. Je remercie également le Pr. Nasserdine SABAOU, professeur à l'Ecole Normale Supérieure de Kouba, Algérie et le Dr. Olivier PUEL, Ingénieur à l'INRA ToxAlim de Toulouse pour avoir accepté examiner ma thèse.
Un énorme et grand MERCI à mon Charles-Xavier (X-men), ma directrice de thèse. Tu as toujours été disponible, à l'écoute et prête à transmettre tes super-pouvoirs. Je te remercie pour la grande confiance que tu as mise en moi ainsi que pour ta patience et ta compréhension aussi bien pour les problèmes professionnel que personnel qui se sont malheureusement trop souvent entremélé pendant cette thèse. Tu m'a permi d'évoluer, de découvrir et controler mes super-pouvoirs et de m'épanouir aussi bien scientifiquement qu'humainement ! Encore Merci Florence MATHIEU ! MERCI !
Merci à mon Yoda (Star Wars), mon co-directeur de thèse. Tu as été là quand j'en avais besoin. Tu as été un bon maitre jedi et je te remercie de m'avoir pris sous ton aile en temps que padawan. Je te remercie également pour n'avoir jamais confondu ma famille et moi-même et m'avoir toujours soutenue, la force sera toujours avec moi, merci Thierry LIBOZ !
Merci à mon Hagrid (Harry Potter). Je te remercie d'avoir été plus un professeur qu'un élève pour moi. D'avoir été là de ma première lettre d'acceptation à poudlard jusqu'à l'affrontement final avec celui dont on ne prononce pas le nom. Je te remercie d'avoir été patient, attentif, courageux et toujours à l'écoute ! Je te remercie également pour tes heures sans compter, tes précieux conseils et ta grande amitié qui me tient profondement à coeur ! Je te remercie philippe ANSON ainsi que ta femme, Christine.
Je remercie également mon Tony Stark (Iron Man). Je te remercie de m'avoir permi d'être ton jarvis de la biologie moléculaire, et m'avoir permi de travailler en équipe à la captaine America (Avengers). Je te remercie également Elodie CHOQUE d'avoir été mon eddie (16 blocks). Merci de m'avoir aidée à me liberer d'un fardeau qui n'est pas le mien tout
8
en me cuisinant de beaux gateaux. J'espère que cela continuera aussi longtemps que MARVEL existera.
Je tiens également à remercier ma Silvia Broome (l'interprète). Je la remercie d'avoir relue tant de lignes et de m'avoir fait progresser en anglais. Egalement, je remercie Lora VERHEECKE de m'avoir conseillée dans les moments difficile et d'avoir assurée dans son rôle de grande soeur : je t'aime.
Je tiens également à remercier ma Mary Poppins (Mary Poppins) du Laboratoire. Je la remercie de m'avoir prêté son sac magique, de m'avoir prise sous son aile comme sa fille adoptive et d'être toujours de bonne humeur. Atika MEKLAT, tu es une amie inestimable et je te remercie pour ces merveilleux souvenirs d'Algérie. J'espère que cette thèse te rendra fière de ta fille adoptive !
Parler d'Atika sans sa grande famille à la treize à la douzaine (treize à la douzaine) est un sacrilège. Cette famille composée de merveilleux collègues : Adel AOUICHE, Saïd BELGHIT, Dalida BOUBETRA, Nourreddine BOURAS, Yacine et Nour GOUJDAL, Lynda LAMARI, Salim MOKRANE, Toumatia OMRANE, Amar RIBA, Rafika SAKER, Amine YEKKOUR et Abdelghani ZITOUNI. Je vous remercie de m'avoir fait découvrir votre pays. Je remercie particulièrement RIBA de m'avoir aidée lors de mes premiers pas d'HPLC et Amine pour son temps, sa franchise et son aide.
Je remercie également mon Marcus Burnett (Bad Boys) à moi. Je la remercie d'avoir été ma co-équipière pendant un an. De m'avoir aidée dans les premiers pas de cette thèse. Je remercie Marion DARRIET d'avoir également été mon 'lapin crétin' à moi. Avec l'aide de Marine GARCIA, vous avez été un puit sans fond de bonne humeur lors de nos pauses collectives.
Lors de cette thèse, j'ai eu l'honneur d'encadrer des stagiaires. Je tiens à les remercier d'avoir été présentes et de m'avoir permi d'avancer dans les travaux. Je souhaite particulièrement remercier ma Dylan Sanders (Esther BERNARD), ma Nathalie Cook (Khadija DAMAK) et ma Alex Munday (Yizhu ZHU) pour avoir été mes drôles de dames (drôles de dames). Je remercie également Rachelle EL KHOURY et Roxanne DIAZ.
Au sein de l'équipe je souhaite également remercier mon Mr. Q (James Bond ) de l'autoclave prénomée Cathy GIOVANNINI. Mon Francis Duflot (une grande année) de l'équipe et professeur de dégustation, j'ai nommé José RAYNAL. Je remercie également Albus Dumbledore (Harry Potter) pour m'avoir fait découvrir l'univers de la serre et du maïs, j'ai
9
nommé Daniel CARON. Egalement Patricia MIRABEL, ma Miss Moneypenny (James Bond) pour m'avoir aidée dans la gestion de budget.
Je souhaite également remercier l'équipe de production, le maquillage, les cascadeurs, les costumiers et tout le staff que sont entre-autre : Sara ALBERT, Ziad ALMOUSA-ALMAKSOUR, Hugot AUDINOT & Rémy KIRCH (Alias Tic et Tac), Mireille BOU FADEL, Stéphanie CHACAR, Stéphane COMPANT, Afonso DE SOUZA, Mylène GHISLAINE, Ariana GONZALEZ, Clothide GRAILLON, Kheira HADJEBA, Charlotte JEAN, Rym KHACHLOUF, Rebecca LISAK, Adeline LOUMAYE, Claire LUCAS, Coline LOUSTAUNAU, Gaëtan MAPPA, Jillian MARC, Tan MA, Virgine MARQUIS, Céline MATAR, Nicolas MATER, Ziad RIZK, Lysiane PAO, Felicia PETRASCO, Romain PIERRON et Zhoran YU.
Je remercie également Saïma MUZAMMIL, Muhammad Hussnain SIDDIQUE, Bilal ALI AHMAD et Elida GASTELUM pour avoir été plus que des collègues, simplement des amis.
Je tiens également à remercier mes amis qui m'ont soutenue, supportée et accompagnée tout au long de cette thèse. Je pense notament à Clarisse EGEE-GUILLEMIN pour avoir été mon Hamish (Braveheart), à Caroline STRUB pour avoir été ma Suze (confessions d'une accro du shopping), à Fany DESMARET pour avoir été mon Juba (Gladiator), Sébastien BERBE, Lise SUBRA, Marc PERRET et Isabelle PAC pour avoir été mes amis à la bronzés, Rayenne et Nasrallah ZBIB pour avoir été mes Leslie et Alex (Friends with kids) ainsi que Gerard BERGES (et sa famille), Gilles BERGEAU (et sa famille), David Pierret, Aurore PRIOLET et Justine RIOLI. Je remercie également mes collègues de la prévention routière et de mes cours de russe.
Une énorme pensée va également à ma maman et Denis, sans qui tout cela n'aurai jamais pu être possible. Je vous aime. Je remercie également ma mamie, mon oncle Gilles, ma tante Patrica et leur fille Cynthia qui m'ont toujours soutenu et aider sans rien attendre en retour. Et je remercie également l'ensemble de ma famille, notament Christine, Xavier, Violaine et Régis, pour avoir su m'aimer tel que je suis et m'aider dans les bons comme dans les mauvais moments.
Enfin, le dernier mot, mais non le moindre, je remercie mon Ted (Marie à tout prix). Je te remercie de m'avoir supportée tout au long de ces 9 années, pour aimer aussi bien mes rires et mes bétises que mes pleurs et mes rages. Je t'aime Dominique.
11 List of abbreviations:
A: Adenine A.: Aspergillus sp. AFB1: Aflatoxin B1
AFB2: Aflatoxin B2 AFB: AFB1 + AFB2
AFG1: Aflatoxin G1 AFG: AFG1 + AFG2
AFG2: Aflatoxin G2 AFT: AFB1 + AFB2 + AFG1 +AFG2
AFM1: Aflatoxin M1
AFP1: O-demethylation of AFB1 AFQ1: 3α-hydroxylation of AFB1
AF-alb: Aflatoxin albumin adducts in blood AVF: Averufin AVN: Averantin Aw: Water Activity BHA: 2(3)-tert-Butyl-4-Hydroxyanisole bw: body weight C: Cytosine c: conidies cd: conidiophores CEM: Corn Extract agar CPA: Cyclopiazonic Acid CYA: Czapek Yeast Agar DH: Dehydratase domain of PKS DHDMST: Dihydrodemethylsterigmatocystin DHOMST: Dihydro-O-Methylsterigmatocystin DHST: Dihydrosterigmatocystin DMST: Demethylsterigmatocystin D.O.N.: Deoxynivalenol E.: Emericella sp.
EFSA: European Food Safety Authority ENS: Ecole Nationale Supérieure ER: trans-acting Enoyl domain of PKS
EST: Short single-read Transcript sequences database. EU: European Union
F.: Fusarium sp. FB1: Fumonisin B1 FB2: Fumonisin B2 G: Guanine
12 h: hyphae
HCC:Hepatocellular Carcinoma HAVN: 5'-Hydroxy-Averantin
HBsAG positive: HBV-positives patients HBsAG negative: HBV-negatives patients HBV: Hepatitis B Virus
His-rich: section rich in Histidine in the aflR gene HIV: Human Immunodeficiency Virus
HOMST: 11-Hydroxy-O-Methylsterigmatocystin HR-PKS: Highly-reducing PKS
IARC: International Agency centre for Research on Cancer ID: Index of Dominance
KR: β-Ketoreductase domain of PKS L: Large
LD50: Letal Dose to kill 50% animals MA: Aerial Mycelium
MADE: Myxobacteria Aflatoxin Degradation Enzyme NOR: Norsolorinic Acid
NAA: Norsolorinic Acid Anthrone or Noranthrone NLD: Nuclear Localization Domain
NR-PKS: Non-reducing PKS OAVN: Oxoaverantin
OMST: O-methylsterigmatocystin OTA: Ochratoxin A
p: phialides
PBS: Phosphate Buffered Saline PCR: Polymerase Chain Reaction PDA: Potatoes Dextrose Agar PKS: Polyketide Synthase
PR-PKS: Partially-Reducing PKS psia: hydroxylated linoleic acids psic: oleic acids
PYB: Peptone Yeast extract Broth QTL: Quantitative Trait Loci R: Radical group of trichothecenes RA: Retinaculum Apertum
RASFF: Rapid Alert System for Food and Feed RCM: Residual Concentration in the Medium RF: Rectus Flexibilis
13 RT-qPCR: Reverse Transcription quantitative PCR S: Small (chapter 1.2.4.)
S: Spirales (chapter 1.2.10 & 3) SSR: Single Sequence Repeats ST: Sterigmatocystin
T: Thymine
Tc: C Vps tethering start point TDS: Total Diet Studies tsp: transcription start point TSP: Translational Start Point v: vesicule
VAL: Versiconal
VCG: Vegetative Compatibility Groups VERA: Versicolorin A
VERB: Versicolorin B
VHA: Versiconal Hemiacetal Acetate ZEA: Zearalenon
15
Liste of figures:
Figure 1 - Synergistic, additive, less than additive and antagonistic interactions as described by Grenier & Oswald, (2011). Effects of toxin A, toxin B and both toxins addition versus the control. ... 40 Figure 2 - Risk factors affecting mycotoxin occurrence in feed, taking poultry as a case study (knownmycotoxins.com, 2014) ... 42 Figure 3 - Prevalence of mycotoxins in different regions according to the percentage of positive samples (Nährer & Kovalsky, 2014) ... 44 Figure 4 - Number of publications per year on "Aflatoxin" between 1963 and 2013 (Pubmed). ... 48 Figure 5 - 2D representation of AFB1 (a.), AFB2 (b.), AFG1 (c.) and AFG2 (d.) structures . 48 Figure 6 - 2D representation of AFM1 structure ... 49 Figure 7 - Pathways of AFB1 biotransformation and excretion in humans (Vincenzi et al., 2011). The grey boxes highlight the fluids of excretion. AFQ1: 3α-hydroxylation of AFB1. AFP1: O-demethylation of AFB1. ... 50 Figure 8 - Maximum levels of AFT authorised in maize per country (Wu & Guclu, 2012). . 57 Figure 9 - Maps of the risks of AFB1 contamination in maize in different meteorological scenarios for the 2000-2100 period. a.= Business as usual scenario (no changes in parameters); b.= +3°C scenario; c.= +5°C scenario. (Battilani et al., 2012). ... 58 Figure 10 - Aspergillus flavus by microscopy. c= conidies; cd= conodiophores; h= hyphae; p= phialides and v= vesicule. (Personal data) ... 60 Figure 11 - The infection cycle of Aspergillus flavus in maize (Abbas et al., 2009) ... 61 Figure 12 - Aspergillus parasiticus by microscopy. c: conidies, cd: conodiophores, h: hyphae, p: phialides and v: vesicule. (Personal data) ... 61 Figure 13 - The genes cluster of the biosynthesis pathway of aflatoxin in A. parasiticus according to Yu (2012); Georginna & Payne (2009). New gene names are labelled on the left and old gene names are labelled on the right of the cluster. Number 1. to 12. and their associated genes (predicted genes in brackets) represent the steps described in chapter 1.2.5. ... 63 Figure 14 - Formation of norsolorinic acid: the first stable metabolite of aflatoxin biosynthesis (Ehrlich, 2009). Norsolorinic Acid Anthrone (NAA) = Noranthrone. In red, the predicted role of AlfCa. ... 64 Figure 15 - Averantin (AVN). The red part represents AflD action. ... 64
16
Figure 16 - 5'-Hydroxyaverantin (HAVN). The red part represents AflG action. ... 65 Figure 17 - 5'-oxoaverantin (OAVN). The red part represents AflH action. ... 65 Figure 18 - Averufin (AVF). The red part represents AflK action. ... 65 Figure 19 - Predicted steps in the conversion of AVF into Hydroversicolorone (HVN) from Ehlrich, (2009). ... 65 Figure 20 - Versiconal Hemiacetal Acetate (VHA). The red part represents AflW action. .... 66 Figure 21 - Versiconal (VAL). The red part represents AflJ action. ... 66 Figure 22 - Versicolorin B (VERB). The red part represents AflK action. ... 66 Figure 23 - Versicolorin A (VERA). The red part represents AflL action. ... 66 Figure 24 - Putative enzymatic steps for the conversion of VERA into Demethylsterigmatocystin (DMST). The suggested intermediates shown in brackets are hypothetical. ... 67 Figure 25 - Chemical structure: a. Sterigmatocystin (ST); b. Dihydrosterigmatocystin (DHST). The red parts represent AflO action. ... 67 Figure 26 - Chemical structure: a. O-methylsterigmatocystin (OMST), b. Dihydro-O-methylsterigmatocystin (DHOMST). The red part represents AflP action. ... 67 Figure 27 - Speculated last steps from OMST to AFB1 production according to Ehlrich (2009). HOMST= 11-HydroxyOMST. The numbers under the molecules are the atomic mass in Dalton. ... 68 Figure 28 - Schematic representation of aflR gene proposed by Ehrlich et al,. (2011). Possible consensus domains for DNA-binding transcription factors are represented in the aflS-aflR intergenic region (e.g. PacC, AflR,...). NLD= Nuclear Localization Domain; tsp= translational start point and His-rich= section rich in Histidine. ... 69 Figure 29 - Scheme representing the impacts of ∆aflR mutant on the aflatoxin gene cluster proposed by Georgianna & Payne (2009). An arrow represents a down regulation. nc= low level changes. ... 70 Figure 30 - Various upstream elements influencing the Aflatoxin/Sterigmatocystin (AF/ST) gene cluster. Representation of the different signaling elements, including: the heterotrimeric G protein signaling elements (FadA, GanB, GpgA and SfaD), the light velvet complex (VelB/VeA/LaeA) and the redox status (YapA, MsnA, AtfB, Ap-1 and SrrA) (Alkhayyat & Yu, 2014). ... 71 Figure 31 - Proposed model for the velvet complex (Alkhayyat & Yu 2014). ... 72
17
Figure 32 - Ppo impacts on the production of ST. psi = hydroxylated linoleic (α) and oleic (β) with the hydroxy groups represented by a letter; psiA (5'-8'-dihydroxy-), psiB (8'-hydroxy-) and psiC (lactone ring at the 5' of psiA) modified from Krijgsheld et al., (2013). ... 73 Figure 33 - Other environmental stimuli impacting AF/ST biosynthesis according to Alkhayyat & Yu (2014). Dashes represent unproven connections. ... 73 Figure 34 - 2-level model for aflatoxin excretion system proposed by Roze et al., (2011). Hypothesized pathways are represented by dashed lines. Tc= C Vps tethering complex. ... 74 Figure 35 - Effects of aw and temperature on growth (A) and AFB1 production (B) on a 10 days culture of A. flavus NRRL3357 according to Abdel-Hadi et al., (2012). ... 76 Figure 36 - 2- dimensional contour maps of AFB1 production profiles for A) BAFC4272 and B) BAFC4275 isolates on CYA medium (21 days after inoculation). The numbers on the contour lines refer to the mean AFB1 concentration (µg.g-1) (Astoreca et al., 2014). ... 77 Figure 37 - Global risks of AFB1 contamination in maize. The prediction is based on the aridity index during heading and ear ripening (Battilani & Logrieco, 2014). ... 78 Figure 38 - Micromorphology of Streptomyces sp. (Bergey, 1989). MA= Aerial Mycelium, RF= Rectus Flexibilis, RA= Retinaculum Apertum, S= Spira. ... 87 Figure 39 - Organisation of the Project AFLAFREE (2011-2015) ... 94 Figure 40- Aw of the maize based infusion depending on glycerol concentration ... 100 Figure 41 -Methodology used for interaction assessment and aflatoxins extraction (Verheecke et al., 2014) ... 102 Figure 42 - Methodology used for interaction assessment, RT-qPCR and AFT extractions. 103 Figure 43 - Figure 1 - radial growth of A. flavus at day 2 (a.), day 3 (b.), day 4 (c.), day 5 (d.) day 6 (e.) and day 7 (f.) versus temperature and aw. ... 124 Figure 44 - Figure 2 - radial growth of F. graminearum at aw of 0.95 (a.) and 1 (b.) versus temperature and days of incubation. ... 125 Figure 45 - Figure 3 - radial growth of A. flavus and F. graminearum (after co-inoculation) at day 2 (a.), day 3 (b.), day 4 (c.), day 5 (d.) day 6 (e.) and day 7 (f.) versus temperature and aw ... 125 Figure 46 - Figure 1 - a. Inoculation (day 0) in a Petri dish filled with ISP2 medium, actinomycetes and A. flavus are inoculated on the same time. Inoculation is done with the following instructions: 10 µl of spores suspension from A. flavus are spotted at 2 cm from the Petri dish periphery. Actinomycete streak is inoculated perpendicularly to A. flavus -actinomycete axe at 4.5 cm of the A. flavus spot. ... 135
18
Figure 47 - Phylogenetic tree between our isolates and selected species of Streptomyces genus. The evolutionary history was inferred using the Neighbor-Joining method (Saitou & Nei, 1987). The optimal tree with the sum of branch length = 0.22168834 is shown. The percentage of replicate trees in which the associated taxa clustered together in the bootstrap test (1000 replicates) are shown next to the branches (only values greater than 50% are given) (Felsenstein, 1985). The tree is drawn to scale, with branch lengths in the same units as those of the evolutionary distances used to infer the phylogenetic tree. The evolutionary distances were computed using the Kimura 2-parameter method (Kimura, 1980) and are in the units of the number of base substitutions per site. The analysis involved 35 nucleotide sequences. Evolutionary analyses were conducted in MEGA6 (Tamura et al., 2013). ... 140 Figure 48 - Figure S1 - The gene stability measure M for the seven reference genes candidates ... 158
19
Liste of tables:
Table 1 - The main mycotoxins originating from polyketides synthases. Based on Gallo et al., (2013). ... 36 Table 2 - Structure of trichothecenes: type A and B (Inchem, 1990). ... 37 Table 3 - Toxicity of the main mycotoxins regulated by the EU. '+'= symptoms on animals; no sign = no evidence of symptoms on animals... 38 Table 4 - Mycotoxins, their related commodities and examples of associated producing fungi (engormix, 2014). ... 41 Table 5 - Overview of Biomin's worldwide survey (2012 and 2013) (Nährer & Kovalsky, 2014) ... 43 Table 6 - Maximum levels authorised for mycotoxins in foodstuffs. (1881/2006 modified on 6th March 2014) (European Union, 2006). AFT= total among of AFT; M1 = aflatoxin M1. .. 46 Table 7 - Mycotoxins under surveillance (monitoring and follow-up) by the EU ... 47 Table 8 - Cohort studies of AFB1 exposure, HBV and HCC (IARC, 2012). HBsAG positive = HBV-positive patients. HBsAG negative = HBV negative patients. ... 52 Table 9 - Major diseases caused by aflatoxicosis in some animal species (Lizárraga-Paulín et al., 2011) ... 54 Table 10 - Notifications on total AFT given by the RASFF portal for the year 2013 in various products (RASFF, 2014) / = no data available. ... 56 Table 11 - Summary of species producing aflatoxins. ... 59 Table 12 - Examples of aflatoxin removal by bacteria. ... 91 Table 13 -Table 1: Production of AFB1 and AFB2 by A. flavus on maize-based medium at different temperatures, aw and incubation time ... 126 Table 14 - Table 1 - Actinomycetes presenting the same ID and the impact on AFBs concentration (Pictures in Annex 1) ... 132 Table 15 - Table 2 - Effect of different actinomycetes isolates on fungal growth and aflatoxin B1 and aflatoxin B2 concentration. Only the 27 which has shown mutual antagonism on contact with Aspergillus flavus (ID(2/2) are represented. ... 133 Table 16 - Table 3 - Impact of actinomycetes on aflatoxin B1 concentration in the media .. 134 Table 17 - Isolates, corresponding strains and their associated pairwise similarity in percent. ... 139 Table 18 - Table 1 - Streptomyces strains impact on A. parasiticus aflatoxins and gene expression ... 157
20
Table 19 - Table - 2 Streptomyces strains impact on A. flavus aflatoxins and gene expression ... 157 Table 20 - Table S1 - RT-qPCR Primers used for candidate reference genes and genes of interest. ... 158 Table 21 - Adsorption test results. Cells were suspended in water in the presence of AFB1 (1 µg) and incubated at 30°C during 1 and 60 minutes. Data are means ± standard deviations in % of the standard. 1= supernatant; 2= washing water and 3= washing methanol. ... 159
21 Communications:
Articles:
2014 C. Verheecke, T. Liboz, M. Darriet, N. Sabaou and F. Mathieu. In vitro interaction
of actinomycetes isolates with Aspergillus flavus: impact on aflatoxin B1 and B2 production. Letters in Applied Microbiology 58, 597-603.
2014 C. Verheecke, T. Liboz, P. Anson, R. Diaz and F. Mathieu. Effect of Streptomyces
interaction on aflatoxin production by Aspergillus flavus and A. parasiticus. Submitted to: Microbiology.
2014 N. Azzoune, S. Mokrane, A. Riba, N. Bouras, C. Verheecke, N. Sabaou and F. Mathieu. Contamination of common spices by aflatoxigenic fungi and aflatoxin B1 in Algeria. Accepted in: Quality Assurance and Safety of Crops & Foods.
2014 C. Verheecke, T. Liboz, P. Anson, M. Darriet and F. Mathieu.
Streptomyces-Aspergillus interactions: Impact on Aflatoxins B accumulation. Accepted with major modification in: Food Additives and Contaminants: special issue ISM2014 (Annex 1).
Communications during National and International symposiums:
2014 C. Verheecke, T. Liboz, P. Anson, M. Darriet and F. Mathieu.
Streptomyces-Aspergillus interactions: Impact on Aflatoxins B accumulation. Oral Presentation, at ICM2014 Beijing, China and Journées Mycotoxines 2014, Montpellier, France.
2014 A. Yekkour, O. Toumatia, A. Meklat, C. Verheecke, N. Sabaou, A. Zitouni and F.
Mathieu. First survey on the trichothecenes-producing Fusarium culmorum strains and their impact on infecting wheat and barley in Algeria. Poster, ISM2014, Beijing, China.
2014 C. Verheecke and R. Diaz, P. Anson, T. Liboz and F. Mathieu. Validation of reference genes for quantitative real-time PCR studies in Aspergillus parasiticus. Poster, ISM2014, Beijing, China.
2014 D. Caron, C. Verheecke and F. Mathieu. Aflatoxins on maize cobs inoculated with
Aspergillus flavus in greenhouse. Poster, ISM2014, Beijing, China.
2013 C. Verheecke, M. Darriet, T. Liboz, N. Sabaou and F. Mathieu. Involvement of
Actinobacteria in the reduction of Aflatoxin B1 & B2 biosynthesis by Aspergillus flavus Oral Presentation. ISM-MycoRed, Martina-Franca, Italy.
22
2013 C. Verheecke, K. Damak, T. Liboz and F. Mathieu. Impact de l’Aw et la
Température sur la croissance et la production d’Aflatoxine B1 par Aspergillus flavus. Oral Presentation, Journée Mycotoxines, Brest.
2012 C. Verheecke, T. Liboz, M. Darriet, N. Sabaou and F. Mathieu. Développement
d’un biocontrôle pour réduire la présence d’Aflatoxine B1 dans la filière maïs, Oral Presentation, Journée Streptomyces, Nancy.
2012 C. Verheecke, M. Darriet, T. Liboz, N. Sabaou and F. Mathieu. Involvement of
Actinobacteria in the reduction of Aflatoxin B1 & B2 biosynthesis by Aspergillus flavus. Poster, World Mycotoxin Forum meets IUPAC, Rotterdam, Hollande.
23 Table of Contents Acknowledgements: ... 7 List of abbreviations: ... 11 Liste of figures: ... 15 Liste of tables: ... 19 Communications: ... 21 Table of Contents ... 23 List of Annexes: ... 25 General Introduction ... 27 1. Bibliographic review ... 33 1.1. Mycotoxins ... 35 1.1.1. Definition ... 35 1.1.2. Classification ... 35 1.1.3. Toxicity ... 37 1.1.4. Food chain contamination and consumer exposure ... 41 1.1.5. Regulations and socio-economic impacts ... 45 1.1.6. "Emerging" mycotoxins ... 47
1.2. Aflatoxins ... 48
1.2.1 Presentation ... 48 1.2.2. Toxicity ... 49 1.2.3. Aflatoxins exposure ... 55 1.2.4. The fungi producing aflatoxins ... 58 1.2.5. The biosynthesis pathway of aflatoxins ... 62 1.2.6 The genetic regulation of aflatoxins production ... 69 1.2.7. Abiotic parameters: impact on aflatoxins production ... 75 1.2.8. Biotic parameters: impact on aflatoxins production ... 82 1.2.9. The reduction of aflatoxins ... 89
1.3. Project Aflafree ... 93
1.3.1. Objectives of the thesis ... 95
2.Materials and Methods ... 97 2.1. Micro-organisms ... 99
24 2.1.1. Fungal strains ... 99 2.1.2. Actinomycete isolates ... 99 2.2 Media: ... 99 2.2.1 Pre-culture media: ... 99 2.2.2 Growth media: ... 100 2.2.3 Conservation media: ... 101 2.3 Culture: ... 102
2.3.1 Culture for the screening study of good aflatoxin-reducing candidates (results chapter 3.2): ... 102 2.3.2. Culture for the RT-qPCR study of the impact of selected Streptomyces on aflatoxin gene expression (results chapter 3.3): ... 103 2.3.3 Culture for the AFB1-reduction test of 12 chosen actinomycetes (results chapter 3.2): ... 104 2.3.4 Culture for the AFB1 adsorption test for 2 chosen actinomycetes strains (S13 and S06) (results chapter 3.3): ... 104
2.4 Analytical methods: ... 104
2.4.1 Aflatoxins HPLC measurement: ... 104 2.4.2 RT-qPCR: ... 105 2.4.3 16S sequencing: ... 107
3. Results & Discussion ... 109 3.1. Impact of environmental parameters on AFB and D.O.N. production. ... 110
Introduction ... 111 Conclusion ... 127
3.2. Study of actinomycetes and Aspergillus flavus interaction ... 129
Introduction ... 130 Additional results ... 138 Conclusion ... 141
3.3. Characterisation of the mechanisms involved by RT-qPCR while A. flavus and A.
parasiticus interaction and AFB1-adsorption tests ... 143
Introduction ... 145 Additional results ... 159 Conclusion ... 161
5. Discussion & Perspectives ... 163 6. Bibliographic References ... 171
25
Annexes ... 201
List of Annexes:
Annex 1 - C. Verheecke, T. Liboz, P. Anson, M. Darriet and F. Mathieu. Streptomyces-Aspergillus interactions: Impact on Aflatoxins B accumulation. Accepted with major modification in: Food Additives and Contaminants: special issue ISM2014 ... 203 Annex 2 - Maximum levels and Guidance values for mycotoxins in feedstuffs (European Union, 2002, 2006) ... 218 Annex 3 - Aflatoxin biosynthesis according to Yu et al., (2004) ... 219 Annex 4 - Picture of the different Index of Dominance (ID) represented in Verheecke et al., 2014 (Table 1). ... 220 Annex 5 - Poster presented in World Mycotoxin Forum meets IUPAC, Hollande (2012). ... 221 Annex 6 - Posters presented in the International Conference on Mycotoxins 2014, Beijing, China. ... 222
27
29
General Introduction
Mycotoxins are toxic substances produced by fungi that contaminate various food and feedstuffs. There are about a hundred different types of mycotoxins which are produced by a wide range of fungal species. The variety of their toxicity is linked to the diversity of their chemical structure.
Amongst them, aflatoxins (except for aflatoxin M1) are the only mycotoxins considered as carcinogenic for humans (Group 1, IARC). In addition to carcinogenicity, they are also highly hepatotoxic, nephrotoxic, immunotoxic, etc. These toxins often contaminate maize, peanuts, pistachios and brazil nuts, etc. In European Union (EU), they are regulated for food and feedstuffs. Aflatoxins accumulation is due to the colonisation of foodstuffs by fungi. The latter mainly belong to the Aspergillus genus and can be found all along the agrofood chain (e.g. field, storage, process).
The producers of aflatoxins present 29 genes regrouped in a cluster situated in a subtelomeric region (chromosome 3). They encode enzymes that convert MalonylCoA and AcetylCoA into aflatoxins. This pathway is regulated by specific (AflR, AflS) as well as general transcription regulators which are themselves triggered by many environmental parameters.
Those enviromental parameters can be abiotic or biotic. The former involve temperature, water activity (aw), CO2 concentration, etc. Optimal conditions for aflatoxin B1
production are 25 to 30°C and an aw of 0.96-0.99. Due to climate changes, those
environmental conditions are starting to occurr in France where sporadic aflatoxins content above the EU limits have been detected (e.g.: 2003). Interwoven with abiotic parameters, biotic parameters such as fungal or bacterial interactions can also impact aflatoxins accumulation.
Biocontrols (based on various organisms) have been developed to avoid aflatoxins accumulation at field. Currently, afla-guard®: a non-toxigenic A. flavus strain is the main
biocontrol available on the market. However, other biocontrols based on bacteria are under development. Bacteria such as Streptomyces (actinomycetes) were identified as interesting producers of inhibiting metabolites.
30
In France, the main crop at risk of aflatoxins contamination is maize. Contamination could have major economic impacts (15.6 million tones of maize were produced in France in 2011). Thus, it is crucial to limit aflatoxins content below the legal limits.
In order to limit aflatoxins content, management of biotic and abiotic parameters can mostly prevent aflatoxins accumulation. For maize, at seed level, Bt hybrids decrease aflatoxin B1 contamination by 6.2 fold. At field, agricultural practices focusing on irrigation, fertility and massive insects prevention can reduce aflatoxins accumulation. During maize storage, temperature management is the most commonly used technique to monitor grain conservation. At that step, chemical and natural compounds (BHA, PP, essential oils) can prevent aflatoxins production.
In terms of decontamination techniques, tortilla production can reduce up to 84% of the initial aflatoxin B1 content. Chemicals (e.g.: ammoniation or ozone) or degrading organisms can reduce aflatoxins content. Adsorbents and binding bacteria can also prevent aflatoxins absorption by animals.
Within this context, we developed a project to prevent aflatoxins occurrence in the maize foodchain called: Aflafree. To this aim, our work was divided into 2 axis. Firstly, we developed a biocontrol able to reduce aflatoxins contamination at field without impacting the maize microbial ecosystem and to understand the associated mechanisms involved. Secondly, we investigated the impact of A. flavus and its associated aflatoxins production on the local ecosystem (Fusarium sp.) and on D.O.N. production during the sensible step of maize pre-storage.
This work is a first step towards the development of a biocontrol agent (or/and its enzymes & metabolites) against aflatoxins accumulation in maize. It is also the first milestone in the understanding the impact of A. flavus on the mycotoxigenic fungi already present in the maize ecosystem in France.
Hereafter, Chapter 1 focuses on bibliography. We will start with a brief introduction on mycotoxins, followed by the state of research on aflatoxins. We will specially focus on the prevention of their production and decontamination of food and feedstuffs thanks to bacteria.
Chapter 2 presents the different techniques developed to monitor the impacts of interactions and abiotic parameters on A. flavus (and A. parasiticus).
Chapter 3 focuses on the results and discussions. They are divided into 3 different parts:
31
(i) Impact of environmental parameters on aflatoxin B1, aflatoxin B2 and D.O.N.
production;
(ii) Study of actinomycetes and A. flavus interaction;
(iii) Characterisation of the mechanisms involved by RT-qPCR and adsorption tests;
Finally, we discusses results, drawing up conclusions and introducing future perspectives.
33
1. Bibliographic
review
35
Bibliographic review
1.1. Mycotoxins1.1.1. Definition
According to the Collins dictionary, mycotoxins are "any of various toxic substances produced by fungi, some of which may affect food and others of which are alleged to have been used in warfare". The word mycotoxin comes from the ancient Greek word "mykes" which means mushroom and the Latin word "toxicus" which means poison (Online Etymology Dictionary, 2014). Bennett & Klich (2003) elaborated a more precise definition of mycotoxins:
(i) low molecular weight molecules;
(ii) secondary metabolites produced by filamentous fungi;
(iii) which can cause death or disease to human being or animal at a low concentration.
The 3 main mycotoxins producers are Aspergillus, Penicillium and Fusarium genera. Currently, 300 to 400 mycotoxins are known, among which 30 have been studied for their toxic and/or disturbing impacts for human and animal (Bennett & Klich, 2003; Boudergue et al., 2009).
1.1.2. Classification
Due to their diverse chemical structures and origins, mycotoxins are very hard to classify. They can be arranged according to their chemical structure, toxicity, biosynthetic origin and/or producing fungi.
Among the different biosynthetic origins, the best-known involve the polyketides.
The Polyketide Synthases (PKS) are a family of multi-domains enzymes largely found in bacteria, fungi and plants. There are 3 types of PKS:
Type I: large enzymes with multiple functional domains only active once during the biosynthesis (bacteria and fungi);
Type II: a complex of several single module proteins with separated enzymatic activities, acting iteratively to produce a polyketide (bacteria);
Type III: a single active site enzyme which acts repeatedly to form the final product; they function as homodimers and do not include a Acyl-Carrier Protein domain (mainly in plants).
36
Table 1 - The main mycotoxins
originating from polyketides synthases. Based on Gallo et al., (2013).
As we studied fungi, this study will solely focus on Type I PKS with a special attention to the following ones:
Fungal PKS (mainly Type I iterative PKS) can be divided according to their reducing functions depending on the absence or the presence of some or all domains of β-Ketoreductase (KR), Dehydratase (DH) and Enoyl Reductase (ER). The different types of PKS and their associated mycotoxins are represented in table 1.
The Non-Reducing PKS (NR-PKS) AflC is essential for aflatoxins production (Watanabe & Townsend, 2002). This chemical family of mycotoxins includes 18 compounds based on 3 furans and 1 coumarin structure (Table 1).
The 6-methylsalicylique synthase, e.g. in Penicillium expansum, is a PKS without the ER domain. This PKS is called Partially-Reducing PKS (PR-PKS) and is essential for patulin production (Gallo et al., 2013).
The genes aoks1 of A. westerdijkiae and otapksPN of P. nordicum encode 2 different PR-PKS without the ER and DH domains. Their encoding PR-PKS are essential for the production of Ochratoxin A (OTA): an isocoumarin coupled with a l-phenylalanin (Bacha et al., 2009; Gallo et al., 2013).
The production of fumonisins and Zearalenon (ZEA) relies on Highly-Reducing PKS (HR-PKS), a specific type of PKS with the following 3 reducing domains: KR, DH and ER (Gallo et al., 2013). Fumonisins are based on a linear chain of 18 carbons. The fumonisin B1 (FB1) and fumonisin B2 (FB2) are the most commonly known. FB2 is the C10 deoxy analogue of FB1. On the contrary, ZEA is an acid resorcyclic lactone.
37
The second best known biosynthetic origin is the terpene cyclase trichodiene synthase (e.g.: Tri5). The latter is essential for the cyclisation of the farnesyl pyrophosphate which itself induces the production of trichothecenes (Hohn & Vanmiddlesworth, 1986). There are more than 200 trichothecenes with a common 12-13 epoxytrichothec-9-ene core structure (Table 2). They are classified in 4 groups from A to D, according to their attached radical group (R). The group at the C-8 position is the differentiating element between groups A and B. Table 2 represents the structure of those groups. For example, the T-2 toxin (Table 2 a.) has an esther function at C-8 whilst all Type B trichothecenes have a C-8 keto (carbonyl) function. These 2 types of trichothecenes are the most alarming in terms of occurrence and toxicity (McCormick et al., 2011).
Table 2 - Structure of trichothecenes: type A and B (Inchem, 1990).
The third biosynthetic origin is the dimethylallyltryptophan synthase. The latter is essential for the conversion of l-tryptophan and dimethylallyl diphosphate into tetracyclic ergoline ring. This ring is the main core of ergots alkaloids which are toxins produced by fungi and plants. Ergots have been extensively reviewed in Wallwey & Li, (2010).
1.1.3. Toxicity
1.1.3.a Brief history
Ergotism is supposedly the oldest human illness linked to mycotoxins, with major outbreaks in the Middle Age. Ergotism was the result of eating bread polluted by “ergot”. The most severe symptom of this illness was leg-necrosis and delirium. “Ergot” comes from Claviceps purpurea which can contaminate rye and can be transmitted to humans through bread consumption (van Dongen & de Groot, 1995).
At the end of 1959, peanuts from Brazil were imported in England as protein supplements in farming feeds. Soon afterwards, young turkeys began to die and other animals such as pigs fell ill. 100,000 turkey poults were killed by the so-called “turkey X disease”,
38
“X” referring to its supposedly viral origin (Cole, 1986). Shortly after, aflatoxins were identified as the source of this intoxication (Nesbitt et al., 1962).
1.1.3.b Toxicities
Following this incident, toxicologists began to study the toxicity of mycotoxins. Humans and animals are exposed to mycotoxins through ingestion, skin contact and inhalation. For instance, moisture-damaged indoor environments are one of the greatest threats in terms of inhalation of mycotoxins (Täubel et al., 2011). Nonetheless, until now, the highest risk of exposure remains ingestion.
Mycotoxins have a wide range of health impacts. This is due to the variety of their chemical structures. Table 3 draws a link between mycotoxins and their health impacts. Among those mycotoxins, aflatoxins (except for aflatoxin M1) are the only ones recognized as carcinogenic for humans (Group 1 (IARC, 2014)).
Table 3 - Toxicity of the main mycotoxins regulated by the EU. '+'= symptoms on animals; no sign = no evidence of symptoms on animals.
Further details on this table are given below, except for aflatoxins' impact on human and animal health which will be further developed in chapter 1.2.2.
OTA is potentially carcinogenic for humans (Group 2B (IARC, 2014)). OTA is absorbed through the gastrointestinal tract, transported in blood vessels and accumulated in kidneys (Ringot et al., 2006). For animals, OTA is genotoxic, teratogenic, carcinogenic, hepatotoxic, nephrotoxic and immunotoxic (Hayes et al., 1974; Boorman et al., 1992; Castegnaro & McGregor, 1998; Al-Anati & Petzinger, 2006; Palma et al., 2007). OTA
39
exposure is supposedly linked to the Balkans human nephropathy (Petkova-Bocharova & Castegnaro, 1990).
Patulin is not carcinogenic for humans (Group 3 (IARC, 2014)). For animals, it is teratogenic and possibly immunotoxic (Osswald et al., 1978; Paucod et al., 1989; Llewellyn et al., 1998). In addition, symptoms such as weight loss, intestinal and gastric problems, neurotoxicity and nephrotoxicity can occur (Pfohl-Leszkowicz, 1999).
Deoxynivalenol (D.O.N.) is not carcinogenic for humans (Group 3 ((IARC, 2014)). The symptoms (animals and humans) linked to D.O.N. exposure are weight loss, anorexia, nausea, diarrhea, nutritional loss and immune system modification (Pestka, 2007; Burel et al., 2009; Sobrova et al., 2010).
ZEA (Group 3 (IARC, 2014)) is genotoxic, teratogenic, carcinogenic, hepatotoxic, haematotoxic and immunotoxic for animals (Zinedine et al., 2007). It is also an endocrine disruptor due to its close structure to 17 ß-oestradiol (Fitzpatrick et al., 1989) leading to animal abortion and infertility. For humans, there is a presumed link between exposure to ZEA and premature puberty in Puerto-Rico (Sáenz de Rodriguez et al., 1985).
Fumonisins (B1+B2) (Group 2B (IARC, 2014)) are not considered as genotoxic but are teratogenic (Voss & Riley, 2013) (Group 2B (IARC, 2014)). Its other health impacts include liver toxicity, cancer, leukoencephalomalacia and pulmonary edema (the entire list of impacts is available in table 3). For humans, fumonisins are supposedly linked to esophagus cancer (Rheeder et al., 1992).
T-2 toxin (Group 3 (IARC, 2014)) is teratogenic, hepatotoxic and causes weight loss, decrease in blood cell and leukocyte count, reduction in plasma glucose and stomach toxicity for animals. There are few studies on the ht-2 toxin, its deacetylated form, which has alleged health impacts. Unfortunately, too little is known on t-2 & ht-2 impacts on human health (Li et al., 2011).
Citrinin is not carcinogenic for humans (Group 3 (IARC, 2014)) despite an identified in vitro genotoxicity (Knasmuller et al., 2004). It is teratogenic and nephrotoxic for animals (Reddy et al., 1982; Flajs & Peraica, 2009) but not enough data are available to identify its impacts on human health.
40
1.1.3.c Co-contamination
In addition to the studies linking a single mycotoxin exposure to its toxicity impacts, other research have been done in vivo on co-contamination, the effects of double or multiple mycotoxins exposure, on animal health. Those impacts can be organised in 4 categories: synergic, additive, less than additive or antagonistic effects categories (Figure 1).
Figure 1 - Synergistic, additive, less than additive and antagonistic interactions as described by Grenier & Oswald, (2011). Effects of toxin A, toxin B and both toxins addition versus the control.
Most studies have focused on Aflatoxin B1 (AFB1) and FB1 co-contamination. Grenier & Oswald (2011) made a summary of all research to date and found the four different categories of effects in a wide range of animals:
In almost all cases of co-contamination, the synergistic and/or additive effects were the reduction of the entire body weight (bw) gain. In some cases, the antagonistic effects were the reduction of organs, including liver and kidneys. For example, the aspartate amino-transferase is an enzyme monitored in blood. Its higher concentration is a sign of organs malfunction including liver, kidneys, brain and heart (Ozer et al., 2008). This enzyme amounts were measured in broilers after a 33 days exposure to different AFB1/FB1 mg.kg-1 of feed alone or in combination. At 0.05/50, synergistic effects were shown; at 0.05/200, additive and at 0.2/50 or 0.2/200, antagonistic impacts. This example reveals the complexity of mycotoxins co-contamination. Despite measuring the impact of 2 toxins on the same animal species, results differ depending on the ratios (Tessari et al., 2010).
Another example is AFB1 and OTA co-contamination. Synergistic effects were less predominant than in AFB1/FB1 co-contamination. Nonetheless, there were many additive and less than additive effects of AFB1 and OTA co-contamination on bw reduction and embryos mortality/egg production (Grenier & Oswald, 2011). This example highlights the need to study double and multiple contamination of mycotoxins to identify the most synergistic risks on animal and human health.
41
1.1.4. Food chain contamination and consumer exposure
Each mycotoxin is produced by 1 or several fungal genera. Depending on environmental conditions, each fungal species produces a wide range of different mycotoxins (Garcia et al., 2009). For instance, the single genus Aspergillus produces mycotoxins such as aflatoxins, ochratoxins, patulin and fumonisins (Frisvad et al., 2007). Table 4 represents the main fungal genera with their related mycotoxins and the main commodities they can contaminate:
Table 4 - Mycotoxins, their related commodities and examples of associated producing fungi (engormix, 2014).
Mouldy commodities are not directly linked to a high mycotoxin content. On the contrary, macroscopically clean commodities can be highly contaminated with mycotoxins. This makes it difficult to sort commodities according to the level of mycotoxins contamination. The absence of mycotoxins in mouldy commodities can be due to a non-mycotoxigenic fungal colonization or to environmental conditions not propitious to mycotoxins production. Those environmental parameters are listed in figure 2.
To manage mycotoxins, it is crucial to first pay attention to the fields (parts 1. and 2. of figure 2). Fields crops (1.) are naturally contaminated by a variety of mycotoxigenic fungi, depending on weather conditions, farmer practices, fungal competition and other parameters (listed in 1.). For example, the French maize is usually contaminated at field with Fusarium species including F. graminearum and section liseola (“Les Fiches Accidents,” 2014). Yet, in Italy, with its warmer climates, maize is usually contaminated by other fungi such as Aspergillus sp. (Giorni et al., 2007). These fungal contaminations have an impact on mycotoxins occurrence not only at field but also during storage (parts 3., 4., 5. and 6. (before and after process)) (Magan & Aldred, 2007).
42
Figure 2 - Risk factors affecting mycotoxin occurrence in feed, taking poultry as a case study (knownmycotoxins.com, 2014)
43
Managing storage conditions is the second crucial step (parts 3.,4., 5. and 6.). Drying duration, water activity (aw), temperature, CO2 monitoring and other parameters listed in 3.,4.,
5. and 6. are key factors to limit the production of mycotoxins during storage (Chulze, 2010). The processing steps (parts 4. (milling process) and 6.) can reduce or increase the amount of mycotoxins. For example, during starch extraction, only 8.7% of the initial AFB1, aflatoxin B2 (AFB2), aflatoxin G1 (AFG1) and aflatoxin G2 (AFG2) (AFT) content is in the starch. Most of the initial AFT content (36.9%) is in feed by-products (e.g. 6.) (including fiber, germ and gluten) and can impact animals health (8.) (Aly, 2002).
The main feedstuffs at risk of contamination are maize, groundnuts, copra, palm nuts and oilseed cakes. A recent international survey (2012 and 2013) of 4,200 samples of feedstuffs analysed the presence of AFT, ZEA, D.O.N., fumonisins and OTA (Table 5). More than 50% of samples were found positive for D.O.N. and fumonisins. 25 to 30% of the samples were found positive for AFT with an average concentration of 33.5 µg.kg-1 (2012 and
2013). The main contaminant was D.O.N.. 59-64% of samples were found positive with an average concentration of 770-1,088 µg.kg-1 depending on the year (2012-2013) (Nährer &
Kovalsky, 2014).
Table 5 - Overview of Biomin's worldwide survey (2012 and 2013) (Nährer & Kovalsky, 2014)
Depending on the geographic region, prevalence of mycotoxins differs (Figure 3). For instance, in Central Europe, the most predominant mycotoxin is D.O.N. with 66% of samples positive, followed by fumonisins 36% and AFT 29%. Notwithstanding, in Southern Europe, results have found a higher occurrence of mycotoxins with fumonisins at 71%, AFT at 55% and D.O.N. at 50%.
44
Figure 3 - Prevalence of mycotoxins in different regions according to the percentage of positive samples (Nährer & Kovalsky, 2014)
The level of mycotoxins exposure in crops is not a direct indicator of human exposure. It is very difficult to obtain reliable and accurate data due to censorship and to the heterogeneity of mycotoxins content in commodities. The results of recent studies in China, Korea, Malaysia and South Africa showed maximum levels of AFT daily intake ranging from 2.69 to 133 ng.kg-1 of bw. European countries are usually less exposed (< 1 ng.kg-1 bw) with
the exception of Greece. For instance, 2 French studies estimated children daily exposure
between 1 and 10 pg.kg-1 bw. This can be explained by the European regulatory environment
45 1.1.5. Regulations and socio-economic impacts
Confronted by the variety of contaminated commodities and toxicological data, the European Food Safety Agency (EFSA) listed all the sources of possible consumer exposure and proposed recommendations of maximum levels. The EU then issued regulations to limit consumer exposure based on those recommendations. Table 6 gives an overview of the
various maximum limits applied for foodstuffs in Europe (1881/2006 modified on 6th March
2014, European Union). The limits for AFT will be developed in chapter 1.2.3. The regulation sets concentration limits for D.O.N. from 1,250 µg.kg-1 in unprocessed cereals and milling
fractions of maize (particles size higher than 500 µm) to 200 µg.kg-1 for baby food (infants
and young children).
The EU has the lowest limits for mycotoxins contamination in the world. Although regulations aim to protect EU citizens health, their impact on international trade can be drastic. Wu (2008) studied the economic impacts of AFB1 limits on peanuts trade. In the EU, food processing industries experienced greater occurrences of supply shortage and a reduced space to set their own prices and substitute goods. In the countries supplying peanuts to the EU; trading routes changed as soon as the EU laws were enforced. Peanuts started to be traded between countries with identical or similar regulations on AFB1. Nations with poor or poorly enforced standards in terms of AFB1 contamination began to trade peanuts between themselves at a cheaper price (Wu, 2008). In the short term, EU regulations on AFT have reduced the ability of low-income nations to export certain foodstuffs to the EU market and to gain revenues from this trade.
46
Table 6 - Maximum levels authorised for mycotoxins in foodstuffs. (1881/2006 modified on 6th March 2014) (European
47 1.1.6. "Emerging" mycotoxins
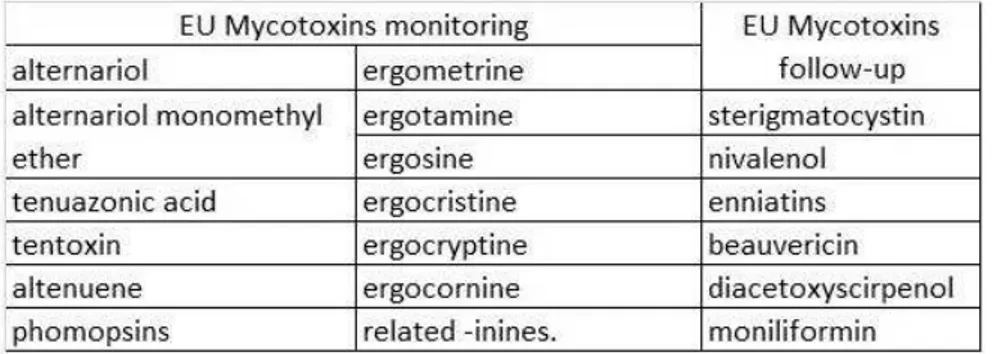
Currently, more than 300 mycotoxins have been identified. However, only 14 have been regulated due to their high exposure risk and health threats for EU consumers. Among the remaining mycotoxins, some are in the EU's priority lists. They are shown in table 7:
Table 7 - Mycotoxins under surveillance (monitoring and follow-up) by the EU (European Union, 2012; Verstraete, 2013).
The first and second columns list mycotoxins whose presence in feed and food the EU recommends monitoring to evaluate consumer exposure.
The third column list mycotoxins whose contamination and toxicity risks have to be evaluated in the forthcoming years.
The "emerging" status of other mycotoxins is also directly linked to the availability of reliable techniques to analyse those mycotoxins and to develop reliable exposure data. The development of measurement techniques including LC-MS has revealed possible threats due to masked, hidden, bound or glycosylated mycotoxins, including D.O.N. metabolites with a high toxicity potential (Verstraete, 2013).
48 1.2. Aflatoxins
1.2.1 Presentation
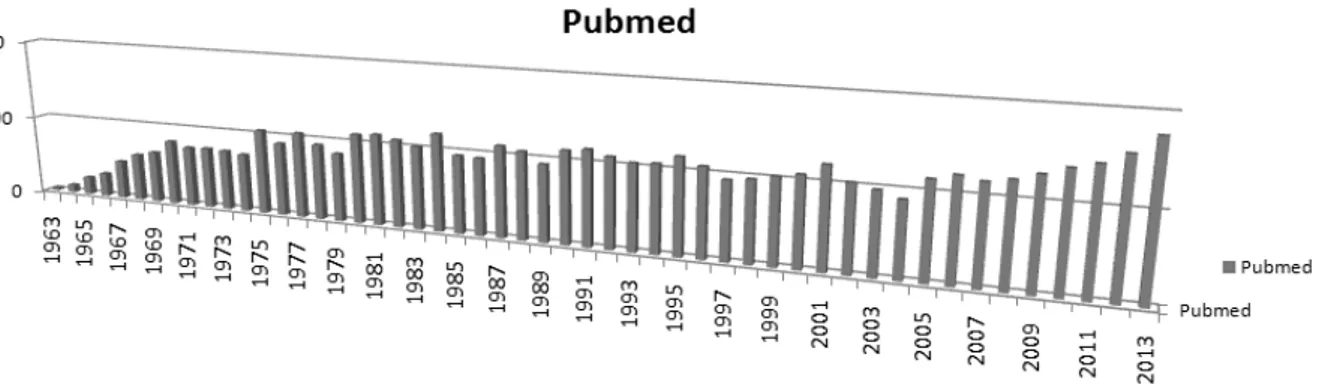
There are currently 41,100 scientific publications among which more than 10,000 focus on aflatoxin. Figure 4 represents the number of publications per year on aflatoxin since the first characterisation in 1962. Nowadays, more than 300 publications are published every year on this subject.
Figure 4 - Number of publications per year on "Aflatoxin" between 1963 and 2013 (Pubmed).
In 1962, the Turkey X disease led to the discovery of AFT. Nesbitt et al., (1962) identified 2 main types based on their fluorescence: the "B" aflatoxins (AFB) with a violet-blue fluorescence (445 nm) and the "G" aflatoxins (AFG) with a green fluorescence (455 nm).
The AFB are made of AFB1 and AFB2. The chemical structure of AFB1 (figure 5 a.), is based on a coumarin group (in red) attached to a bisfuran ring (in green) and a pentanon
group (in blue). AFB1 molecular weight is
(figure 5 b.) does not have a double bond in the bisfuran ring.
The AFG chemical structure is close to the B's, with the same coumarin and bisfuran ring. The difference is that AFG have a furan group (in purp
pentan group. The distinction between AFG1 and AFG2 is the same as between AFB1 and
AFB2 (Figure 5 c. and d.).
Shortly after the discovery of AF
Allcroft & Carnaghan (1963)
AFB1 contaminated groundnuts meal (daily intake of 2 to 10.8 mg). The cows' milk was given to ducklings which developed liver lesions. An investigation of the milk revealed the presence of aflato
(Figure 6). The name AFM1 comes from cows' milk.
is a result of AFB1 hydroxylat
metabolism (Allcroft & Carnaghan, 1963)
Evolutionary studies estimate that AFT have been produced for more than 400 million years
(Alkhayyat & Yu, 2014). However, u
produce AFT. The hypotheses of Cary & Ehrlich (2006) are that AFT could:
(i) be a defense response by fungi to stress; (ii) provide protection from UV damage (iii) be by-products of primary metabolism (iv) be virulence factors
(v) increase asexual spore production;
(vi) provide protection from predators for reproductive structures such as conidia and sclerotia.
1.2.2. Toxicity
The toxicity of AFT
Williams et al., 2004; IARC, 2012)
humans (except for AFM1) (Group
& Linsell, 1977) but other targets remain
intradermal contact. The median lethal dose (LD50) for AFB1
rabbits to 18 mg.kg-1 bw for rats
49
Figure 6 - 2D representation of AFM1 structure
AFB1 molecular weight is 312 g.mol-1. Unlike AFB1, t
does not have a double bond in the bisfuran ring.
The AFG chemical structure is close to the B's, with the same coumarin and bisfuran ring. The difference is that AFG have a furan group (in purple) where AFB aflatoxins have a pentan group. The distinction between AFG1 and AFG2 is the same as between AFB1 and
the discovery of AFB and AFG,
Carnaghan (1963) fed cows with naturally
AFB1 contaminated groundnuts meal (daily intake of 2 to 10.8 mg). The cows' milk was given to ducklings which developed liver lesions. An investigation of the milk revealed the presence of aflatoxin M1 (AFM1)
(Figure 6). The name AFM1 comes from cows' milk. It
hydroxylation by the cow's
(Allcroft & Carnaghan, 1963).
Evolutionary studies estimate that AFT have been produced for more than 400 million years However, until now, questions remain on the incentives for fungi to produce AFT. The hypotheses of Cary & Ehrlich (2006) are that AFT could:
nse response by fungi to stress; provide protection from UV damage;
products of primary metabolism; factors;
increase asexual spore production;
provide protection from predators for reproductive structures such as conidia and
has already been broadly studied (Peers & Linsell, 1977; , 2004; IARC, 2012). Since 2012, those AFT are considered as carcinogen
(Group 1 (IARC, 2014)). The main target organ is the liver
targets remain. Exposure happens through ingestion, inhalation or intradermal contact. The median lethal dose (LD50) for AFB1 ranges from
rats (Nutrition, 2014).
2D representation of AFM1 structure
Unlike AFB1, the AFB2 structure
The AFG chemical structure is close to the B's, with the same coumarin and bisfuran le) where AFB aflatoxins have a pentan group. The distinction between AFG1 and AFG2 is the same as between AFB1 and
Evolutionary studies estimate that AFT have been produced for more than 400 million years ntil now, questions remain on the incentives for fungi to produce AFT. The hypotheses of Cary & Ehrlich (2006) are that AFT could:
provide protection from predators for reproductive structures such as conidia and
(Peers & Linsell, 1977; considered as carcinogen for
target organ is the liver (Peers
Exposure happens through ingestion, inhalation or from 0.3 mg.kg-1 bw for
50
1.2.2.a Impacts on human health
Human ingestion of AFB1 can cause many different symptoms. Those symptoms are mainly due to its 8-9 epoxide form. This form, as well as other AFB1 metabolites, are represented in figure 7:
Figure 7 - Pathways of AFB1 biotransformation and excretion in humans (Vincenzi et al., 2011). The grey boxes highlight the fluids of excretion. AFQ1: 3α-hydroxylation of AFB1. AFP1: O-demethylation of AFB1.
a. Experimental and human evidence of metabolites excretion; b. Scarce or no evidence available; c. Only experimental evidence available.
Aflatoxin 8-9 epoxide is the result of AFB1 conversion by cytochrome P450 family into its carcinogenic form. This form can bind DNA or be hydrolysed and converted into
51
aflatoxin dihydriol to become aflatoxin albumine adducts in blood (AF-alb). The latter is a frequently used biomarker. Symptoms in humans are linked to AFT metabolites. The exposure can be acute (high levels (mg daily intake) of AFT resulting in immediate symptoms) or chronicle (low to moderate levels (µg daily intake) exposed regularly), and can impact various organs such as liver and kidneys.
Acute exposure:
The most occurring symptoms are linked to chronicle AFT exposure. However, in cases of exceptionally high AFT contents, clinical symptoms such as hepatitis, bile duct proliferation, edema, anorexia, malaise, reduced kidney function and lethargy can appear (Williams et al., 2004; Lizárraga-Paulín et al., 2011). Shortly after identifying AFT, a link between AFB1 food exposure and human hepatitis was found. The first case of endemic "aflatoxicosis" revealed that 397 persons were daily exposed to 2-6 mg of AFB1 during a month. Among these, 106 died due to a complete liver or/and kidneys failure (Krishnamachari et al., 1975). Since then, despite improvements in food safety, endemic aflatoxicosis still occur in many African and Indian countries. The last case was reported in April 2004 with a maize concentration of up to 46.4 mg.kg-1. This led to 317 cases of aflatoxicosis, among
which 125 led to deaths (CDC, 2014). Chronicle exposure:
HepatoCellular Carcinoma (HCC):
HCC is a common form of cancer: around 500,000 new cases are diagnosed every year around the world (El-Serag, 2011). Many cohort studies have been conducted in China to gain a precise knowledge of the incidence of AFT on HCC occurrence. Blood and/or urine samples were taken from more than 43,000 persons (aflatoxins and AFT biomarkers were quantified). Exposure to AFT led to a 2.4 to 5.5 fold increase of HCC occurrence (Ross et al., 1992; Qian et al., 1994; Wang et al., 1996). Those data led to the classification of AFT as carcinogenic for humans. Further investigations revealed that in 36% of HCC cases, AFT exposure was correlated with a G to T transversion at codon 249 of the TP53 tumour-suppressor gene (Stern et al., 2001).
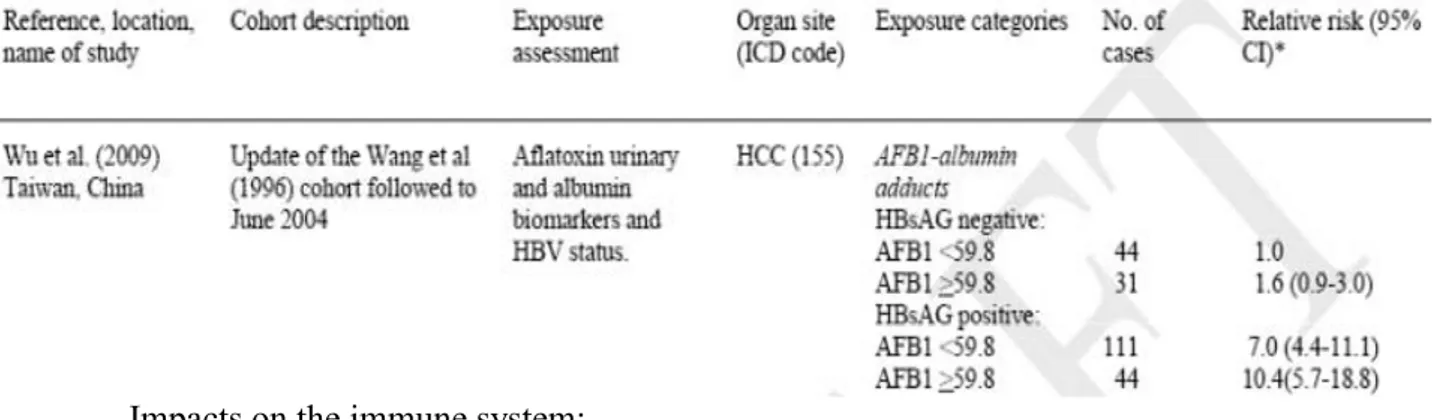
Furthermore, there is an epidemic link between HCC cases and the Hepatitis B Virus (HBV). A cohort study evaluated the impact of HBV and AFB1 exposure on HCC incidence (Wu et al., 2009). As shown in table 8, the relative risk of HCC incidence in HBV-positive patients rises from 1 to 7. In case of high exposure to AFB1 (≥ 59.8 fmol.mg-1 of AF-alb) this
52
risk reaches 10.4. AFB1 exposure and HBV have a synergistic effect on the development of HCC.
Table 8 - Cohort studies of AFB1 exposure, HBV and HCC (IARC, 2012). HBsAG positive = HBV-positive patients. HBsAG negative = HBV negative patients.
Impacts on the immune system:
Chronicle AFT exposure can also impact the immune system. There is currently few data available on those impacts on humans. Nonetheless, Jiang et al., (2005) studied the AF-alb concentration of 64 Ghanaians. The AF-AF-alb concentration ranged from 0.33 to 2.27
pmol.mg-1 albumin. They showed that the number of leukocytes was the same, independently
of AF-alb content. However, T/B lymphocytes and activity markers of leukocytes were shown to be significantly lower in case of high AF-alb. This data suggests a reduction of cellular immunity in case of AFB1 exposure (Jiang et al., 2005).
The Human Immunodeficiency Virus (HIV) leads to a progressive failure of the immune system. Jolly et al., (2011) studied 314 Ghanaians (including 155 HIV-positive). They first demonstrated that HIV-positive Ghanaians had a rate of AF-alb significantly higher than the seronegatives. Moreover, statistical analysis revealed a significant correlation between the quantity of AF-alb and the HIV viral load in HIV-positive persons (Jolly et al., 2011).
Child growth retardation:
Another impact of chronicle exposure to AFT is child growth retardation. Gong et al., (2004) monitored the height and AF-alb concentration of 200 children between 16 and 37 months old in Benin. A reverse correlation was established between the amount of AF-alb concentration and children height. For example, over an 8-month period, the children highly exposed to AFT grew 1.7 cm lesser than children less exposed. These data led to the conclusion that AFT exposure has an impact on infant growth (Gong et al., 2004).