Open Archive TOULOUSE Archive Ouverte (OATAO)
OATAO is an open access repository that collects the work of Toulouse researchers and
makes it freely available over the web where possible.
This is an author-deposited version published in :
http://oatao.univ-toulouse.fr/
Eprints ID : 13222
To link to this article :
URL :
http://www.educationaldatamining.org/IEDMS/EDM2013
To cite this version : Bovo, Angela and Sanchez, Stephane and
Heguy, Olivier and Duthen, Yves
Analysis of students clustering
results based on Moodle log data.
(2013) In: 6
thInternational
Conference on Educational Data Mining - EDM 2013, 6 July 2013 - 9
July 2013 (Memphis, Tennessee, United States).
Any correspondance concerning this service should be sent to the repository
administrator:
[email protected]
Analysis of students clustering results based on Moodle
log data
Angela Bovo
Andil Université Toulouse 1 IRIT[email protected]
Stéphane Sanchez
Université Toulouse 1 IRIT[email protected]
Olivier Héguy
Andil[email protected]
Yves Duthen
Université Toulouse 1 IRIT[email protected]
ABSTRACT
This paper describes a proposal of relevant clustering fea-tures and the results of experiments using them in the con-text of determining students’ learning behaviours by min-ing Moodle log data. Our clustermin-ing experiments tried to show whether there is an overall ideal number of clusters and whether the clusters show mostly qualitative or quan-titative differences. They were carried out using real data obtained from various courses dispensed by a partner insti-tute using a Moodle platform. We have compared several classic clustering algorithms on several group of students using our defined features and analysed the meaning of the clusters they produced.
Keywords
clustering, Moodle, analysis, prediction
1.
INTRODUCTION
1.1
Context of the project
Our project aims to monitor students by storing educational data during their e-learning curriculum and then mining it. The reasons for this monitoring are that we want to keep students from falling behind their peers and giving up. This project is a research partnership between a firm and an university. The partner firm connects our research with its past and current e-learning courses, hence providing us with real data from varied trainings.
All available data comes from a Moodle [5] platform where the courses are located. Moodle’s logging system keeps track of what materials students have accessed and when. We then mine through such logs.
1.2
Clustering as a means of analysis
Clustering is the unsupervised grouping of objects into classes of similar objects. In e-learning, clustering can be used for finding clusters of students with similar behaviour patterns. In the example of forums, a student can be active or a lurker [1, 7]. These patterns may in turn reflect a difference in learning characteristics, which may be used to give them differentiated guiding [2] or to predict a student’s chance of success [3]. They may also reflect a degree of involvement with the course, which, if too low, can hinder learning. The data contained in Moodle logs lends itself readily to cluster-ing, after a first collecting and pre-processing step [6]. Our aim with this analysis will be to determine if there is an overall ideal number of clusters and whether the clus-ters show mostly qualitative or quantitative differences. We chose clustering, which is unsupervised, in order to better reflect the natural structure of our data. Because of this choice, the outcome of our experiments will not be directly relevant to the success of the students, but will rather reflect the differences in their usage of the LMS.
2.
FEATURES CHOSEN TO AGGREGATE
THE DATA
We have tried to aggregate the Moodle log data into a list of features that could capture most aspects of a student’s online activity. The features we have selected are: the login frequency, the date of last login, the time spent online, the number of lessons read, the number of lessons downloaded as a PDF to read later, the number of resources attached to a lesson consulted, the number of quizzes, crosswords, as-signments, etc. done, the average grade obtained in graded activities, the average last grade obtained, the average best grade obtained, the number of forum topics read, the num-ber of forum topics created, and the numnum-ber of answers to existing forum topics. For every ”number of x” feature, we actually used a formula that would reflect both the distinct and total number of times that this action had been done. All of our features are normalized, with the best student for each grade obtaining the grade of 10, and others being proportionally rescaled.
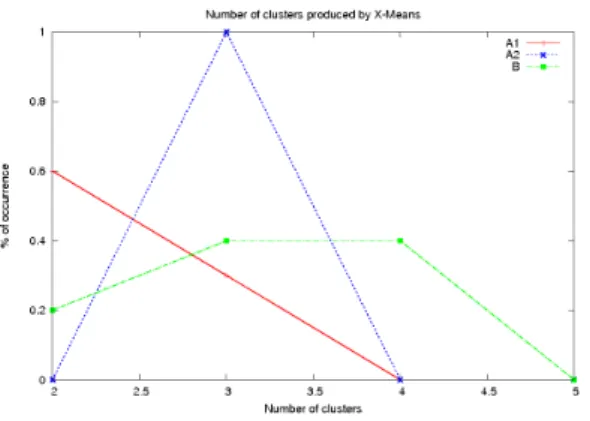
Figure 1: Sample clustering result with X-Means
All our experiments were performed using Weka [4], and con-verting the data first into the previously described features, then transforming these features into Weka attributes and instances. We can then view the feature data for each of these clusters or students in order to analyse the grouping. In order to test the accuracy of the obtained clusters, we used the 10-fold cross-validation method, which directly out-puts a mean error, which we show in figure 1. We have averaged over a few runs with different randomizing seeds. We executed the following clustering algorithms provided by Weka: Expectation Maximisation, Hierarchical Clustering, Simple K-Means, and X-Means. X-Means chooses a best number of clusters, which we show. The other algorithms take as an input parameter the required number of clusters. These numbers will be comprised between 2 and 5, based on the X-Means result.
We have selected 3 different trainings: two classes of a same training, which we will call Training A1 and A2, and a to-tally different training B. Training A1 has 56 students, A2 has 15 and B has 30. Both A1 and A2 last about a year while B lasts three months.
4.
CLUSTERING RESULTS
4.1
Best number of clusters
The following figure shows the results of the four algorithms
used on each of our three datasets. The first shows the
frequency at which the X-Means algorithm proposed a given number of clusters. The other three graphs show the error for a given number of clusters for K-Means, Hierarchical clustering and Expectation Maximisation. We can see that all algorithms generally agree on at most 2 or 3 clusters.
4.2
Meaning of the clusters
To our surprise, the clusters observed for all three trainings did not show anything more relevant than a simple distinc-tion between active and less active students, with variadistinc-tions according to the chosen number of clusters. We did not, for instance, notice any group that would differ from another simply by their activity on the forum.
To explain this, we offer the following possible reasons. Firstly, we have a relatively small number of students in each train-ing (between 15 and 56), which may mean less variety in
behaviour. Secondly, this training may be targeted towards a relatively homogeneous audience in terms of age, profes-sional training, and habitual use of IT. Thirdly, a vicious circle effect can happen of the forum, because if few people use it, other students have less incentive for using it. Hence, in about all observed clusters, the students were only quantitatively differentiated by a global activity level. It is also to be noticed that when the number of clusters was too large, clusters containing only one student, the most or least active of his training, tended to form. This phenomenon might be a good indicator that the number of clusters is too high without the help of a comprehensive study.
However, the fact that all differences were proportional also means that the student’s activity level was also correlated to the grades they obtained in graded activities (which were not evaluative). This seems to indicate that in our train-ings, using a quantity of activity is sufficient to help identify students in trouble, which is our global aim.
5.
CONCLUSIONS AND FUTURE WORK
This paper proposes comprehensive and generic features that can be used for mining data obtained from Moodle courses. These features are then used to conduct a clustering of the data, using several algorithms, followed by an analysis, which seems to show very little qualitative difference in behaviour between students. It seems that a single feature, a kind of index of their global activity, would be almost sufficient to describe our data. This is also shown by the very little (2 to 3) number of clusters that is sufficient for describing our data. We propose several explanations for this surprising result, such as the small dataset, the homogeneity of our students and a vicious circle effect. However, the results mean that using our features or computing a quantity of ac-tivity could be enough to monitor students and notice which ones run a risk of failure.
6.
REFERENCES
[1] M. Beaudoin. Learning or lurking? Tracking the ”invisible” online student. The Internet and Higher Education, (2):147–155, 2002.
[2] J. Lu. Personalized e-learning material recommender system. In Proc. of the Int. Conf. on Information Technology for Application, pages 374–379, 2004. [3] M. L´opez, J. Luna, C. Romero, and S. Ventura.
Classification via clustering for predicting final marks based on student participation in forums. In
Educational Data Mining Proceedings, 2012.
[4] Machine Learning Group at the University of Waikato. Weka 3: Data mining software in java, 2013.
http://www.cs.waikato.ac.nz/ml/weka. [5] Moodle Trust. Moodle official site, 2013.
http://moodle.org.
[6] C. Romero, S. Ventura, and E. Garc´ıa. Data mining in course management systems: Moodle case study and tutorial. Computers and Education, pages 368–384, 2008.
[7] J. Taylor. Teaching and Learning Online: The Workers, The Lurkers and The Shirkers. Journal of Chinese Distance Education, (9):31–37, 2002.