This is an author-deposited version published in: https://sam.ensam.eu Handle ID: .http://hdl.handle.net/10985/12114
To cite this version :
Mohammed EL MOUSSAID, Jean-Christophe WAHL, Nicolas PERRY - DEVELOPMENT OF STRUCTURING MODEL OF WOUND COMPOSITE VESSEL DOME - In: 20 th International Conference on Composite Materials, Danemark, 2015-07-19 - 20 th International Conference on Composite Materials - 2015
Any correspondence concerning this service should be sent to the repository Administrator : [email protected]
DEVELOPMENT OF STRUCTURING MODEL OF WOUND
COMPOSITE VESSEL DOME
Mohammed EL MOUSSAID1, Jean-Christophe WAHL1, Nicolas PERRY2 1I2M-UMR 5295, University of Bordeaux
IUT Bordeaux - 15, rue Naudet 33175 Gradignan FRANCE Email: [email protected]
2I2M-UMR 5295, University of Bordeaux
IUT Bordeaux - 15, rue Naudet 33175 Gradignan FRANCE Email: [email protected]
3I2M-UMR 5295, Arts et Métiers ParisTech Esplanade des Arts et Métiers 33405 Talence France
Email: [email protected]
Keywords: Structuring model, Composite vessels dome, Wet winding. ABSTRACT
Nowadays, the composite pressure vessels are the most mature mode for storing hydrogen at very high pressure. Regardless of the many advantages of the composite pressure vessels, storage under high pressure leads to the use of thick layers of composite, and the behaviour of this type of structure is poorly mastered due to the higher impact of the process on the material-structure behaviour, and especially at the dome area.
In order to model the behaviour of composite pressure vessels, in this paper a structuring model of composite pressure vessels is proposed. The structuring model takes into account the variability and specificity of the geometry of the dome area that is considered as the most problematic part of the composite pressure vessels. We integrate in our sizing model properties such as end of helical layers, thickness evolution, winding angle evolution, voids and fibre content.
1 INTRODUCTION
In view of the growing of the energy needs and the exhaustion of fossil resources, hydrogen fuel cell is able to play an increasingly important role as a technology to produce renewable energy. The feasibility of this technology through the study of its storage which remains a key step in its deployment.
Gaseous Hydrogen storage under high pressure for autonomous energy application leads to non-metallic solutions for the material of vessels. The choice of carbon epoxy composites was adopted for the design of storage vessels under high pressure. The use of thick wound carbon epoxy composite is intended to provide a burst pressure higher than 2000 bar.
All qualities of thick composite vessels in terms of weight and stiffness, should not lead us to forge that the behaviour of thick composite vessels is poorly mastered due to the higher impact of the process on the material-structure behaviour, and especially at the dome area. Several studies have been conducted in the last decade to better predict the behaviour of thick composite vessels [1, 2, 3].
The thick composite vessels are not always well described. This is mainly due to insufficient knowledge of the microstructure and geometry of the thick composite vessels, but also due to the current limitations to modelling the geometry of such structures. For this reason, relevant research for these purposes will also be necessary.
Several structuring models are available in the literature [3, 4, 5, 6] to model the structure of multi-sequences composite vessels dome. But these models are limited because they are only based on the combination between thicknesses and winding angle in the dome, without considering local variability.
To model the behaviour of thick composite vessels, it is necessary to appreciate the physical and mechanical characteristics of the material in the dome area. It is important to incorporate in the structuring model, characteristics related to the process such as fibre volume content variation, thickness evolution, winding angle, ends layers and voids volume content variation.
The aim is to provide a structuring model allowing the most accurate modelling of the constituent elements of composite vessels dome structure. The model takes into account the local physical properties variation and predicts accurately the geometry of the composite vessels dome.
Digital microscopies observations have been made on some composite vessels dome. Analyses are performed from structural scale to microstructural scale. Then the results obtained are compared with analytical model. The wet winding is used for the manufacture of carbon fibre composite vessels. Regarding winding technic, we are interested only on geodesic winding mainly used in industry. 2 LOCAL PHYSICAL PROPERTIES VARIATION
In this section we detail the method to estimate local physical properties such as fibre volume content variation, voids volume content variation, winding angle, ends layers and thickness evolution along the dome. Analysis of a cross section of the dome area is performed with digital microscopies to estimate local physical properties at structural and microstructural scales.
Two cross-sections are analysed from a side view (Fig. 1), to perceive comprehensively the layers along the dome and to perform a thorough analysis of all local physical properties.
Figure 1: Schematic representation of composite vessel.
2.1 Fibre volume content variation
The local variation of fibre volume content in the structure causes a local variation in mechanical properties. Several studies have been devoted to the microstructural characterization of thick composite vessels. Significant variation in fibre volume content through the thickness was observed [1, 2, 7].
In this section our goal is to estimate fibre volume content as well as its variation through the thickness and along the composite vessels dome. This study is made from images taken using digital microscope. Image analysis was a widely used method in determining the fibre volume content [1, 8, 9]. It provides access to information at the microstructural scale in the composite material. Generally, image analysis involves extracting the information contained in images captured by a digital microscope with various range scales. To calculate the fibre volume content, several researchers [1, 8, 9] use the thresholding method. From a grayscale image, thresholding is used to separate out the regions of the image corresponding to fibre.
In a first time, the analysis of the cylindrical part of the composite vessels was carried out, and the fibre volume content was measured and compared with the average fibre volume content value. The thickness of the cross-sections is equivalent to the thickness of a layer.
fibre volume content is higher in the helical layers (69%) than in the hoop layers (61%). The fibre volume content remains uniform in thickness, but it decreases slightly in the last deposited helical layer (65 %).
To form a layer (±α), two fibre tows are arranged side-to-side, which in effect means that the thickness of a layer in the cylindrical part is two times the thickness of a tow, and the average fibre volume content in a tow is the average fibre volume content measured through the thickness in a layer. The average fibre volume content being about 61% is the reference value that we use.
The same analysis is performed along the dome part. To access to information on a microstructural scale, a cross-section is recut into ten areas (Fig. 1). The analysis presented here covers the ten areas of the dome.
We have observed the same trends in the dome area as in the cylindrical part (Fig. 3). The fibre volume content is higher than the reference value along dome part, which means that the deposited layers are more compacted. The last deposed layer covering the entire dome also has a much smaller volume fraction (65%), but which also remains above the reference value.
1 2 3 4 5 6 7 0% 10% 20% 30% 40% 50% 60% 70%
80% Helical layer [cross-section 1] Hoop layer[cross-section 1] Helical layer [cross-section 2] Hoop layer [cross-section 2]
Layer F ib re c on te nt
Figure 2: Fiber volume content variation through the thickness in the cylindrical part
1 2 3 4 5 6 7 0 0,2 0,4 0,6 0,8 1 1,2
1,4Cylindrical part (Helical) Cylindrical part (Hoop) Dome part (Area 1) Dome part (Area 2) Dome part (Area 3) Dome part (Area 4) Dome part (Area 5) Doma part (Area 6) Dome part (Area 7) Dome part (Area 8) Dome part (Area 9) Dome part (Area 10)
Layer N or m al iz ed fi br e co nt en t
Figure 3: Normalized fiber volume content variation through the thickness in the dome part As the fibre volume fraction content varies depending on the orientation of the layers, the thickness should also appear variations. The results shown (Fig. 4) reveals that the helical layers having higher
fibre volume content are relatively more compacted than the hoop layers which have the reference fibre volume content value. This is because the quantity of fibre deposed is identical regardless of the position in the thickness of the structure.
1 2 3 4 5 6 7 0 0,2 0,4 0,6 0,8 1 1,2
Helical layer [cross-section 1] Hoop layer [cross-section 1] Helical layer [cross-section 2] Hoop layer [cross-section 2]
Layer N or m al iz ed th ic kn es s
Figure 4: Normalized thickness layer variation in the cylindrical part
2.2 Void volume content variation
Voids are detrimental for high performance composite structures. Much consideration has been given to the impact of voids on composite materials [1, 2, 7, 10, 11].
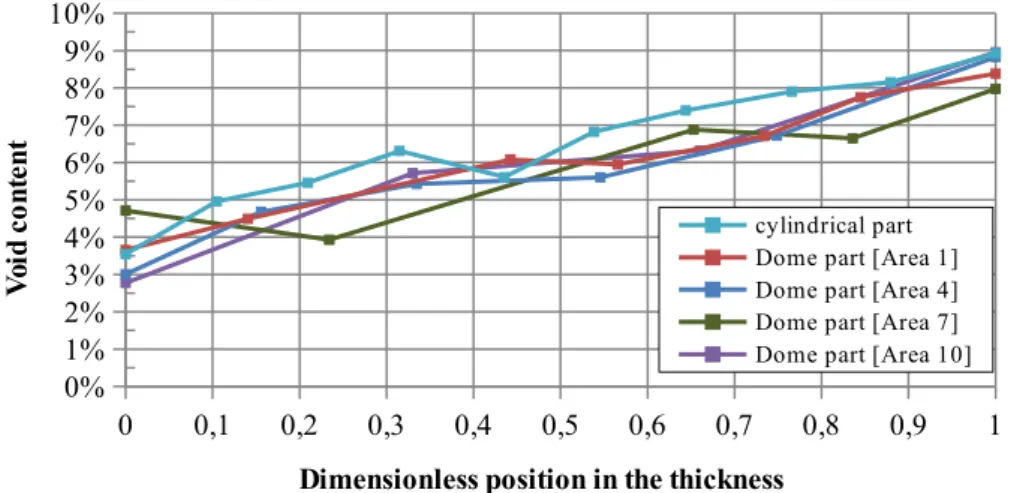
To estimate the void volume content, the whole of researchers [12, 13], agreed on the use of the thresholding method, which is used to separate out the regions of the image corresponding to voids. A similar study to the estimation of fibre volume content is led to estimate the void volume content. The analysis is carried on the same cross-sections. Generally, the void volume content increases from the inside (Liner) to the outside of the composite vessels. However, this variation does not depend on the position or the orientation of a layer. This clear overall trend on the cylindrical part is also observed along the dome part (Fig. 5).
0 0,1 0,2 0,3 0,4 0,5 0,6 0,7 0,8 0,9 1 0% 1% 2% 3% 4% 5% 6% 7% 8% 9% 10% cylindrical part Dome part [Area 1] Dome part [Area 4] Dome part [Area 7] Dome part [Area 10]
Dimensionless position in the thickness
V oi d co nt en t
Figure 5: Void volume content variation through the thickness and along the composite vessel dome
2.3 Calculation of filament winding angle
In order to model the behaviour of composite vessels, it is important to calculate the evolution of the filament winding angles of the fibres in the domes part.
The equation (1) from the literature [4] is valid to predict the evolution of filament winding angles in the dome part, where the winding angle is the angle between the fibre tow and the meridian direction of the dome. This equation describes both geodesic and non-geodesic winding.
dα
dz
=
λ
[
sin(α )tan( α)
r
−
r
''1−r
' 2cos( α )
]
−
r
'r
tan(α )
(1)
Where α is the angle between the fibre tow and the meridian direction of the dome, r the radius in the dome, z the position in the axis of the composite vessel, r' and r'' are respectively the first and second derivative of r with respect to z and λ the slippage coefficient of the fibre tows on the supporting surface. When the slippage coefficient is zero, means in effect that there is no friction the solution of the differential equation (1) became the general equation of geodesic winding of Clairaut (2).
α=arcsin (r0
r )
(2)
Where r0 the radius at the turnaround point.
A comparison between the analytical model and results from observations of a composite vessel cross-section is performed to validate the model of evolution of winding angles.
First, the positions of end layers are measured, and then these measurements are compared with the theoretical value of the turnaround radius at the end layer which can be calculated from the equation (3).
r
0=
R sin(α
R)
(3)
Where αR the winding angle at cylindrical part and R the radius at the dome tangent line (equator).Filament winding angle along the layers is then measured. The analysis is performed on two cross-sections (Fig. 1).
Helical Helica
l Helical Helical Hoop Helical Helical Hoop Helical Hoop Analytical [mm] 70.60 42.30 79.87 25.04 83.20 54.24 20.00 85.50 20.00 86.34 Experimental measurement cross-section 1[mm] 68.30 42.31 80.02 25.00 82.15 52.68 20.00 85.22 20,00 86.01 Experimental measurement cross-section 2 [mm] 68.50 40.74 80.80 23.37 83.28 52.40 20.00 85.16 20.00 86.05 Table 1: Position of ends layers: comparison between analytical model and experimental
measurements 67 69 71 73 75 77 79 81 55 60 65 70 75 80 85 90 Analytical model
Experimental measured angle [cross-section 1] Radius(mm) W in d A n g le ( d g re e )
Figure 6: Calculation of filament winding angle: comparison between analytical model and experimental measurements
From the results (Table 1), we notice a correlation between the measured values and the theoretical values of the turnaround radius. We note also that filament winding angle measured along the dome (Fig. 6) is close to the analytical model describing a geodesic winding. Thereafter we adopt the model of evolution of winding angle described by the equation (2).
2.4 Predicting dome thickness of composite pressure vessels
The predicting of thickness is an important step to describe as closely as possible the behaviour of dome and therefore the behaviour of the composite pressure vessel.
Several models to predict the dome thickness are proposed in the literature. The first approach is the formulation proposed by Clairaut [14]. It is the simplest formulation, it considers the winding angle along the dome. The issue with this formulation is that the thickness tends to infinity while approaching to the end of the layer (Fig. 7). The formulation used in ABAQUS [9] considers the winding angle along the dome and takes into account the width of fibre tows. However, as in the Clairaut formulation, the thickness tends to infinity while approaching to the end of the layers (Fig. 7). In both cases a thickness correction is required at the end of the layers.
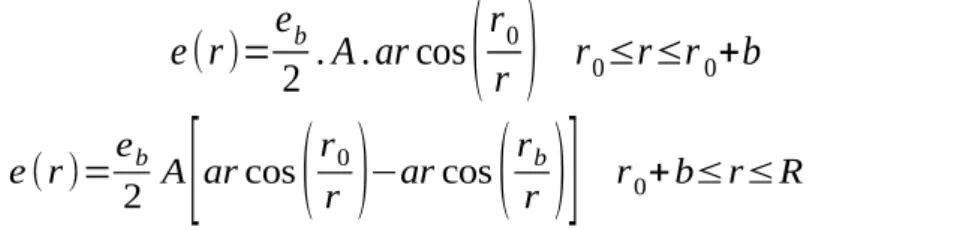
Stang [15] has developed a graphical technique to predict the thicknesses along layers in the dome. This approach is valid only for thin structures with a limited number of layers. Other authors have proposed equations given in two parts, as the formulation proposed by Knoell [16] which is based on the graphical approach of Stang. There are also formulations proposed by Gramoll [17] and by Wang [18]. These equations are given in two parts, taking into account the width of fibre tows, but do not consider the winding angle along the dome. However the thickness of the layer at radius at the dome tangent line (equator) does not correspond to the value of the thickness of the layer introduced into both models (Fig. 7). Both formulations proposed by Wang and Gramoll can be written in the following general form (4.1 and 4.2).
e (r )=
e
b2
. A . ar cos
(
r
0r
)
r
0≤
r≤r
0+
b
(4.1)
e (r )=
e
b2
A
[
ar cos
(
r
0r
)
−
ar cos
(
r
br
)
]
r
0+
b≤r≤R
(4.2)
eb the thickness of a fibre tow which is constant, rb the radius within one-band width and A
coefficient dependent on winding parameters.
We propose to calculate the coefficient A from the thickness observed at the dome tangent line. At the dome tangent line, the thickness is two times the thickness of a tow. It is calculated by the following equation:
e (R )=2e
b=
e
b2
A
[
ar cos
(
r
0R
)
−
ar cos
(
r
bR
)
]
(5)
SoA=
1
2 .
[
ar cos
(
r
0R
)
−
ar cos
(
r
bR
)
]
(6) The thickness is then calculated from equations (4.1 and 4.2), with the coefficient A is described by the equation (6).But it is noted that there is a sharp thickness peak near one-band width (Fig. 7), Wang [18] proposed to refine the thickness along the dome with a spline cubic spline function. So a cubic spline function is then used to refine dome thickness along dome. The equation (7) is used to refine the dome
thickness described by the proposed formulation (4.1 and 4.2).
e(r)=ar
3+
br
2+
cr+d
(7)
The parameters a, b, c and d are obtained from the following conditions: Equation 1: thickness at turnaround radius r0.
Equation 2: thickness at two-band width r2b.
Equation 3: derivatives of thickness equations at two-tow width r2b.
Equation 4: Constant material volume in the dome.
The helical layers that cover the dome part have +14% of fibre volume than the reference value, with the exception of the last deposited layer that has only +7% more than the reference value. These layers are more compacted since the amounts of all fibre tow do not change along the dome. Furthermore the thickness should be reduced by a factor representing the compacting percentage of each layer.
This compacting factor is taken equal to 0.86 representing a 14% of compacting of the thickness of the layers. For the last dropped off layer, the compacting factor is taken equal to 0.93 representing a 7% of compacting of the thickness.
65 67 69 71 73 75 77 79 81 0 0,5 1 1,5 Wang equation Gramoll equation Clairaut equation Abaqus equation model Actual equation Radius (mm) D om e th ic kn es s (m m )
Figure 7: predicting dome thickness of composite pressure vessels: Comparison of several analytical models
3 STRUCTURING MODEL OF WOUND COMPOSITE VESSEL DOME
The structure of the composite vessels dome is done by successive addition of layers. This means that each calculation of a layer is based on the calculation of the previous layer. In fact the determination of the geometry depends on the surface of revolution of the composite vessel, that itself depends on the topologies of the previous surfaces of revolution and therefore of the previous determinations. To put another layer we have to add the thickness by calculating the normal points on the surface of revolution.
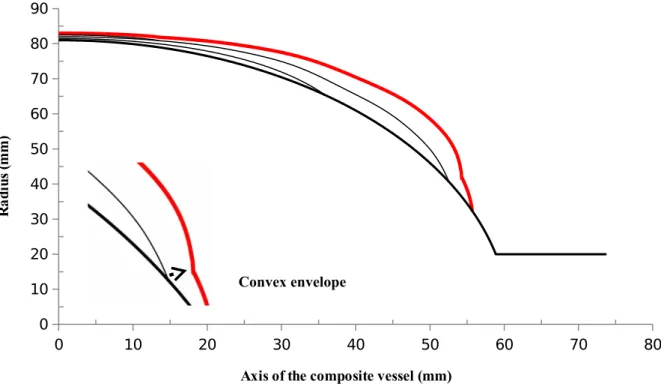
In addition the shape of the end of the previous layer can present a convex shape. This convex shape could pull up to the next layer (Fig. 8). In the figure (Fig. 8) the red line depicts the line of surface of revolution of a deposited layer having a convex area, by consequence of the previous deposited layer. However the shape of dome curve of the filament wound composite vessel is smooth and continuous. The shape of the lines of surface of revolution should be refined, in particular in the convex areas. The absence of the analytical definition of the line of the surface of revolution is a
Tends to infinity
problem to describe the composite vessel dome structure. The approximation of the defining points of the lines of surfaces of revolution may be made through the use of approximation methods which allow interpolating points defined by a polynomial that goes exactly through these points. These methods allow returning in convex areas. Adjusting the defining points of the lines of surfaces of revolution with a N degree polynomial passing closest to the defining points, is also a good alternative, because it is more stable, not time-consuming and simple to implement. In this part we present a structuring model sufficiently reliable to model wound composite vessels dome structure.
0 10 20 30 40 50 60 70 80 0 10 20 30 40 50 60 70 80 90
Axis of the composite vessel (mm)
R ad iu s (m m )
Figure 8: Representation of a surface of revolution having a convex area
The algorithm (Fig. 9) presents the approach to the development of the structuring model. The first surface of revolution corresponds to the profile of the liner which is usually elliptical in the dome part.
To calculate the new line of surface of revolution for a new layer, the surface of revolution of the composite vessel is discretized to defining points along the main axis of the composite vessel.
The position of the end layer is determined by the winding angle in the cylindrical part from the equation (Eq. 3), that allows us to determine the generating line of the new layer. Then the first derivatives are calculated at the point of definition of generating line using finite difference method, to add thickness along the normal at the point considered. The added thickness is calculated using the equations (Eq. 4.1, Eq. 4.2 and Eq. 6).
A compacting factor is then applied at each point to take into account the fibre volume content variation, and thereafter the layer thickness variation.
Then, through normal in points, we find the temporary coordinates of the defining points of the lines of surfaces of revolution of the new layer.
Finally, the final coordinates defining points of the lines of surfaces of revolution of the new layer are determined by fitting the provisional coordinates by a polynomial of degree N.
The new surface of revolution of the composite vessel is actualized including new points of definition.
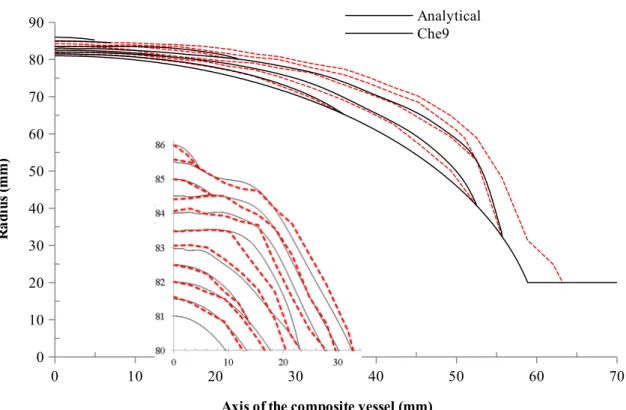
Figure (Fig. 10) shows a correspondence between the results from an observed dome and the prediction structure corresponding to the studied wound composite vessel dome.
Figure 9: Algorithm of the approach to the development of the structuring model 0 10 20 30 40 50 60 70 0 10 20 30 40 50 60 70 80 90 Analytical Che9
Axis of the composite vessel (mm)
R ad iu s (m m )
Figure 10: Overlay of structure prediction model with the results of an observed dome of the composite vessel dome.
4 CONCLUSION:
Unlike other works, the fibre volume content variation according to their position and orientation through the thickness and along composite vessel dome is evaluated.
The variation of the void volume content is also assessed, revealing an evolution of void volume content through the thickness.
This study also allowed us to predict the evolution of winding angles along the composite vessel dome. We note that the equation describing the geodesic winding is well adapted to model the evolution of angles along the dome. An assessment on dome thickness models is made out, focusing on the limits of each model.
A dome thickness model is proposed to predict the thickness of layers in the dome. Indeed, the layers having higher fibre volume content should be compacted according to their fibre volume content, which is a constituent element to accurately predict the geometry of composite vessel dome.
In order to model the structure of wound composite vessels, structuring model of wound composite vessel dome is presented. The results of structural simulation were presented and compared to a measurement. Although there are small differences between the simulation and measurement, general approval is quite good, which is a good basis to simulate the mechanical behaviour of wound composite vessels.
REFERENCES
[1] A. PILATO. Thèse Caractérisation des structures composites bobinées épaisses, application à l’étude du comportement de réservoirs de stockage d’hydrogène, Université de Bordeaux1, 2011.
[2] N.Perry et al, A Thick composite design for hydrogen vessels: A contribution to composite design method. CIRP Ann Manuf Technol.;62:139–142. 2013.
[3] D.LEH. Thèse Optimisation du dimensionnement d’un réservoir composite type IV pour stockage très haute pression d’hydrogène, Université de Grenoble, 2011.
[4] L. Zu, S. Koussios et A. Beukers : Design of filament-wound domes based on continuum theory and non-geodesic roving trajectories. Composites Part A : Applied Science and Manufacturing, 41(9):1312–1320, 2010. Special Issue on 10th Deformation & Fracture of Composites Conference : Interfacial interactions in composites and other applications.
[5] J-S. Park, C-S. Hong, C-G. Kim et C-U. Kim : Analysis of filament wound composite structures considering the change of winding angles through the thickness direction. Composite Structures, 55(1):63–71, 2002.
[6] Abaqus Simulia : Wound Composite Modeler For Abaqus, User’s Manual, version 6.10-1 édition, 2008.
[7] D.Cohen: Influence of filament winding parameters on composite vessel quality and strength. Composites Port A 28A 1035-1047, 1997
[8] R.BLANC. Apport des statistiques spatiales à l'élaboration de critères d'homogénéité et à l'inférence en annalyse de texture. Application à la caractérisation des matériaux. Thèse de doctorat, Université Bordeaux I, Bordeaux, 2007.
[9] M.T.CANN, D.O.ADAMS, C.L. SCHNEIDER: Characterization of fiber volume fraction gradients in composite laminates.J Compos Mater, Vol. 42, N° 5, pp. 447-466, 2008
[10] H. HUANG, R.TALREJA: Effects of void geometry on elastic properties of unidirectional fiber reinforced composites Compos Sci Technol, Vol. 65, N° 13,pp. 1964-1981, 2005
[11] L. LIU,B.M. ZHANG, D.F.WANG , J.Z.WU: Effects of cure cycles on void content and mechanical properties of composite laminates. Composite Structures, Vol. 73, N° 3, 02638223 (ISSN), pp. 303-309, 2006.
[12] S.PACIORNIK , J.R.M. D'ALMEIDA: Measurement of void content and distribution in composite materials through digital microscopy. Journal of Composite Materials, Vol. 43, N° 2, 00219983 (ISSN), pp. 101-112, 2009
[13] Y.LEDRU: Etude de la porosité dans les matériaux composites stratifiés aéronautiques. Thèse de doctorat, Institut national polytechnique de Toulouse, Toulouse, 2009.
[14] C.U. Kim, J-H. Kang, C.S. Hong et C-G. Kim : Optimal design of filament wound structures under internal pressure based on the semi-geodesic path algorithm. Composite Structures, 67(4):443–452, 2005.
[15] D.A. Stang : The use of planar ribbon winding for control of polar build-up in filament-wound tank. Proceedings of 14th SAMPE conference, Cocoa Beach, Florida,14, 1968.
[16] A.C. Knoell : Structural design and stress analysis program for advanced composite filament wound axisymmetric pressure vessel (CMLTRANK), JPL Technical report 32-1521, NASA, 1971.
[17] K.C. Gramol, F. Namiki et J. Onoda : Dome thickness of filament wound pressure vessels. Trans Jpn Soc Aerospace Sci, (100(33) : 66-79), 1990.
[18] R. Wang, W. Jiao, W. Liu et F. Yang : Dome thickness prediction of composite pressure vessels by a cubic spline function and finite element analysis. Polymers and polymer composites, 19(2-3):227–234, 2011.