Science Arts & Métiers (SAM)
is an open access repository that collects the work of Arts et Métiers Institute of
Technology researchers and makes it freely available over the web where possible.
This is an author-deposited version published in: https://sam.ensam.eu
Handle ID: .http://hdl.handle.net/10985/18479
To cite this version :
N ABBASNEZHAD, Mohammadali SHIRINBAYAN, Abbas TCHARKHTCHI, Farid BAKIR - In vitro
study of drug release from various loaded polyurethane samples and subjected to different
non-pulsed flow rates - Journal of Drug Delivery Science and Technology - Vol. 55, p.1-12 - 2020
Any correspondence concerning this service should be sent to the repository
Administrator : [email protected]
In vitro study of drug release from various loaded polyurethane samples and
subjected to different non-pulsed flow rates
N. Abbasnezhad
a,b,∗, M. Shirinbayan
a, A. Tcharkhtchi
b, F. Bakir
aaArts et Metiers Institute of Technology, CNAM, LIFSE, HESAM University, 75013 Paris, France bArts et Metiers Institute of Technology, CNAM, PIMM, HESAM University, 75013 Paris, France
Keywords:
Drug loaded polyurethane In vitro approach Controlled release Flow effect
A B S T R A C T
Drug-eluting implants with a polymeric matrix are currently widely used and the interest of modeling their behavior is increasing. This article aims to present preliminary results of an in vitro under steady flow, study the behavior of drug-loaded polyurethane samples used as drug delivery matrices. Polyisocyanate and polyol synthesis supplied the polyurethane studied in this work. A molding and heat at 50 °C for about 30 min make it possible to prepare films from these components. The prepared samples are placed in the impermeable Plexiglas tube and they are in contact with the medium (distilled water). Tests have been performed without flow and three other cases with steady flow, at a temperature of 37 °C. The substance active incorporated in these films, as the drug, for carrying out the release tests is the C20H24C12N2O3. This drug supplied in granular form is
com-posed of a mixture in the following proportions, 15 mg of diclofenac epolamine and 50 mg of diclofenac-sodium. Four sample variants were carefully prepared: pure-PU and PU loaded in a mass ratio of 10, 20 or 30%. Weighing, DSC, FT-IR, and DMTA are the methods used to analyze the samples. In addition, SEM micrographs are used to explore qualitatively the microstructure during the release tests. The kinetics in vitro of the drug release and water absorption by the polyurethane films are discussed in detail. The results show that these two quantities depend on the initial drug loading and the flow rate value, as a function of the in vitro incubation time.
1. Introduction
Drug release and associated kinematics represent a key issue in various applications in the industrial fields of nutrition, biology, therapy, cosmetics, pharmacy, and coatings. The targeted drug ad-ministration and control of the corresponding time-release demand sophisticated technological development [1]. There are different ways of drug delivery. Orally [2], localized, magnetic or transdermal [3–5]. The controlled release of drugs is conditioned by certain aspects to increase the effectiveness of the therapy. These include, for example, the evolution and period of release, and the accuracy of the location of the drug carrier [6]. Therefore, the challenges encountered in this area of research are to minimize the risk of overall toxicity, to reduce side effects and to improve the efficacy of treatment [7]. Depending on the types of drug delivery, various carriers may be considered. Polymeric delivery agents are becoming increasingly important because of the several possibilities they offer. The permeability of the polymer matrix, glass transition temperature, viscosity, degradation, and polymer
concentration represent the effective parameters that regulate the re-lease of the drug through the matrix [2]. Hydrophilic polymers are good candidates here because they are provided with pores facilitating the release of the drug, particularly in the case of poorly soluble drugs. Because of its biocompatibility, biodegradability, good mechanical properties, strength, elasticity, non-toxicity and reasonable price, polyurethane is the most widely used polymer [8,9]. In biological ap-plications, the polyurethane is employed in the form of films, foams, and composites [10,11]. For example in Ref. [12], Shin et al. have used the polyurethane films as a stent coating for cancer therapy. They confirmed the importance of the initial drug loading on the release rate and the lag time. Burst release is more prevalent in the case of a film with a high initial drug load compared to a low load film. In many studies [8,13,14,15,and16]], the polymer films are prepared in the form of a composite mixed with various drugs like anti-inflammatories (Cefazolin, Naltrexone and Piroxicam), anti-thromboses, im-munosuppressants, anti-proliferative … In the study [17], King et al. have studied release of Gentamicin from magnesium foams in the
∗Corresponding author. Arts et Métiers ParisTech, DynFluid, 151 Boulevard de l'Hôpital, 75013, Paris, France.
E-mail addresses:[email protected],[email protected](N. Abbasnezhad),[email protected](M. Shirinbayan), [email protected] (A. Tcharkhtchi), [email protected] (F. Bakir).
orthopedic implants. The results showed the drug release for the im-plants of 25% of Gentamicin was more prominent than for 10%. The release kinetics of the drug is also dependent on the aqueous solubility, the chemical structure and physicochemical properties of the drug [18,19]. It is considered that drugs with high solubility release faster than drugs with low solubility. In the study [20], Chen et al. have studied the Gefitinib release from various drug-loaded PU foams. They have concluded the drug was released with a diffusion mechanism, where it was observed that the drug release rate is increased with the drug content. There are some devices to better control drug release profiles, like the use of drug delivery carriers [21], micro-sponges for hydrophobic drugs [22], or the use of barriers layers of a polymer without drug [16,23]. In the study [13], Vahedi et al. have revealed that the flow conditions influence the release profile by acting on the penetration depth of the fluid. Many other studies have also revealed this effect [24–26]. Depending on the property of degradation, me-chanisms of release can be distinct. In the case of durable polymers, the dominant release mechanism is assumed diffusion, where factors like polymer thickness, percent drug, polymer permeability, drug solubility in the polymer and properties of fluid are influential factors [27–30]. In a study by Gao et al. [31], on the release of the Antituberculosis drugs from nanoparticles tested at various mediums with different pH, it was mentioned that the release rate in the acidic medium was the higher. For the biodegradable polymer in addition to the diffusion mechanism, other mechanisms such as swelling or hydrolysis may be present. It should be mentioned that the hardness, the friability [32] and the composition of the carriers, affect the mechanisms of release [33]. In most cases, the temperature is considered constant to body temperature (37 °C). However, in Ref. [34] Ye et al. found that the increase in temperature significantly changed the drug release profile from PLGA progesterone microspheres, because of mechanism change. In the dif-fusion-controlled system, the drug is released through the pores, poly-meric membranes and chains. In the diffusion-controlled system, the release is dependent on the concentration of the drug in the matrix. In
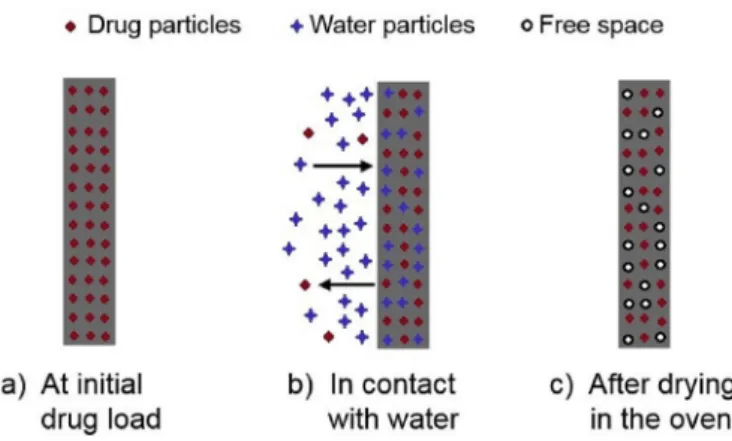
this case, the drug is homogeneously dispersed in the matrix. Indeed, the release of the drug away from the release surfaces, the water or the medium, takes longer to migrate through the thickness of the polymer [2,35]. This study is applicable in all cases of drug delivery as stents, ear pads, patches, and contact lenses [6,34,36–41]. In all these cases, some parameters have importance like the geometry of the drug holders, glass transition temperature, viscosity, drug percentage, drug type, coating thickness, and release kinetics [6,28]. For matrix-type devices drug release is more likely to be diffusion-driven which is as-sociated with the concentration gradient, diffusion distance and degree of swelling [42]. In this study, polyurethane is considered as matrix type devices. Drug particles are dispersed in the matrix (Fig. 1). When the samples are placed in the aqueous medium, water diffuses into the polymer. This phenomenon is likely related to the thickness, perme-ability of PU and drug concentration gradient. In this article, the polyurethane-based films with some percentages of Flector are utilized to prolong and to regulate the release of drug at different flow rates. The organization of this work is as follow: sample preparation, test equipment and procedure of measuring are presented, the essential physicochemical characteristics and microstructure of polyurethane and diclofenac epolamine through different tests are presented. In ad-dition, the results taking into account the effects of the percentage of the drug and the flow rate values are presented. At the last section of the paper, particular attention is devoted to the analysis of the phe-nomenon.
2. Materials description
2.1. Preparation of the polyurethane (PU)
Polyurethane represents the exclusive type of polymer that can belong to the families of thermoplastics, elastomers, and thermosets. Its synthesis is from the reaction between a component of each family of polyols and diisocyanate. The choice of components and of the synth-esis process delivers the prepared polyurethane for the desired specific properties [43]. Because of this assortment, PU is used in many pro-ducts like adhesives, coatings, vehicle parts, sponges, implants and biological devices and organs [44]. The polyurethane prepared in the present work is durable. It is a result of the synthesis of hardener consists of Isocyanate type 4,4-diphenylmethylene diisocyanate (MDI) and resin composed of polyol, dye, and catalyst. The ultimate product consists of a mixture of the resin and the hardener in a ratio of five to two, giving to the instructions provided in the supplier's manual. All of these products are purchased from the RAIGI Company. The manu-facture of a film of this polymer gets by molding and heating in an oven at 50 °C for about 30 min.
2.2. Diclofenac epolamine, flector
The substance incorporated in PU samples for drug release
Fig. 1. Schematic diagram of drug transport.
experiments is diclofenac epolamine with the trade name of Flector®. Diclofenac supply a nonsteroidal anti-inflammatory drug (NSAID). Epolamine is a pharmacologically inactive salt manipulated here to saline diclofenac, consequently improving its hydrophilic and lipophilic
potencies. The Flector is, therefore, an interesting substance to ad-minister [45]. Its chemical formula is C20H24Cl2N2O3. The used Flector
supplied by the Genevrier laboratory. It is supplied in granular form and is composed of 65 mg of diclofenac epolamine including 50 mg of diclofenac sodium and its density is about 450.7 mg/ml. The solubility of Flector in the water at 25 °C is about 2.37 mg/l [17]. In a study by Ahnfelt [46], they have seen that increasing the stirring rate in the aqueous solution increases the transport of the diclofenac.Fig. 2shows the chemical formula of the diclofenac epolamine and polyurethane. 2.3. Preparation of the PU samples loaded with the flector
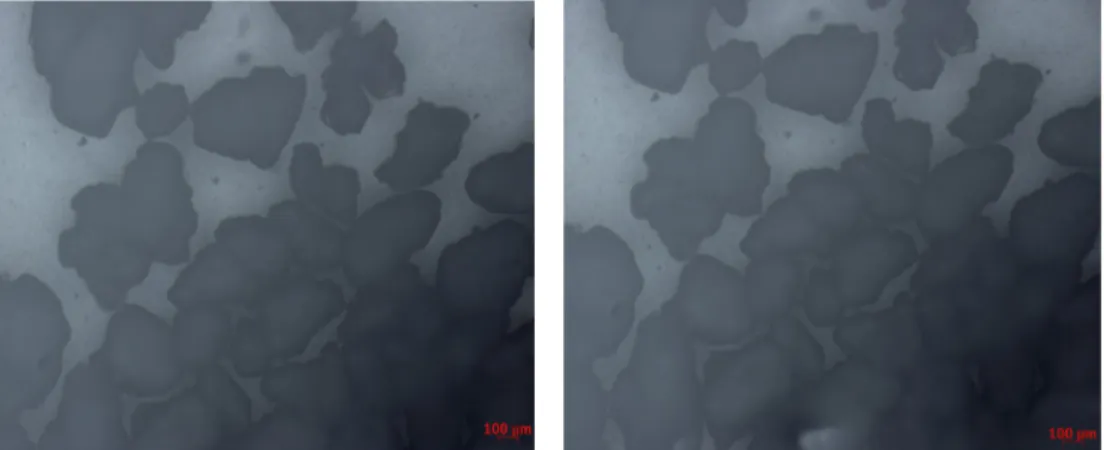
For drug release experiments, we opted for the thin polymer film option of approximately 2 mm. The process of preparing the loaded polymer films is similar to that mentioned in section2.1for making ready of the unloaded polyurethane. Except, that of the initial pre-paring of mixtures, which are containing a certain dose of Flector. For each prepared mixture, the maintenance of the Flector dose in granules form was monitored. Indeed, it has been unobserved of dissolving of this substance in the polymer, especially in the polyol.Fig. 3proves this observation. Four sample variants were carefully prepared: pure-PU and PU loaded with of the Flector in a mass-ratio of 10, 20 or 30% of
Fig. 3. Optical microscopic observations of the diclofenac epolamine mixture with the polyol a) before and b) after 30 min in the oven at 50 °C.
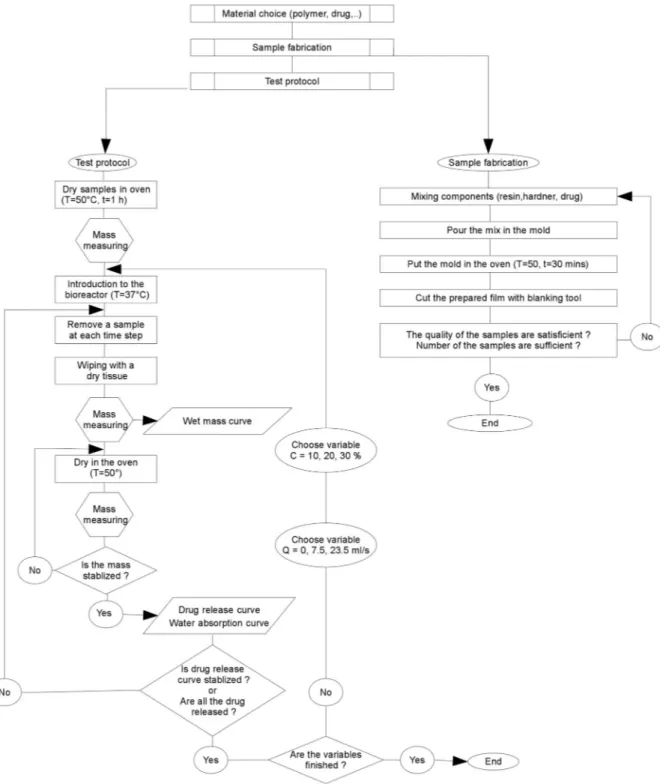
Fig. 4. Schematic pictures of the fabrication of PU samples loaded with the Flector. Mold and blanking tools of the samples.
Fig. 5. Test bench components flow-less case and steady flow case 1) Pump 2) Electrical engine of the pump 3) Electronic controller of the pump 4) Reservoir 5) Inverter 6) Feeding pipe 7) Ramp 8) Test tube/specimen 9) Shut-off valve 10) Arterial segment 11). Connections (of the specimen to the circuit) 12) Fluid return manifold 13) By pass 14) Adjustable cross-section restriction 15) Pressure sensor of the pump 16) Flow sensor 17) Pressure con-troller 18) Feeding environment 19) and 20) Means of sampling 21) Temperature controlled enclosure.
the polymer film. The finals samples fabricated are of the dimensions 30×5×2 mm3, cut employing with the cutting tool shown inFig. 4.
3. Experimental procedure 3.1. Test bench components
Fig. 5shows the test bench used in the distinct cases of flow rates, from flow less to the highest flow rate. Valves are operated to regulate
this flow rate. The capacity of the tank used represents 10 L liters of liquid. Every 2 days of use, this volume is refreshed to eliminate the risk of saturation.
3.2. Measuring protocol
The three principle steps of the elaborated protocol for measuring the amounts of drug release and water absorption describe below. This is a gravimetric method where each test has been repeated three times
to make sure its repeatability. In the first step, the unloaded and un-loaded samples are dried in the oven at 50 °C for 1h to remove any absorbed moisture. Then they were placed in a desiccator to cool. Immediately upon cooling the specimens are weighed (m0) by using
balance with the precision of 10 μm. The second step is to place the samples in vitro. After an established time for each sample, these samples are collected from the test, for beginning the ultimate step. The third step consists to wipe the surface of the taken samples with a dry cloth to remove any water present. These samples then weighed (m1)
and placed in an oven at 50 °C to extract the absorbed water during the stay in vitro. Drying in the oven maintained until the mass of the sample is stabilized. At this time, the mass of each sample recorded again (m2). Fig. 6schematizes this measuring protocol. The experiments were peated in triplicate and the mean value ± standard deviation is re-ported in the results.
Calculation formulas of wet mass, water absorption and drug release are presented as following:
= m m × m Wet mass (%) 1 0 100 0 (1) = m m × m Water absorption (%) 2 1 100 0 (2) = m m ×
initial mass of drug Drug release(%) 2 0 100
(3) Where m0represents the sample mass in the initial state; m1the mass
after drying with tissue and m2the mass after drying in the oven.
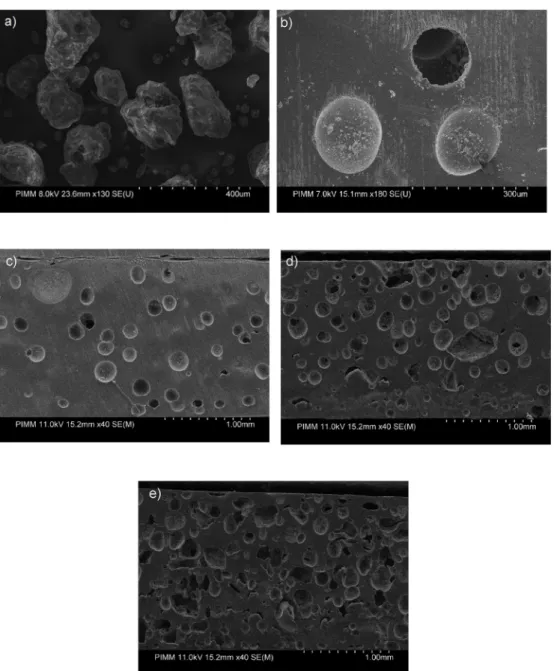
Fig. 7. SEM micrographs: a) Flector b) PU+10%wt (300 μm) c) PU+10%wt (1 mm) d) PU+20%wt (1 mm) and e) PU+30%wt (1 mm) from the thickness side of the samples after 1 h of the test.
Fig. 8. DSC results: a) Polyurethane b) Flector c) components of polymer and mixed with drug d) PU loaded 10% mass of Flector and e) PU loaded 20% mass of Flector at various times of flow-less state test.
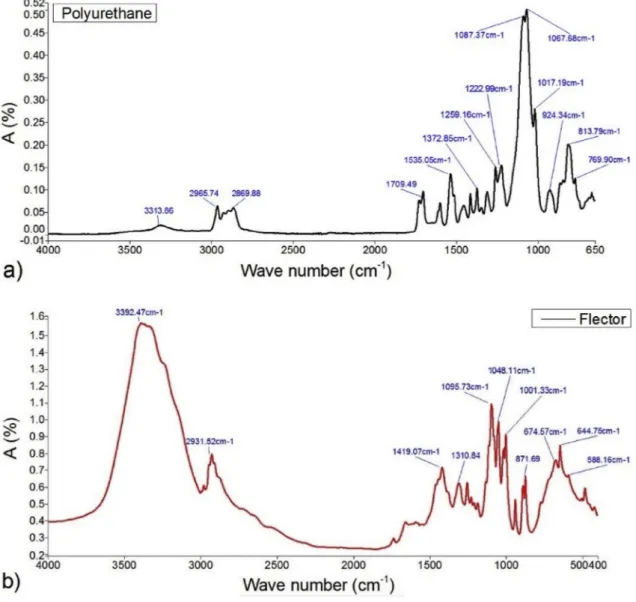
Fig. 10. IR results of a) pure polyurethane and b) Flector.
3.3. Characterization methods
•
Microscopic observations: Scanning Electronic Microscope “HITACHI 4800 SEM” uses to investigate qualitatively the evolution of the samples microstructure during the test.•
Differential Scanning Calorimetry test, DSC: DSC Q10 V9.0 appa-ratus is utilized to find out the heat exchange evolution, of the near the glassy temperature up to the melting point. A slight piece of 6,2 mg of each sample and the Flector placed in hermetic aluminum capsules, are first equilibrated at −60 °C or 25 °C, respectively. Then heated at a rate of 5 °C/min up to 200 °C or to 250 °C. This process replicated two times successively for each sample to elim-inate the thermal history effect of the material.•
Dynamic thermomechanical analysis, DMTA: For DMTA tests the device Dynamic Mechanical Analyzer type Q800 V21.2 was used. The dimensions of the rectangular specimens are approximately 30×5×2 mm3. The tests are carried out over the entire temperature
range of the apparatus at −100 to 200 °C with the step of 2.00 °C/ min, at frequency of 0.1 Hz, and at constant amplitude. The storage and loss modulus are measured fitting to the temperature, and their corresponding values are calculated in this way.
•
Fourier transform infrared spectroscopy (FTIR): For FTIR the mea-surement method employing a potassium bromide (KBr) powder transmission technique is the one used to produce the infrared spectra of the Flector granules and for the polyurethane samples loaded with drug granules reflection method is the methods which is used.•
Gravimetric analysis: The samples weighed with the “Mettler H35AR” balance with an accuracy of 0.1 mg.4. Experimental procedure 4.1. Characterization methods 4.1.1. Analysis of the microstructure
Fig. 7shows the micrographs of Flector, pore sizes in the PU+10% wt and polyurethane loaded samples after 1 h of the test.Fig. 7(a) shows that the average size of the Flector particles is about 40 μm. ComparingFig. 7(a) and (b) indicates that the size of the pores is rather equal to the Flector particles. Micrographs 7 (b), (c), (d) and (e), in-dicate for the drug-loaded samples that:
•
Mass loss is followed by rapid release of the drug;•
For very low concentrations of drug, some particles can be isolated in the matrix and so not ever come into contact with the water;•
The pores are unconnected to each other;•
The created voids are more for the more elevated concentrations;•
A risk of percolation exists for the samples of higher drug; the voids are closer, and the possibility of a connection between these spaces is included to the fact that it establishes the connection for the cir-culation of the liquid, which causes the rapid release of the medi-cine. In conclusion, the size, concentration and distribution of the drug particles in the matrix represent factors that may affect the drug release.•
However, the porous matrix is helping release of the drug from the matrix [47] but its optimized content depends to the aim of the use. 4.1.2. DSC analysisTo investigate the heat exchange evolution of PU polymer and Flector with the temperature variations, DSC technique is used.
Fig. 8(a) shows PU has any transition around 37 °C. Since it is an amorphous polymer, it does not provide a crystalline temperature or a melting point. Therefore, its thermal stability is compatible with body
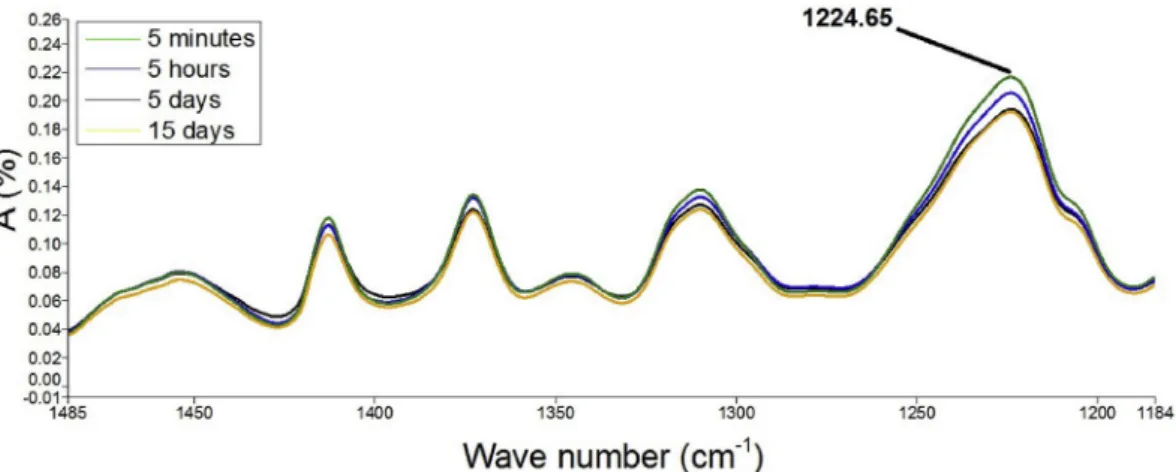
Fig. 12. IR results of samples with PU+10% of Flector after quasi-static test.
Fig. 13. Height of peak (1224.65) from IR results for the samples of PU+10%, PU+20% and PU+30% of drug at flow-less state test.
temperature. Fig. 8(b) shows that Flector includes an endothermic phase transition near to 100 °C.Fig. 8(c) shows respectively three DSC results; a drop of polyol alone, a drop of the polyol with the drug, and a drop of polyol, isocyanate, and drug. These results make it possible to assert there is no chemical reaction between the drug and the polymer and in particular between the polyol and the drug. Indeed, all the peaks observed indicate there is phase separation between the drug and the polymer. The unique reaction observed is that of the synthesis of the polymer corresponding to the peak present at 50 °C and shown in a dashed red line. DSC result of Flector shows a peak at 100 °C.
Fig. 8(d) and (e) show the amplitude of the Flector peak for a flow-less test. This peak decreases with the incubation time and it is pre-sented for two concentrations, 10% and 20% mass of Flector. The amplitude of this peak is an indicator for evaluating the concentration of the drug in the polymer.
4.1.3. Dynamic thermo-mechanical analysis
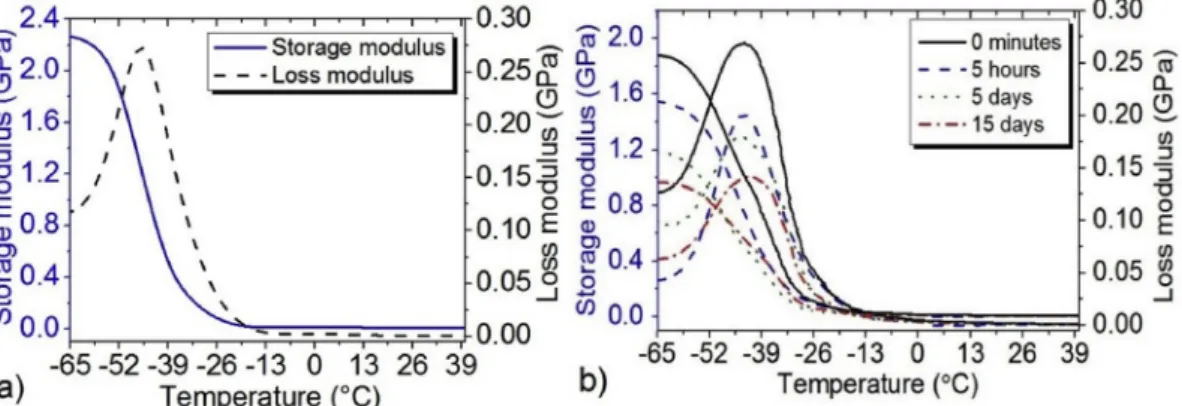
Fig. 9(a) shows the DMTA results of the PU over a temperature range of −65 to 25 °C. The storage modulus decreases sharply after −43 °C and stays practically constant close of −20 °C. The glass transition temperature identified at about −43 °C the material does not have any transition near the body temperature. For the PU loaded of 10% mass of Flector, Fig. 9(b) shows that the glass transition tem-perature does not change during the tests at the flow-less state and at various times.
In addition, water absorption and drug release have not any effect on the glass transition temperature. In contrast, one can note the
decrease of the modulus in accordance to the time of the flow-less test for the samples of 10% of Flector at 37 °C. By comparingFig. 9(a) and (b) one can note that by adding 10% of drug to the polymer the mod-ulus of the polymer is decreasing from 22.7 GPa to 1.89 GPa, which can affect the maintenance of the drug in the polymer by changing the drug quantity. As the complex modulus is an indicator of how efficiently a material loses energy to molecular rearrangements and internal fric-tion. Therefore, can give an idea to determine how well a material will stand up.
4.1.4. Infrared spectroscopy (IR)
Fig. 10shows the infrared spectra of the polyurethane and Flector, some peaks are presented. The important peaks related to Flector are as follow: 3392 cm−1 related to the N–H amine stretching bound,
1419 cm−1 relates to C]O carboxyl ion and 644 cm−1 for C–Cl
stretching movement. A question is therefore submitted: would this property allow differentiating the samples agreeing to their drug-loading rate? To respond this question, the IR spectrum of a pure-PU sample is compared inFig. 11with that of a charged PU, for example, 10% mass of Flector. As can be seen, there are differences in amplitude between the emerging peaks of each of the two spectra. By way of example, mention may be made chiefly of those identified at the fol-lowing wavelengths: 3315, 1710, 1535, 1225 and 820. Other peaks between 400 and 1500 are not clearly visible in the spectra since all the characteristic peaks of drug and PU are also in that region. However, peak shifts can be visible. In the similar way, one can also compare the spectra of the same sample analyzed at different in vitro times.Fig. 12
illustrates this result for the peak corresponding to the 1225 wavelength of the PU sample loaded with 10% mass of Flector. It can be detected that the amplitude of this peak decreases with time. A comparison between the spectra of three differently loaded samples is also pro-posed.Fig. 13compares the amplitudes of the peak corresponding to the wavelength 1225 of PU samples loaded with 10%, 20% and 30% mass of Flector at the flow-less state for different time steps of the test. Notable differences are observed at various times in vitro. The peak amplitude of the samples with higher percentage of drug decreases more rapidly with time. In conclusion, it is patent the IR analysis could represent a relevant tool to study the drug release.
4.2. Effect of drug content on drug release and water absorption
This study was regarded around the release kinetics and possible mechanisms with considering the effects of various percentages of drug (10, 20, 30% of Flector) at the temperature of 37 °C in flow-less and continuous state with different flow rates from the blood flow at the rest time 6.5–7.5 ml/s up to the exercising time 23.5 ml/s.
4.2.1. Flow-less tests
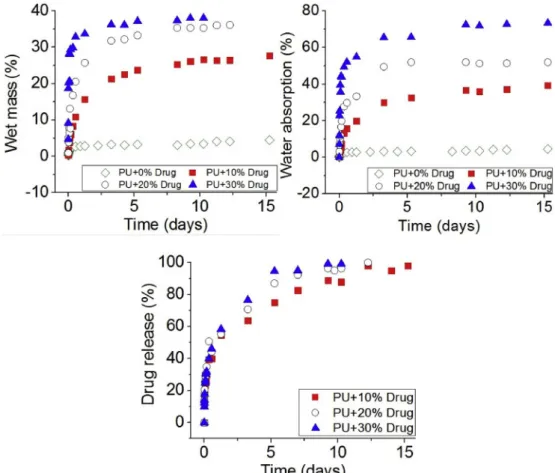
Fig. 14(a) shows the wet mass of the samples, which is the mass variation, related to the competition between increase of the mass be-cause of the water absorption and decrease of the mass bebe-cause of the dug loss.Fig. 14(b) shows the water absorption rates for four various
cases, pure-PU and PU with drug loading 10, 20 and 30% mass of Flector. It is mentioned that the water penetrates even in the pure-polymer, but with a modest value, close 5%. In contrast, for the loaded PUs this rate increases with the initial drug rate. It reaches 70% rate of the water absorption for the most loaded case. The presence of the drug, therefore, plays a leading role in the absorption of water. This is true that the hydrophilic property of the chosen drug is high. It is notable that the values in the percentage of water absorption is affected also by the difference of the density of water and diclofenac which are re-spectively 997 and 450.7 mg/l where they are occupying the same space but with a heavier weight for the water.Fig. 14(c) shows the drug release ratios for the three loaded PU cases. Comparing the three curves of the PU with 10, 20, and 30% of drug, it is apparent that along with increasing the drug content there is a decrease in the maximum time of the release. For the samples, which receive the significant increase of the peak during the premier days of experiment further, they have high decrease in the mass. Which means that samples with significant per-centage of drug absorb more perper-centage of the water (initial period of the curve) and then substance which has absorbed water has left the polymer matrix with the water so the sample is influenced by the mass decrease relating to the drug release (secondary period of the curve). To highlight the water absorption phenomenon and drug release behavior of PU with various percentages of drug, different analysis has been performed. Error bars have not been shown as they are hidden behind the symbols. Note that the maximum standard deviation is about 3.1%
and minimum is about 0.08% wherein the average is about 1.8%. 4.2.2. Steady flow tests
The results of wet mass, water absorption and drug release for continuous condition, Q = 7.5 ml/s are presented inFig. 15. In this figure, one can note the effect of the drug charge on the results. Com-paring the results of the water absorption for the tests with the flow rate of 7.5 ml/s and with different percentage of drug, it indicates water can penetrate into the polymer about 32% in the case of PU with 10% drug, and it is slowly increasing by the drug percentage to 56% PU with 30% drug. From the slope of second part of the curve, one can note the same mechanism of drug release in this condition at different drug percen-tage Fig. 15(c). Globally, the same behavior of water absorption and drug release can be seen in continuous case and flow-less state one. Evidently, in the case of continuous tests, the time is the scale of hours.
Fig. 16is representing the effect of flow rate on the wet mass, water absorption and the drug release of the samples with 10% of the drug.
Fig. 16(a) illustrates there is not high differences in wet mass of the numerous samples at various flow rates for PU with 10% drug.
Fig. 16(b) illustrates there is not high differences in water absorption of the numerous samples at various flow rates for PU with 10% drug.
Fig. 16(c) indicates the effect of the flow rate on the drug release. One can note that by increasing the flow rate the rate of the drug released in accordance to the time is increasing. It is notable to indicate that the applied parameters (drug percentage and flow rate) have changed the
release behavior but to note about the effect of these parameters on the whole objective which is the therapy of the diseased area, it is better to further study it in the tissue area for seeing the biological effect of these parameters. In a study by McKittrick et al. [48] they have resulted that although the medicament in high dose stents don't stay a long time in the stent comparing to the low dose, but it stays longer time binded to the receptors in the tissue, which are evidently depending to the bio-logical characters of the drug and the tissue.
5. Conclusions
Polyurethane-based films loaded with different doses of Flector are used to study the drug release as well as the water absorption under various flow conditions. SEM analysis of Flector granules showed that the average particle size of this drug was about 40 μm. Two families of tests were considered: case with steady flow and flow-less. The results show that water absorption by pure polyurethane is also present in this case, but with a low rate, about 5%. This rate increases with drug loading which can reach up to about 65% of the sample mass. Additionally, the rate of the released drug increases with the drug loading, and it is increasing with the flow rate. Several mechanisms can account for the increment in relative release rates at increasing drug loading, such as faster water influx and hence faster dissolution at higher drug loading (because of osmotic effects) or connectivity of drug loaded particles.
[1] Sudipta Senapati, Arun Kumar Mahanta, Sunil Kumar, Pralay Maiti, Controlled drug delivery vehicles for cancer treatment and their performance, Signal Transduct. Targeted Ther. 3 (1) (2018) 1–19.
[2] Gaganjot Kaur, Jasleen Grewal, Kiran Jyoti, Upendra K. Jain, Ramesh Chandra, Jitender Madan, Oral Controlled and Sustained Drug Delivery Systems, Elsevier Inc., 2018.
[3] Sean McGinty, Giuseppe Pontrelli, A general model of coupled drug release and tissue absorption for drug delivery devices, J. Control. Release 217 (2015) 327–336. [4] Muhammad Shoaib, Ali Bahadur, Muhammad Saif, Shahid Iqbal, Muhammad Ifzan,
Muhammad Asif, Tahir Mahmood, Sustained drug delivery of doxorubicin as a function of pH, releasing media, and NCO contents in polyurethane urea elastomers, J. Drug Deliv. Sci. Technol. 39 (2017) 277–282.
[5] Jamal Alyoussef, Ahmad Ajwad, In vivo and in vitro study of transdermal appli-cation of diclofenac sodium using nonionic microemulsions as colloidal drug de-livery systems, J. Drug Deliv. Sci. Technol. 43 (2018) 27–33.
[6] Karsten Mäder, Eric Lehner, Arne Liebau, Stefan K. Plontke, Controlled drug release to the inner ear: concepts, materials, mechanisms, and performance, Hear. Res. 368 (2018) 49–66.
[7] A. Meera Moydeen, M. Syed Ali Padusha, Eman F. Aboelfetoh, Salem S. Al-Deyab, Mohamed H. El-Newehy, Fabrication of electrospun poly(vinyl alcohol)/dextran nanofibers via emulsion process as drug delivery system: kinetics and in vitro re-lease study, Int. J. Biol. Macromol. 116 (2018) 1250–1259.
[8] M.V. Grigoreva, Polyurethane composites as drug carriers: release patterns, Biotechnol. Acta 6 (5) (2015) 41–48.
[9] Michael B. Lowinger, Stephanie E. Barrett, Feng Zhang, Robert O. Williams, Sustained release drug delivery applications of polyurethanes, Pharmaceutics 10 (2) (2018) 1–19.
[10] Marta Casas, Eduardo Galdón, Diego Javier Ojeda, Isidoro Caraballo, Thermoplastic polyurethane as matrix forming excipient using direct and ultrasound-assisted compression, Eur. J. Pharm. Sci. 136 (February) (2019) 104949.
[11] Seung Ho Lee, Byung Hwi Kim, Chun Gwon Park, Cheol Lee, Byung Yoon Lim, Young Bin Choy, Implantable small device enabled with magnetic actuation for on-demand and pulsatile drug delivery, J. Control. Release 286 (July) (2018) 224–230. [12] Moon Sam Shin, Ji Yeon Hong, Sangsoo Park, Gemcitabine release behavior of
polyurethane matrixes designed for local anti-cancer drug delivery via stent, J. Drug Deliv. Sci. Technol. 22 (4) (2012) 301–306.
[13] S.M. Vahedi, M.S. Valipour, F. De Monte, An advection-diffusion multilayer porous model for stent drug delivery in coronary arteries, J. Comput. Appl. Res. Mech. Eng. 9 (1) (2018) 1–18.
[14] Purandhi Roopmani, Uma Maheswari Krishnan, Harnessing the pleiotropic effects of atorvastatin-fenofibrate combination for cardiovascular stents, Mater. Sci. Eng. C 92 (July) (2018) 875–891.
[15] Seong Min Kim, Kwang Sook Park, Eugene Lih, Young Joon Hong, Jong Hee Kang, Ik Hwan Kim, Myung Ho Jeong, Yoon Ki Joung, Dong Keun Han, Fabrication and characteristics of dual functionalized vascular stent by spatio-temporal coating, J. Acta Biomater. 38 (2016) 143–152.
[16] Fengqin Li, Yiqing Gu, Rixin Hua, Zhonghua Ni, Gutian Zhao, In vitro release study of sirolimus from a PDLLA matrix on a bioresorbable drug-eluting stent, J. Drug Deliv. Sci. Technol. 48 (June) (2018) 88–95.
[17] David King, Sean McGinty, Assessing the potential of mathematical modelling in designing drug-releasing orthopaedic implants, J. Control. Release 239 (2016) 49–61.
[18] C. Bode, H. Kranz, A. Fivez, F. Siepmann, J. Siepmann, Often neglected: PLGA/PLA swelling orchestrates drug release: HME implants, J. Control. Release 306 (May) (2019) 97–107.
[19] Nicolaos Scoutaris, Feng Chai, Blandine Maurel, Jonathan Sobocinski, Min Zhao, Jonathan G. Moat, Duncan Q. Craig, Bernard Martel, Nicolas Blanchemain, Dennis Douroumis, Development and biological evaluation of inkjet printed drug coatings on intravascular stent, Mol. Pharm. 13 (1) (2016) 125–133.
[20] Weiluan Chen, Chiara di Carlo, Donal Devery, Donnacha J. McGrath, Peter E. McHugh, Kathrin Kleinsteinberg, Stefan Jockenhoevel, Wim E. Hennink, Robbert J. Kok, Fabrication and characterization of gefitinib releasing polyurethane foam as a coating for drug-eluting stent in the treatment of bronchotracheal cancer, Int. J. Pharm. 548 (2) (2018) 803–811.
[21] Sasa Kajdic, Odon Planinsek, Mirjana Gasperlin, Petra Kocbek, Electrospun nano-fibers for customized drug-delivery systems, J. Drug Deliv. Sci. Technol. 51 (January) (2019) 672681.
[22] Ravindranath B. Saudagar, Avinash Darekar, Pooja Pawar, A review on micro-sponge a novel drug delivery system, Asian J. Pharmaceut. Res. 6 (1) (2019) 51. [23] Weiluan Chen, Johanna Clauser, Anja Lena Thiebes, Donnacha J. Mc-Grath,
Nicola Kelly, Mies J. van Steenbergen, Stefan Jockenhoevel, Ulrich Steinseifer, Peter E. McHugh, Wim E. Hennink, Robbert J. Kok, Gefitinib/gefitinib microspheres loaded polyurethane constructs as drug-eluting stent coating, Eur. J. Pharm. Sci. 103 (2017) 94–103.
[24] Pujith R.S. Vijayaratnam, John A. Reizes, Tracie J. Barber, Flow-mediated drug transport from drug-eluting stents is negligible: numerical and in-vitro
investigations, Ann. Biomed. Eng. 47 (3) (2019) 878–890.
[25] Silvia Pisani, Rossella Dorati, Enrica Chiesa, Ida Genta, Tiziana Modena, Giovanna Bruni, Pietro Grisoli, Bice Conti, Release profile of Gentamicin sulfate from polylactide-co-polycaprolactone electrospun nanofiber matrices, Pharmaceutics 11 (4) (2019) 161.
[26] Martínez-de Torre, Van Dijk, S. Frederiek, Van Beek, P. Graham, Res. Collect. 9 (2) (2017).
[27] Zhaowei Chu, Quan Zheng, Meng Guo, Jie Yao, Peng Xu, Wentao Feng, Yongzhao Hou, Gang Zhou, Lizhen Wang, Xiaoming Li, Yubo Fan, The effect of fluid shear stress on the in vitro degradation of poly (lactideco-glycolide) acid mem-branes, J. Biomed. Mater. Res. A 104 (9) (2016) 2315–2324.
[28] Sean McGinty, A decade of modelling drug release from arterial stents, Math. Biosci. 257 (2014) 80–90.
[29] Atefe Rezaei, Ali Nasirpour, Evaluation of release kinetics and mechanisms of curcumin and curcumin–cyclodextrin inclusion complex incorporated in electro-spun almond gum/PVA nanofibers in simulated saliva and simulated gastro-intestinal conditions, BioNanoScience 9 (2) (2019) 438–445.
[30] Madiha Maboos, Rabia Ismail Yousuf, Muhammad Harris Shoaib, Iqbal Nasiri, Tazeen Hussain, Hafiza Fouzia Ahmed, Wajiha Iffat, Effect of lipid and cellulose based matrix former on the release of highly soluble drug from extruded/spher-onized, sintered and compacted pellets, Lipids Health Dis. 17 (1) (2018) 1–17. [31] Yuan Gao, Jieyu Zuo, Nadia Bou-Chacra, Terezinha De Jesus Andreoli Pinto, Sophie
Dorothee Clas, Roderick B. Walker, Raimar Löbenberg, In vitro release kinetics of antituberculosis drugs from nanoparticles assessed using a modified dissolution apparatus, BioMed Res. Int. (2013).
[32] Amanda Ng Thing Wei, Ashok Kumar Janakiraman, Kai Bin Liew, Melbha Starlin, Kadhar Mohamed Ebrahim Habibur Rahman Shiek Abdul, The effects of the com-bination of biodegradable and synthetic polymers on the release behaviour of na-teglinide matrix tablets, J. Excipients Food Chem. 10 (1) (2019) 13–22. [33] Katarzyna Jelonek, Joanna Jaworska, Malgorzata Pastusiak, Michal Sobota,
Jakub Wlodarczyk, Paulina Karpeta-Jarzabek, Bo»ena Kaczmarczyk, Janusz Kasperczyk, Piotr Dobrzy«ski, Effect of vascular scaffold composition on release of sirolimus, Eur. J. Pharm. Biopharm. 132 (April) (2018) 41–49. [34] Mingzhu Ye, Hongliang Duan, Lixia Yao, Yicheng Fang, Xiaoyu Zhang, Ling Dong,
Feifei Yang, Xinggang Yang, Weisan Pan, A method of elevated temperatures cou-pled with magnetic stirring to predict real time release from long acting proges-terone PLGA microspheres, Asian J. Pharm. Sci. 14 (2) (2019) 222–232. [35] Arash Khorrami Jahromi, Hamed Shieh, Maryam Saadatmand, Theoretical study of
diffusional release of a dispersed solute from cylindrical polymeric matrix: a novel configuration for providing zero-order release profile, Appl. Math. Model. 73 (2019) 136–145.
[36] M. Gehrke, J. Sircoglou, D. Gnansia, G. Tourrel, J.F. Willart, F. Danede, E. Lacante, C. Vincent, F. Siepmann, J. Siepmann, Ear Cubes for local controlled drug delivery to the inner ear, Int. J. Pharm. 509 (1–2) (2016) 85–94.
[37] Jinsong Hao, S. Kevin Li, Inner ear drug delivery: recent advances, challenges, and perspective, Eur. J. Pharm. Sci. 126 (February 2018) (2019) 82–92.
[38] Hye-Yeong Tak, Yeon-Hum Yun, Chang-Moon Lee, Soon-Do Yoon, Sulindac im-printed mungbean starch/pva biomaterial films as a transdermal drug delivery patch, Carbohydr. Polym. 208 (2019) 261–268.
[39] P. Karunakar1 Nallan CSK Chaitanya, Pratima Soni, Komali Garlapati,
Mounika Yeladandi, Pallavi Bidari, A comparative evaluation of diclofenac sodium transdermal patch, oral diclofenac sodium with intramuscular injections of diclo-fenac sodium in patients suffering from oral pain: a randomized control trial, Int. J. Pharm. Investig. 7 (3) (2017) 47–59.
[40] K. Hsu, S. Gause, A. Chauhan, Review of ophthalmic drug delivery by contact lenses, J. Drug Deliv. Sci. Technol. 24 (2) (2014) 123–135.
[41] Cesar Torres-Luna, Naiping Hu, Abdollah Koolivand, Xin Fan, Yuli Zhu, Roman Domszy, Jeff Yang, Arthur Yang, Nam Sun Wang, Effect of a cationic sur-factant on microemulsion globules and drug release from hydrogel contact lenses, Pharmaceutics 11 (6) (2019) 262.
[42] Lynda Lamoudi, Jean Claude Chaumeil, Kamel Daoud, Swelling, erosion and drug release characteristics of Sodium diclofenac from heterogeneous matrix tablets, J. Drug Deliv. Sci. Technol. 31 (2016) 93–100.
[43] John O. Akindoyo, M.D.H. Beg, Suriati Ghazali, M.R. Islam, Nitthiyah Jeyaratnam, A.R. Yuvaraj, Polyurethane types, synthesis and applications-a review, RSC Adv. 6 (115) (2016) 114453–114482.
[44] A. Bahadur, A. Saeed, M. Shoaib, S. Iqbal, S. Anwer, Modulating the burst drug release effect of waterborne polyurethane matrix by modifying with poly-methylmethacrylate, J. Appl. Polym. Sci. 136 (13) (2019) 1–8.
[45] Shahinaze A. Fouad, Emad B. Basalious, Mohamed A. El-Nabarawi, Saadia A. Tayel, Microemulsion and poloxamer microemulsion-based gel for sustained transdermal delivery of diclofenac epolamine using in-skin drug depot: in vitro/in vivo eva-luation, Int. J. Pharm. 453 (2) (2013) 569–578.
[46] E. Ahnfelt, E. Sjögren, N. Axén, H. Lennernäs, A miniaturized in vitro release method for investigating drug-release mechanisms, Int. J. Pharm. 486 (1–2) (2015) 339–349.
[47] Eun Ha Seo, Kun Na, Polyurethane membrane with porous surface for controlled drug release in drug eluting stent, Biomater. Res. 18 (1) (2014).
[48] Craig M. McKittrick, Sean McKee, Simon Kennedy, Keith Oldroyd, Marcus Wheel, Giuseppe Pontrelli, Simon Dixon, Sean McGinty, Christopher McCormick, Combining mathematical modelling with in vitro experiments to predict in vivo drug-eluting stent performance, J. Control. Release 303 (May) (2019) 151–161.
Declaration of competing interest
The authors declare that they have no conflicts of interest. References