Science Arts & Métiers (SAM)
is an open access repository that collects the work of Arts et Métiers Institute of
Technology researchers and makes it freely available over the web where possible.
This is an author-deposited version published in: https://sam.ensam.eu Handle ID: .http://hdl.handle.net/10985/15616
To cite this version :
Emmanuel LIZÉ, Marc REBILLAT, NAZIH MECHBAL, Christian BOLZMACHER - Optimal dual-PZT sizing and network design for baseline-free SHM of complex anisotropic composite
structures - Smart Materials and Structures - Vol. Volume 27, Issue 11,, p.Article number 115018 - 2018
Any correspondence concerning this service should be sent to the repository Administrator : archiveouverte@ensam.eu
Optimal dual-PZT sizing and network design
for baseline-free SHM of complex
anisotropic composite structures
Emmanuel Lizé
1, Marc Rébillat
2, Nazih Mechbal
2and
Christian Bolzmacher
11
CEA, LIST, Sensorial and Ambient Interfaces Laboratory, F-91191-Gif-sur-Yvette CEDEX, France
2
Processes and Engineering in Mechanics and Materials Laboratory(CNRS, CNAM, ENSAM), 151, Boulevard de l’Hôpital, Paris, F-75013, France
E-mail:emmanuel.lize@cea.fr
Abstract
Structural health monitoring(SHM) processes for aeronautic composite structures are generally based on the comparison of healthy and unknown databases. The need for prior baseline signals is one of the barriers to industrial deployment and can be avoided with baseline-free SHM (BF-SHM) methods, based on the attenuations and reflections of symmetric and antisymmetric Lamb wave modes attributable to damage. A promising mode decomposition method is based on the use of dual-PZTs(concentric disc and ring electrodes lying on a single piezoelectric transducer of lead zirconate titanate). However, the performance of such methods highly depends on the Lamb wave mode properties(propagation speed and attenuation , which vary with material orientation and inter-PZT distance), the number and the sensitivity of the dual-PZT to each mode(which depends on the frequency and element size). Considering these constraints, an original three-step process able to design a full dual-PZT network and the optimal range of excitation frequencies to consider on a highly anisotropic and arbitrarily complex aeronautic structure is presented. First, the dispersion curves of Lamb waves in the investigated material together with the minimal size of the damage to detect are used to estimate the size of the dual-PZT, as well as convenient excitation frequencies. A localfinite element model representative of the full-scale structure is then used to estimate the optimal distance and orientation between neighboring PZT elements. Finally, a network optimization solver applies these parameters to place dual-PZTs on the fan cowl of an aircraft nacelle and provides a candidate network covering the whole structure.
Keywords: structural health monitoring, Lamb waves, dual-PZT, anisotropic composite structure, mode decomposition, baseline-free methods
(Some figures may appear in colour only in the online journal)
1. Introduction
The real-time and autonomous monitoring of the health state of structures is referred to as structural health monitoring (SHM) [1]. Damage detection using Lamb waves is one of the
most common SHM methods for aeronautic composite structures. Among all the methods employed to trigger and catch Lamb waves, the use of a piezoelectric transducer(PZT)
is one of the cheapest and easiest to settle. A common approach is based on the comparison of signals recorded on a pristine structure—the baseline—against those obtained on a possibly damaged one. The resulting signals, which will be used to elaborate the damage indexes, strongly depend on the structure’s mechanical and geometrical properties as well as on environmental conditions. Some solutions have been proposed to compensate for the effect of temperature[2–5] or
to extend baseline data to a wider range of environmental conditions[6,7]. This drawback of existing methods has also
fed the interest for baseline-free methods. Baseline-free is an abusive word here(see axiom II in [1]) since data, models or
physical assumptions are always needed to decide whether a structure is damaged or not. This expression thus refers to methods where prior reference signals recorded from the pristine condition of the monitored structure are not necessary for damage detection.
Symmetric and antisymmetric Lamb wave modes are very useful for SHM as they convey complementary infor-mation when interacting with damage[8,9, ch. 19.4]. Lamb wave modes are related to Lamb solutions for wave propa-gations in isotropic plates but are also commonly(and abu-sively) used to designate plate-like waves that propagate in anisotropic materials. Early studies on damage detection in composite structures state that the S0 mode is more
appro-priate than the A0mode for delamination detection, since the
former exhibits higher sensitivity to the structural thickness [8, para. 3.3]. In most SHM applications on composite structures, the S0mode is actually preferred since it has lower
attenuation, allowing for larger distances between neighbor-ing PZTs in the designed network. However, the A0 mode
could be more appropriate since it allows interaction with delamination at smaller excitation frequencies than the S0
mode and has been favored in most recent works [10–12].
Actually, both modes can be used as long as the excitation frequency chosen (and the resulting wavelength of each mode) allow interaction with the damage [9, para. 19.5.2.2]. Common methods used to study the behavior of a given mode (A0 or S0) are based on the response signal obtained with
collocated transducers [9, ch. 17], or the use of sweet spot frequencies[13, ch. 8] where only one mode is generated. The former method requires access to both sides of the instru-mented structure as well as the perfect collocation of the transducers, and the latter restrains the application to specific excitation frequencies that may not correspond to the amount of damage to detect. These limitations are overcome by using dual-PZTs. dual-PZTs are made of a concentric ring and disc, as shown infigure1. Both parts can be used as actuators and sensors resulting in more signal combinations than conven-tional PZTs and allowing for the isolation of the first anti-symmetric A0 or symmetric S0 mode. With dual-PZTs,
damage can then be detected in a baseline-free manner by
using the damage-introduced mode conversion and attenua-tion(which is not the same for each mode) of the propagating waves [8]. The theoretical aspect justifying the use of these
PZTs for baseline-free SHM (BF-SHM) has been well developed in [14], and experiments are reported in [15] on
aluminum and in[16] on composite structures. However, the
interaction of each mode with the damage is conditioned by the wavelength of the waves generated by the dual-PZT and the damage dimension. As a consequence, the transducer’s dimensions as well as the excitation frequencies must be chosen with care. Thefirst objective of the present work is to propose a method for dual-PZT sizing and excitation fre-quency selection according to the targeted application, i.e. BF-SHM. Furthermore, previous works with dual-PZTs have been carried out on quasi-isotropic structures but, to our knowledge, no studies have been reported on anisotropic structures. In such materials, the amplitude as well as the propagation speed of the A0and S0modes on a path between
two PZTs depends on the angle between the path direction and the orientation of the carbon fibers composing the structure[9]. Since the mode decomposition method depends
on the amplitude ratio between both modes, the PZT positions (in terms of distance and orientation) need to be chosen carefully to guarantee the sensitivity of both modes in any configuration. The second objective of the present work is then to propose a method to determine the optimal distance and orientation between neighboring dual-PZTs. Another underlying objective is to optimize the number of active elements, which is a key point for industrial deployment, especially in aeronautical applications.
Some of the BF-SHM methods, where mode decomposi-tion using a dual-PZT is of interest, are quickly reviewed here. The instantaneous baseline method is based on a transducer network with the paths having the same dimensions and orientations. Instead of comparing the signals obtained in unknown conditions with a pristine baseline, they are compared instantaneously between paths even under varying environ-mental conditions [17,18–21]. Drawbacks concern the
exam-ined paths, which must have identical PZT positioning and bonding and avoid elastic wave reflections from the boundaries. Another technique, called the time reversal process, assumes that for a pristine structure, by sending back the reverse signal received by a given PZT, the input signal used in thefirst place should be recovered. Damage potentially breaks this relation, allowing for its detection. This method has been validated on composite structures[11,22–25] and its limitations have been
identified [26], namely, the high dependency on the excitation
frequency, mode dispersion and the reflections from the boundaries. In the reciprocity principle method, two signals obtained from both possible directions of a given path are directly compared. This method has been used successfully in aluminum [15, 17, 27] and quasi-isotropic composite [12]
structures. Its drawbacks are that the implemented PZTs must be identically bonded to the structure, and that damage localized far from the investigated path is difficult to detect.
BF-SHM studies focus on a description of the damage detection methods, but do not address the problem of network design when dealing with large structures. However, the PZT
Figure 1.A simplified view of a dual-PZT composed of a concentric ring and a disk.
network(size, number, distance and orientation of transducers as well as excitation frequency) to be used highly depends on the considered damage detection method, the environmental con-ditions, and the geometry of the structure. This step must thus be considered with great care. There have been studies on optimal sensor placement(OSP) for reference-based Lamb-wave-based SHM applications [28–33] with recent focus on composite
structures[33–35]. These studies show that the relevant criteria
for PZT positioning are the distance between two neighboring PZTs and the presence of complex geometries[34] (large holes,
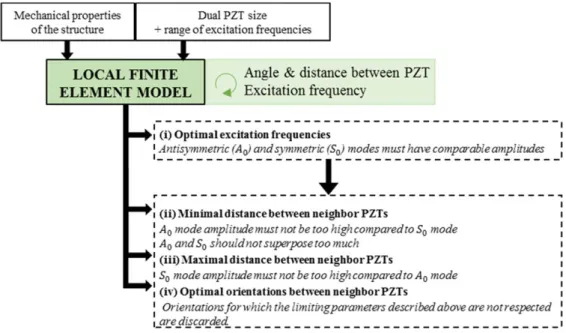
stiffeners, etc) on the paths between PZT. In BF-SHM appli-cations, additional and very restrictive constraints on the PZT networks exist. Based on the observations described above, the current work proposes an original three-step process to design an optimal dual-PZT network for a structure to be monitored by means of BF-SHM methods. As depicted in figure 2, the dif-ferent steps of this process are:
1. The mechanical properties of the structure are used to compute the dispersion curves of Lamb waves in the investigated material. Dispersion curves and the mini-mal amount of damage to be detected allow the dual-PZTs to be sized and the excitation frequencies of interest to be determined.
2. A local FEM model (a plate corresponding to a small part of the monitored structure) equipped with two dual-PZTs is used. Lamb wave attenuation is extracted with a distance r and orientationθ and for different excitation frequencies f0. Two original indexes quantifying the
ability of the set( f0, r,θ) for mode decomposition are
then computed. This provides the optimal parameters
q
( ˆf0, ,rˆ ˆ )for the neighboring dual-PZTs of the network. 3. The network optimization solver applies the optimal parameters obtained from the local FEM model to the real structure, to propose an optimal dual-PZT con fig-uration candidate.
The rest of the paper is organized as follows: in section2, the material and geometry of the targeted aeronautical struc-ture under study are presented. Then in section3, each step of the process is described and illustrated with results obtained on a highly anisotropic composite material. Finally, in sections 4 and 5, the PZT networks obtained for different geometries and different composite materials are displayed, analyzed and discussed.
2. Material and structure under study
Composite materials are of great interest in an aeronautical context since they provide lighter structures with the same mechanical properties as previously used materials. The composite material under study is a highly anisotropic com-posite-fiber-reinforced polymer (CFRP) with 16 plies oriented at(0°/90°). The mechanical properties of one ply are listed in table1.
A part of a nacelle from an A380 plane(the fan cowl as shown in figure 3) is considered to illustrate the three-step
process proposed to design an optimal dual-PZT network for BF-SHM methods. This geometrically complex structure is 2.20 m in height for a semi circumference of 5.80 m and is made of a composite monolithic carbon epoxy material. Piezoelectric elements manufactured by NOLIAC (see table 2) are used to trigger and collect Lamb waves in the
structure.
3. Optimal dual-PZT sizing and placement
3.1. PZT dimension and excitation frequency
In thefirst step of the proposed method, the dimensions of the PZT to be used as actuators and sensors and the excitation frequencies are determined based on the material properties and on the minimal size of the damage to be detected. This approach is developed to meet three main goals(see figure4):
(i) Only the first symmetric and antisymmetric modes S0
and A0must be generated.
(ii) The dual-PZT used as an actuator and the frequencies of the signal used must guarantee the excitation of the S0
and/or A0 modes with a wavelength small enough to
interact with the targeted minimal damage.
(iii) The dual-PZT used as a sensor must be sensitive to both S0and A0modes over the selected range of excitation
frequencies.
The dispersion curves are computed numerically byfinding all the possible frequencies that satisfy the Lamb wave dispersion
Figure 2.The different steps for the optimal design of a dual-PZT network on an anisotropic composite structure.
relations with iterations on the wave number k[36]. Once those
values are computed, the dispersion curves can be displayed as a variation of the wavelength λ=2π/k of each symmetric and antisymmetric mode with the frequency. The dispersion curves can also be computed for some rheological materials(please refer to[37] for some open software). The dispersion curves displayed
infigure5are computed considering plane waves propagating in a homogenized material with the properties given in table 3
corresponding to the 0° direction of a (0°, 90°)16 CFRP plate.
The 0° orientation is chosen since it is the direction in which the wavelengths are larger; hence a dual-PZT with the right dimensions for these wavelengths will respect the criteria described infigure4in all orientations.
The BF-SHM methods targeted here consist of tracking the S0 and A0 mode conversion and attenuation. It is thus
necessary to restrain the domain of applications where only those first two modes propagate. The dispersion curves for higher frequencies (not displayed here) show that the exci-tation frequency should not exceed fmax=906 kHz
(corresponding in our case to the minimal excitation fre-quency for which mode A1is generated) to meet this
condi-tion. A second point to consider is that theoretically half the wavelength λ of the wave used to detect damage must be shorter than or equal to the size of the damage∅din order to
allow interaction with it [38]:
l Æ
( )
2 d. 1
This leads us to bound the frequency range under which S0
and A0 can be exploited: the largest wavelength validating
equation (1) is l = ´ Æd 2 d. According to this criterion, the excitation frequency used should be greater than the frequency fA0for the A0mode and fS0for the S0mode, corresponding to
excitation frequencies for which the wavelengthsλA0andλS0are
lower than λd (see figure 5). As advised by the aeronautical
manufacturer who provided the samples, the minimal amount of
Table 1.The properties of a layer of the CFRP composite laminate.
E1(GPa) E2=E3(GPa) ν31 ν23=ν12 G23=G31(GPa) G12(GPa) ρ (kg.m−3)
121 8.6 0.06 0.31 4.3 5.9 1520
Figure 3.The aircraft nacelle(left), the original fan cowl geometry and the simplified 3D geometry of the subpart being studied (right).
Table 2.The electro-mechanical properties of the PZT material NCE51 from Noliac.
E11(GPa) E33(GPa) a (1/K) ν d31(pC N–1) d33(pC N–1) s .1011E -12 s33E.10−12 ρ (kg.m−3)
62.50 52.63 2.10−6 0.38 −195.00 460.00 16.00 19.00 7600
Figure 4.A schematic illustration of the three steps followed to select the dimensions of the dual-PZT from the dispersion curves. This corresponds to step 1 infigure2.
damage that needs to be detected (BVID for barely visible impact damage) is 20 mm, hence in our case, λd =40 mm,
fA0=12 kHz and fS0=134 kHz (see figure5).
Furthermore, it is mandatory to ensure that at these fre-quencies the dual-PZT element can actuate and receive the desired modes. This then leads us to select optimal dual-PZT dimensions. Two criteria are important in the choice of the PZT according to[39]:
• As an actuator, an optimal PZT size ∅PZTis obtained for
l
Æ = ⎜⎛ + ⎟ = ¼
⎝n 12⎞⎠,n 0, 1, 2, ( )2
PZT
• As a sensor, the sensitivity of the PZT increases as its size is reduced and the size of the PZT must be inferior to half the wavelength to be detected, i.e.
l
Æ ( )
2. 3
PZT
When classic circular PZTs are used as actuators and sen-sors, an optimal PZT size is obtained for ∅PZT =∅dby
con-sidering the criteria described by equations (1), (2) and (3).
However, in practice this choice limits the application of detec-tion to very few excitadetec-tion frequencies. An advantage of the dual-PZT, in addition to its mode decomposition ability, is that both parts of it can be chosen independently. Nevertheless, as the disk part of the dual-PZT is also used as an actuator for the mode decomposition process, it should not be too small to allow the generation of Lamb waves. The choice of the ring part dimension of the dual-PZT, ∅PZT−ring, is chosen such that the maximum
energy (see equation (2) with λ=λd and n=0) is
commu-nicated to the structure for the targeted minimal amount of damage. According to [39], the equivalent diameter for a ring
PZT∅PZT−ring can be determined as the outer diameter minus the inner diameter, i.e.
ÆPZT-ring= ÆPZT-ring- Æ - = Æ. ( )4
outer
PZT ring inner
d
In our case, this gives ÆPZT-ring =20 mm.The choice of
the dimension of the central part of the dual-PZT ∅PZT−diskis governed by the range of frequencies in which the BF-SHM methods are to be investigated. In the case presented infigure5, it is interesting to have sensors sensitive to both modes for fre-quencies up to fS0because it is the smallest frequency for which
both modes are activated and interact with the targeted damage size. To guarantee the sensitivity of the A0 mode at this
fre-quency, the dimension of the central part of the dual-PZT should be sensitive to wavelengths equal to λmin=λA0( fS0) (the
wavelength of mode A0 obtained at fS0, see figure 5). Using
equation(3), this disk dimension is obtained for:
l
ÆPZT-disk = A0(fS0)/2. ( )5
Figure 5.The dispersion curves for the material described in table3showing the minimum frequency to use( fA0=12 kHz for the A0mode
and fS0=134 kHz for the S0mode) to allow for interaction between the propagating wave and damage of ∅d=20 mm. It also shows the
range of frequencies to use to guarantee the sensitivity of the dual-PZT to the A0mode and S0mode for frequencies up to fS0=134 kHz. The
disk part of the dual-PZT is also sensitive to an S0mode up to fS max
0 =478 kHz; ∅PZT−disk=5.5 mm and ∅PZT−ring=∅d=20 mm.
Table 3.The mechanical properties of the(0°, 90°)16homogenized
CFRP plate.
E (GPa) ν ρ (kg.m−3) t (mm)
In the current application,λmin=11 mm, hence ∅PZT−disk=
5.5 mm.
Figure5 highlights four distinguishable areas:
• 0<f0<fA0: the dual-PZT triggers the A0 mode, but it
does not interact with the damage.
• fA0<f0<fS0: the dual-PZT triggers the A0 and S0
modes, but only the A0mode interacts with the damage.
Both modes can be properly measured by the disk part of the dual-PZT, but the ring part is theoretically only sensitive to the S0mode.
• fS0<f0< fS : max
0 the dual-PZT triggers the A0 and S0
modes and both modes interact with the damage, but only the S0mode can be properly measured by the disk part of
the dual-PZT, and the ring part is theoretically insensitive to any mode.
• f0< fSmax:
0 the dual-PZT triggers the A0and S0modes and
both modes interact with the damage, but the PZT is not sensitive to any mode.
According to the PZT manufacturer (Noliac), the gap between the two electrodes designed on the upper surface of the PZT should not be less than 1 mm. Following this instruction and equations(4) and (5) the dual-PZT dimension must respect:
l
ÆPZT-disk A0(fS0) /2
ÆPZTinner-ring ÆPZT-disk+2 mm ÆPZT-ring= Æ - + Æ.
outer
PZT ring inner
d
The smallest dual-PZT that satisfies all these recommen-dations is obtained for ∅PZT−disk =5.5 mm, ÆinnerPZT-ring= 7.5 mm andÆPZTouter-ring=27.5 mm. The associated excitation
frequency range of interest is from 12 to 134 kHz, because it allows mode conversion tracking for both modes while guar-anteeing the interaction of the propagating Lamb waves with the damage.
3.2. Optimal distance and orientation between neighboring PZTs of the network
Two important pieces of information not provided by the dis-persion curves are the attenuation of the waves propagating within the material and the efficiency with which both Lamb wave modes are converted to electric signals by the dual-PZT. In ani-sotropic materials, the attenuation varies a lot with the distance and orientation of thefibers, and the symmetric and antisymmetric modes are not identically affected. This is rarely considered in the design of the PZT network, whereas it is of great importance to estimate the optimal relative placement of neighboring PZTs, as illustrated infigure6. Analysis of the electromechanical efficiency of the dual-PZT would be useful to assess the mode decom-position abilities of the chosen PZT and to validate the ability of the network to be used in a BF-SHM manner.
3.2.1. Local finite element model representative of the structure. A local FEM model is built using SDTools® [40]. This model is local in the sense that it corresponds only
to an FEM model of a rectangular plate made up of the same material as a whole structure instead of an FEM model of the
complete structure (see figure 7 and table 2). This local
approach aims to diminish the number of nodes of the FEM model and provide an affordable simulation in terms of computation time. This is necessary in contexts where parametric studies are conducted with transient simulations performed at various excitation frequencies. Quadratic elements with dimensions of 2 mm×2 mm are used for the meshing of the plate. This mesh size is compatible with the wavelength of the A0 and S0 modes, whose value does not
exceed 11 mm over the investigated frequency range and has been validated by a convergence test. The excitation signal is chosen as a five cycle sinusoidal tone burst modulated by a Hanning window at an amplitude of 10 V and a central frequency f0 varying from 10 to 140 kHz (average interval
from fA0to fS0infigure5) by steps of 10 kHz. For each step,
simulations are conducted alternately with each possible emission scheme(entire PZT, ring part, disk part), leading to a total of 30 simulations. The time step for the transient simulation is 0.36 μs and corresponds to a sampling frequency of 2.8 MHz. The transient simulation is performed with Newmark’s method and the dynamic damping of the structure is simulated by considering a coefficient of 5.10−8for the stiffness matrix and no damping coefficient for the mass matrix (coefficients obtained from a calibration with experimental measurements and used in [41]). The plate used for the simulation is a (0°, 90°)16CFRP
plate with the properties given in table 1 modeled as a 3D orthotropic material and homogenized using Mindlin theory for thin laminate plates. The PZT elements are composed of Noliac NCE51 material (see properties in table 2) and
simulated as piezoelectric finite shell elements. The inter-distance between PZTs is 400 mm and the circle arc to study the attenuation with the orientation is placed 150 mm away from the actuator. Previous works using this software have been conducted to assess SDTools® and the reliability of the proposed PZT elements for SHM applications. Indeed, the electromechanical interaction and the effect of glue and temperature have been experimentally validated[42,43]. The
displacement is saved for each node between the actuator and the sensor to estimate the Lamb wave attenuation with distance, and on the circle around the actuator to estimate the Lamb wave attenuation with orientation(see figure7). 3.2.2. Lamb wave attenuation and dual-PZT electromechanical efficiency. The electric signal measured by the dual-PZT Va→s, depending on the PZT part used as actuator a, the PZT part used as sensor s, the distance r between the actuator and sensor, the orientation compared to the 0° ply θ and the excitation frequency of the input f0can be analytically expressed as:
q = q + q ( ) ( ) ( ) ( ) Va s r, ,f ,t Va s r, ,f ,t V r, ,f ,t 6 A a s S 0 0 0 0 0 q = q ´ ( ) ( ) ( ) ( ) [ ] [ ] [ ] Va s r, ,f ,t C r, ,f ,t S f 7 X X a s X 0 0 0 0 0 0
where t is the time,VaA0sandVaS0 s refer to the electrical signal
measured by the PZT for the A0and S0mode when part a is
used as an actuator and part s is used as a sensor.[X] is either A or S referring to the antisymmetric or symmetric mode. C[ X]0 is
corresponds to the mechanical displacement attributable to the [X]0mode at the sensor position. In the approach proposed here,
the antisymmetric mode is assumed to correspond mainly to the out-of-plane deformations and the symmetric mode to correspond mainly to the in-plane deformations. Sa[ ]X0s then
corresponds to the electromechanical efficiency of the PZT to mode[X]0for actuator a and sensor s. SinceSa[ ]X0sonly depends
on the excitation frequency f0, it can be determined from the
electrical signal obtained on the dual-PZT electrodes of the PZT sensor and the mechanical displacements measured at its center (the white cross in figure7). With equations (6) and (7) and
C[ X]0 (r, θ, f0, t) obtained from the FEM simulation,Sas( )f
A 0
0 and
( )
SaS0s f0 are computed with an iterative process that consists of
finding the minimum mean square error between the envelope of the signal measured on the PZT electrodeVas(r, ,q f0,t)
and the sum of the envelopes ofCA(r, ,q f0,t)´Sas( )f
A 0 0 0 andCS (r, ,q f ,t)´S ( )f a s 0 S 0
0 0 (the iteration is performed on
values of SaA0s( )f0 and SaS0s( )f0 ). Figure 10(b) shows an
example of the envelopes of each mode displacement scaled by their respective electromechanical efficiencies and the response signal measured by the disk part of the dual-PZT.
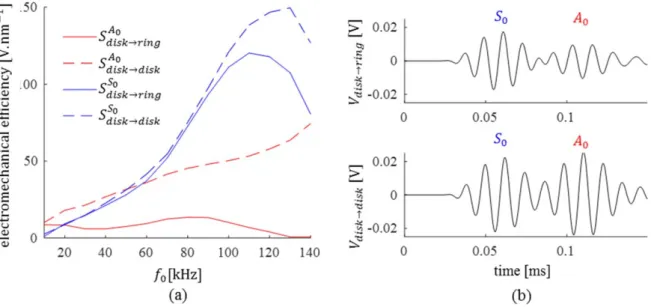
Figure 8 shows the variation of the electromechanical efficiency of the ring and disk parts of the dual-PZT for the A0
and S0mode depending on the excitation frequency. The disk
part appears to be much more efficient than the ring part in measuring the A0mode over the whole range of frequencies
considered, whereas both parts are efficient enough to measure the S0mode. This graph echoes the results observed
infigure5and the associated observations. It also explains the ability of dual-PZTs to decompose modes in the measured signal, since each part exhibits different electromechanical efficiency for each mode.
Figure 6.A schematic illustration of the inputs and outputs to the local FEM(step 2 of figure2) as well as limiting parameters for the optimal
placement of neighboring PZTs and excitation frequencies.
Figure 7.The local FEM composite plate with two dual-PZTs and the sensing point(black line and circle) used to study antisymmetric and symmetric mode propagation(left) and the mesh of the dual-PZT (right).
Figure9(a) shows that A0and S0have a different amplitude
variation with the excitation frequency: the A0 mode is
significantly greater for lower frequencies (below 35 kHz) whereas the S0 mode is greater for higher frequencies (after
90 kHz). Figure9(b) shows that the A0 mode attenuates faster
than the S0mode with distance. Fromfigure10(a) one can see
that S0is much more impacted by the wave propagation direction
than A0. The S0mode tends to propagate well in the composite
fiber directions (maximum at 0° and 90°), but its amplitude can be reduced to 10% of its maximum value(around 17° and 73°). The A0mode amplitude(maximum at 0°) is only reduced to 50%
of its maximum value at 45°. Figure10emphasizes the fact that
both modes may have the same amplitudes in the 0° direction, but this comparison varies a lot with the direction of propagation.
3.2.3. Optimal frequencies for mode conversion using dual-PZT. In a BF-SHM context where the A0 and S0 mode
conversion and attenuation are investigated in the presence of damage [10, 14, 44-46], the distance between neighboring
dual-PZTs and the orientation of the dual-PZT path with respect to fiber orientation as well as the frequency of excitation must be correctly chosen such that:
(i) The two modes propagate and are measured in compar-able proportions.
Figure 8.(a) The variation of the electromechanical efficiency of the PZT sensor ring and disk for the S0and A0mode against an excitation
frequency f0.(b) The response signal obtained for r=150 mm, θ=0°, f0=80 kHz, with the disk as the actuator and the ring or the disk as
a sensor.
Figure 9.(a) The maximum amplitude variation of the out-of-plane (∼A0) and in-plane (∼S0) displacement with the frequency 150 mm away
from the actuator in the 0° direction. (b) The maximum amplitude variation of the out-of-plane (∼A0) and in-plane (∼S0) displacement with
(ii) The first wave packet of the A0 mode must not
superpose too much with the S0mode.
To evaluate these two parameters, two criteria are proposed: q q q = ˜ ( ) [ ( ( ))] [ ( ( ))] ( ) / V r f V r f t V r f t , , max env , , , max env , , , 8 a s A S a s A aS s 0 0 0 0 0 0 0
ò
ò
ò
t q q q q = + ( ) ( ( )) ( ( )) ( ( )) ( ) r f V r f t V r f t V r f t , , env , , , env , , , env , , , , 9 a s t t aA s t t aS s t t aA s 0 0 0 0 0 1 0 1 2 0 0 3 0where env(.) denotes the envelope of the signal. (t0, t3) is the
time interval corresponding to thefirst A0wave packet, t1the
instant whenVaA0sbecomes higher thanVaS0 s,and t2the end
of the first S0 wave packet (see figure 12(b)). V˜a/s A0 S0
represents the amplitude ratio of the contribution of the A0
mode against the contribution of the S0mode in the measured
response signal.τa→squalifies the superposition of modes in the measured response signal: it represents the intersection of both modes against the A0 mode measured in the time
corresponding to thefirst A0wave packet(see figure 12(b)).
These two criteria depend on the distance between the actuator and sensor r, the orientation of the path actuator-sensor in comparison with the 0° ply of the structure θ, and the excitation frequency f0. The PZT part chosen as the
actuator has very little influence on the chosen criteria, since it affects both mode amplitudes proportionally. Furthermore, as the disk part of the dual -PZT is sensitive to both A0and S0
modes(in opposition to the ring part), only results obtained with the disk part as actuator and sensor are displayed.
We introduce two thresholds eV˜ and et˜ to determine
whether a sensor position and excitation frequency can be considered as suitable for mode decomposition. These thresh-olds will serve as tuning parameters for the proposed method. The amplitude ratio of the A0mode against the S0 mode as
described in equation (8) is used to select the optimal
frequencies where both modes are in comparable proportion in the response measured by the disk part of the PZT. The thresholdeV˜ is set to 1/3 so that the amplitude of the A0mode
should not exceed the amplitude of the S0mode by more than
three times and vice versa. Figure11(a) shows the maximum
amplitude of each mode contribution obtained with equation(7)
for the disk part of the dual-PZT at 150 mm from the actuator (the electromechanical efficiency of the sensor according to the frequency Sa[ ]X0s is considered). The striped area depicts the
frequency range for which the amplitude ratio does not respect the threshold( ˜VaA0/sS0>1/eV˜).Hence, the optimal frequency
range to observe mode conversion is from 40 to 140 kHz. This graph also shows that the optimal frequencies for the A0mode
studied alone would be for frequencies below 40 kHz, because the amplitude of the A0mode is significantly higher than the
S0mode. In mode tuning methods, 30 kHz corresponds to the
sweet spot frequency of the A0mode. These methods consist of
an appropriate selection of the excitation frequency of Lamb waves in order to generate only one of the Lamb wave modes [13, para. 8.8]. The frequency range obtained here is for the 0° orientation and is discussed for other orientations later. Figure 11(b) shows the contribution of each mode to the
measured response signal. A difference between the maximum amplitude of the response signal (Vdisk→disk) on the wave
Figure 10.(a) The maximum amplitude variation of the out-of-plane (∼A0) and in-plane (∼S0) displacement with orientation for f0=80 kHz
and at a distance of 150 mm from the actuator.(b) The response signal measured by the disk part of the dual-PZT for f0=80 kHz, at r=150
packets corresponding to S0(the first wave packet) and A0(the
second wave packet) and the maximum amplitudes of each mode contribution (VdiskA0disk and
VdiskS0 disk) is noticed,
because a little mode conversion (from S0 to A0) occurs at
the edge of the ring part of the PZT and is measured by the disk part.
3.2.4. Optimal distance and orientation between neighboring dual-PZTs. The minimum distance is obtained by observing the superposition τ described in equation (9). The results
displayed infigure12(a) show that a minimum distance rmin
of 150 mm must be respected to avoid the superposition of the modes in the chosen excitation frequency range, and the superposition threshold et˜is set to 5% based on observations
of the decomposition algorithm results. This allows us to clearly distinguish between S0and A0modes.
Given the orientation of the plies of the composite structure under study, it is relevant to notice that the symmetry in the wave propagation, such as the propagation from 0° to 45°, is exactly the opposite of the propagation from 90° to 45° (this is observable in the results displayed in figure10). First, from figure10(a), orientation17(p/2 and)
p
( / )
73 2 should be avoided since the S0 mode hardly
propagates in those directions. Since the A0 and S0 modes
have different amplitude variations with frequency (see figure 9(a)), the distance (see figure 9(b)), orientation (see
figure10) and the amplitude criteriaV˜a/s
A0 S0 cannot meet the
threshold eV˜ for every excitation frequency, orientation and
distance. Figure13shows the amplitude ratio as measured by
Figure 11.(a) The maximum amplitude ofVdiskdisk A0 and
Vdisk disk
S0 in the response signal measured by the disk part of a dual-PZT place for r=150 mm. The striped area represents the frequency range where the amplitude ratio ˜/
Va s
A0 S0(right axis) between the maximum amplitude ofVdiskA0disk and
VdiskS0 diskdoes not respect the threshold e = ˜ 1 3./
V (b) The superposition of the contributions of each mode and the signal
measured by the disk part of the dual-PZT for f0=80 kHz, at r=150 mm and θ=0°.
Figure 12.(a) The mode superposition against distance and excitation frequency for a direct contribution of the Lamb waves propagating in
the 0° direction of a composite plate measured by the disk part of the dual-PZT. (b) A representation of the superposition criteria estimation (equation (9)).
the disk part of the dual-PZT for varying excitation frequencies and orientation. It shows that for 150 mm (minimum distance for the superposition criteria), the thresh-old is exceeded for excitation frequencies above 100 kHz and orientations 10° away from the fiber directions. Except for an excitation frequency of 40 kHz, this observation is not applicable for 300 mm (because the A0 mode attenuates
faster than the S0 mode, see figure 9(b)). However, at this
distance the threshold is not respected for frequencies higher than 130 kHz. Therefore, the range of frequencies is reduced to 50–140 kHz, the minimum distance between the actuator and sensor rminis evaluated at 230 mm(for a shorter distance,
the A0mode is too high compared to the S0mode at f0=60
kHz) and the maximum distance rmaxis evaluated at 270 mm
(for larger distances the S0mode is too high compared to the
A0mode for f0=140 kHz and θ=0°).
Figure13shows that the amplitude ratio at high frequencies is the limiting parameter for the maximum distance between two PZT neighbors. On the one hand, having a larger range of frequencies enables the damage detection process to be robustified (since damage indexes can be applied to several excitation frequencies), and on the other hand, reducing the range of frequencies toward lower accepted values leads to greater maximal distances rmax, which means fewer PZTs on the
targeted network. Hence, a trade-off between the robustness of the detection and the number of PZTs is necessary.
3.3. Observations regarding mode decomposition on numerical and experimental measurements
The previous paragraph describes some important observations regarding the sensitivity of the dual-PZT elements for the A0and
S0modes, leading to recommendations for their optimal
place-ment with the focus on a complex anisotropic structure. This part presents numerical and experimental results showing the rele-vance of these observations to design a dual-PZT sensor network allowing for efficient mode decomposition. Numerical and
experimental results are obtained on a 910×650 mm plate with the same composite anisotropic material described in3.2.1. 3.3.1. Numerical results. Numerical experiments are conducted on a plate equipped with two dual-PZTs and the positioning illustrated infigure7. Figure14shows the results of the mode decomposition method with different parameters in four different cases. ToAS0 and ToAA0 stand for the time of arrival
of the S0 and A0 mode first wave packets. They are obtained
considering the out-of-plane and in-plane displacement at the dual-PZT sensor location.
It is important to notice that except for case #2, the considered configurations correspond to situations where the thresholds described before are not exceeded. In each case, we can see the mode conversion from S0to A0that occurs at
the edge of the dual-PZT at ToA .S0 For case #1, which
corresponds to an ideal configuration regarding the mode’s amplitude ratio and the superposition criteria, we see that both modes can be isolated despite the superposition of the A0
mode arrival with a reflection of the S0 mode. In case #2,
where the superposition criteria are not respected (see figure 12), it is noticeable that the first wave packet
corresponding to the S0 mode is quite hard to distinguish
with the A0wave packet. This results in the noisy isolation of
the S0 mode at ToA .A0 Case #3 shows the influence of
distance: the A0 mode is well isolated even if it arrives after
reflections from the S0 mode. In case #4, we are in a
configuration where the S0 mode is quite weak compared to
the A0mode. The S0mode isolation seems noisy but actually
contains several reflections since the considered orientation corresponds to a case where the S0 mode is very weak in the
direct actuator-sensor path(see figure13(a)).
3.3.2. Experimental results. The dual-PZT sizing in the experimental set-up was optimized to trigger a wavelength of A0 that was able to interact with 19 mm of damage and
measure this mode at 50 kHz, leading to the following dimensions: ÆPZT-disk =9 mm, ÆinnerPZT-ring =11 mm and
ÆPZTouter-ring =30mm. Five dual-PZTs are mounted with different distances and orientations and figure15shows the mode decomposition obtained for paths having different properties. The signals were acquired with a sampling frequency of 1 MHz.
In experimental conditions, the signals measured are prone to noise coming from the measuring system (see for example the beginning of the signals in case #7, which contain an echo from the input signal) and experimental issues. Some signal components are also due to the reflection of Lamb waves occurring at other dual-PZT positions. Cases #5 to #7 correspond to configurations where the parameters are chosen in order to guarantee the mode decomposition in the response signals. The same observations as the numerical results regarding mode conversion at the dual-PZT edge and the influence of orientation and distance are observed. Case #8 shows the importance of the excitation frequency selection to guarantee the propagation of both modes and the good sizing of the electrodes, which in this case do not have the dimensions to be sensitive to the A0 mode at
140 kHz.
The observations obtained in the numerical results show that the threshold values previously defined are quite strict for the targeted application, since decomposition works even if one of the criteria is not respected. However, experimental
measurements are more prone to noise, and the response measurements are not as clean as what one would have in a numerical simulation. It is then interesting to have quite severe thresholds to guarantee the mode decomposition in real applications.
3.4. PZT network optimization solver
The previous simulation step allows the determination of PZT placement requirements given by the minimum and maximum distance between the PZT (rmin and rmax =150), and the
optimal angles of the PZT paths compared with the 0° orientation of the structure(θopt). These requirements as well
as the mesh of the structure under study constitute the input parameters of the PZT network optimization, as described in the following algorithm:
Algorithm:PZT placement
Step 1: Thefirst PZT node is randomly selected • A node of the mesh is randomly selected and validated as
thefirst PZT position. End
Step 2: other PZT nodes are chosen.
• One PZT node is selected as the reference node from the nodes already validated as PZT positions.
• All the nodes respecting the requirements (eligible nodes) are determined. To be selected, a node must:
(i) respect a distance at least equal to A0 from all the
validated PZT positions
(ii) respect a distance at most equal to S0 with the node
selected as the reference
(iii) respect an orientation belonging to the optimal angles rmax=350 with the node selected as the reference.
• One node is randomly selected from the nodes respecting the requirements and added to the validated PZT positions. Eligible nodes common to multiple PZT nodes and the farthest node from the existing PZT nodes are favored.
End
Step 3: the algorithm stops.
• The distance between each node of the mesh and the validated PZT positions is computed.
• If each node of the mesh is at a distance lower than rmax
=360 of any PZT, the algorithm stops. Else, it returns to step 2.
End
This approach may appear basic compared to other studies focusing on network optimization, but it does allow for a simple transition from a local model to a larger structure. A constraint on boundary conditions is also considered to avoid the influence
of border reflection on measured signals. Figure16shows the solver process for the selection of the first ∅d > 7 mm PZT
nodes respecting A0, A0 and S0. The ‘forbidden’ orientation
refers to orientations A0and S0, corresponding to orientation not
contained in A0. It is important to notice that the placement
requirements are constrained by the capability of two neigh-boring PZTs to allow mode decomposition on the path they form: if a dual-PZT is placed in a forbidden orientation (see figure16), the decomposition process may be difficult to apply.
However, damage in this zone will always interact with the propagating waves (at least with the S0mode, since it is less
influenced by ply orientations than the S0 mode, and is
gener-ated over all the given excitation frequency ranges with the wavelength allowing interaction with the targeted damage size), hence the influence of the damage on both modes will still be measured by the dual-PZT path. In an aeronautical context, a minimum number of transducers should be observed for weight purposes. In practice, the algorithm considers this by taking a minimal distance which is close to rmax instead of rmin.
4. Results
4.1. Tested cases
Four different cases (described in table4) are considered in
order to show the applicability of the process to different
Figure 15.Four different cases showing the ability of dual-PZTs to decompose modes with different positioning under experimental conditions.
structures. These cases are considered to show the influence of the anisotropy of the material on the PZT network pro-posed, and the implementation to 2D and 3D structures. Two different geometries and three materials are used. The first geometry is a large plate of 2000´500´2 mm ,3 and the
second one is the geometry of the subpart from the fan cowl (see figure 3). Three different materials are compared (see
table4). The first is the highly anisotropic CFRP with 16 plies
oriented at(0/90 , used for structures) #1 and #4. The second material is an isotropic material with simplified properties as displayed in table3 and used for structure#2. The third one is a quasi-isotropic CFRP with 16 plies oriented at (0/90/45/ -45) and the properties of each ply described in table1(the same ply properties as structures #1
and#4).
Figure17 shows the variation of the amplitudes of the
A0 and S0 modes with the orientation depending on the
material properties.
4.2. Results
Table4 sums up the results obtained for the dual-PZT net-work implementation on the four different structures descri-bed in the previous paragraph. For each structure, outputs from each step are displayed.
4.3. Observations
For all structures, the same dual-PZT dimensions are advised as the output of step 1(see table4). Actually, the variations of
the mechanical properties of the material influence the usable range of frequencies more than the dimensions of the dual-PZT. The dual-PZT dimensions would be more affected by changing the damage size(downsized as the damage size is lowered and vice-versa). For the chosen composite materials, there is very little variation of the mechanical properties, hence the range of excitation frequencies obtained with the dispersion curves does not change a lot. The frequency range
would be more affected by a change in the thickness of the material: for a given material if the thickness is divided by n, the range of frequencies obtained as the output of step 1 would be divided by n.
Comparing the results obtained for structures#1 and #2 from table 4 shows the influence of the anisotropy of the structure on the PZT network. For the isotropic material, there is no amplitude variation of modes with orientation (see figure17), and a greater distance between transducers rmaxcan
be achieved with respect to the superposition and amplitude ratio criteria. This greater distance, and the fact that there is no orientation constraint for structure#2 leads to a smaller PZT network of only 12 dual-PZTs, compared to the 16 obtained for the anisotropic case of structure #1. The minimum dis-tance (rmin=150 mm) of structure #2 is imposed by the superposition criteria in opposition to #1, where the mini-mum distance(rmin=230 mm) is imposed by the amplitude ratio criteria.
Structures #2 and #3 show very little difference since the mode attenuation with orientation for these two materials is very similar, and in both cases, the S0 and A0 mode
amplitude is constant with the orientation in contrast to the anisotropic material(see figure17). The S0mode amplitude in
the isotropic case is greater than in the quasi-isotropic case leading to a smaller maximum distance between transducers (rmax=350 mm for structure #2 and rmax=360 mm for
structure #3).
A comparison of results obtained for structures#1 and #4 from table 4 shows the ability of the algorithm to be applied to 3D meshes and to provide a PZT network that respects the placement constraints. The introduction of a cavity in the structure is not really taken into account by the algorithm. It is somehow considered that since no PZT node can be placed in the hole (it does not contain any nodes), a supplementary constraint on the boundary conditions is applied to the hole edges, and the computing of distances between nodes takes the hole into account.
Figure 16.An illustration of the solver parameters and PZT node selection process. The optimization solver chooses nodes that are optimal for the maximum number of PZT nodes available.
5. Discussion
The proposed method opens several discussion points: • The sizing method described in the first step of the process
is theoretical. Experimental measurements often give exploitable results, even if the PZT dimensions do not respect the Lamb wave constraints. However, this theor-etical approach is thefirst attempt to justify the dual-PZT
electrode sizes, and these dimensions are consistent with the physical properties of the structure and the Lamb wave propagation. There is not only one good sizing, but this method gives landmarks for the choice of the dual-PZT, which is hardly discussed in other studies. The range of frequencies chosen does not take into account the continuous mode conversion well described in [9, Pt. IV]. However, by targeting a minimal amount of damage Æ > 7 mmd (the maximum width of roving in twill fabric
Table 4.The application of the process to four different structures.
Structure#1 Structure#2 Structure#3 Structure#4
Geometry Plate Plate Plate Fan cowl
Material (0/90)16 Isotropic (0/90/45/-45)16 (0/90)16 STEP 1 OUTPUT ÆPZT-disk (mm) 5.5 5.5 5.5 5.5 ÆinnerPZT-ring (mm) 7.5 7.5 7.5 7.5 ÆPZTouter-ring (mm) 27.5 27.5 27.5 27.5 f0 (kHz) 12134 12134 13138 14134 STEP 2 OUTPUT rmin(mm) 230 150 150 230 rmax(mm) 270 350 360 270 qforbidden p (( /2) ) 17, 73 — — 17, 73 f0 (kHz) 50140 50140 50140 50140 STEP 3 OUTPUT PZT network Number of PZTs 16 12 11 14
composites), the wavelengths of both modes obtained in the selected range of frequencies are larger than the eventual roving, thus limiting the continuous mode conversion due to the coupling elements. This phenom-enon could be responsible for A0 mode measurements
arriving before the main wave packet in experimental conditions.
• The thresholds for the superposition criteria and the amplitude ratio criteria may appear arbitrary, but they have been empirically verified. They could be softened if the aim is to place fewer transducers on the structure, or hardened if the aim is to obtain the best mode decomposition results. This article presents a concept methodology here and some parameters can beflexible. • The large structure presented in this article is not very
complex compared with other SHM applications (only one hole, no stiffener) and the proposed optimization solver would not be very robust for very complex structures. Still, the local FEM approach could be improved by integrating stiffeners, holes, and/or complex local geometries preventing the simulation from modeling the full-scale model at once.
• Hypotheses done on the local FEM are not very strong and allow us to have a good appreciation of the limiting criteria for the current BF-SHM methods. Even if the model has been calibrated properly tofit the real material, future works on composite structure will allow the validation of the obtained optimal parameters meeting the targeted expectations.
• The results obtained for different structures in part 4 show that a quasi-isotropic structure behaves quite similarly to an isotropic one concerning mode attenuation with orientation. This observation shows that for such a poorly anisotropic structure, the orientation between transducers has no influence on the designed PZT network, and larger distances can be considered since the amplitude ratio between A0 and S0 modes is nearly constant in all
directions. In the case of highly anisotropic structures, the
amplitude of both modes greatly depends on the propagation orientation, and it has a large impact on the distance and orientation between transducers.
6. Conclusion
This article presents a process to design a PZT network on a large structure for BF-SHM methods based on the tracking of mode variations in a composite structure. This work falls within the framework of research which tries to bridge the gap between what is undertaken in the laboratory and the indus-trial deployment of SHM processes[47]. Indeed, the method
proposed in this work tackles one of the problems that hinders the deployment of a promising dual-PZT BF-SHM method, which is how to choose the PZT elements optimally in terms of size, number and placement.
Thefirst contribution of this work is to propose a generic solution to the choice of dimensions of the dual-PZT(used to decompose the A0and S0 mode contributions in the response
signal) based on the dispersion curves and the damage size to detect. This also brings out the range of excitation frequencies that favors interaction with the eventual damage.
The second contribution resides in the precise and careful exploitation of Lamb wave mode propagation simulated in a local FEM. In particular, two criteria are proposed(the mode superposition ratio and the mode amplitude ratio) in order to define the best actuator-sensor placement (optimal distance and orientation) and optimal excitation frequencies in a con-text where both A0 and S0 modes have to propagate in the
structure and be measured by the PZT sensor. This local model gives the relevant parameters for the last key point of this article, which is a simple PZT network optimization solver. This solver guarantees that dual-PZTs are optimally placed on the monitored structure, and together with the local FEM avoids the need for a large-scale FEM simulation.
This article does not give an absolute method for PZT network design but proposes a generic process: given the
Figure 17.The mode attenuation for the three materials used in the tested cases of A0(red) and S0(blue) with varying orientation atf0 =100 kHz and a distance of 150 mm from the disk part of the dual-PZT used as the actuator.
material and geometry of a structure, dual-PZT size, place-ment and excitation frequencies are proposed in order to optimize the implementation of the BF-SHM method on the structure to monitor. The authors have chosen to apply it to four different structures. This emphasizes the need for a local FEM for highly anisotropic structures to understand the Lamb wave propagation in such materials before being confronted with unexplainable results in real experimentation.
ORCID iDs
Emmanuel Lizé https://orcid.org/0000-0002-5423-2507
Marc Rébillat https://orcid.org/0000-0003-0469-8437
References
[1] Worden K, Farrar C R, Manson G and Park G 2007 The fundamental axioms of structural health monitoring Proc. R. Soc. A463 1639–64
[2] Michaels J E and Michaels T E 2005 Detection of structural damage from the local temporal coherence of diffuse ultrasonic signals IEEE Trans. Ultrason. Ferroelectr. Freq. Control52 1769–82
[3] Roy S, Lonkar K, Janapati V and Chang F-K 2014 A novel physics-based temperature compensation model for structural health monitoring using ultrasonic guided waves Struct. Health Monit.13 321–42
[4] Wang Y, Gao L, Yuan S, Qiu L and Qing X 2014 An adaptive filter-based temperature compensation technique for structural health monitoring J. Intell. Mater. Syst. Struct.25
2187–98
[5] Wang Y, Qiu L, Gao L, Yuan S and Qing X 2013 A new temperature compensation method for guided wave-based structural health monitoring Proc. SPIE8695 86950H [6] Konstantinidis G, Drinkwater B W and Wilcox P D 2006 The
temperature stability of guided wave structural health monitoring systems Smart Mater. Struct.15 967–76 [7] Lu Y and Michaels J E 2005 A methodology for structural
health monitoring with diffuse ultrasonic waves in the presence of temperature variations Ultrasonics43 717–31 [8] Su Z and Ye L 2009 Identification of Damage Using Lamb
Waves: from Fundamentals to Applications(London: Springer) (https://doi.org/10.1007/978-1-84882-784-4)
[9] Lammering R, Gabbert U, Sinapius M, Schuster T and Wierach P(ed) 2017 Lamb-Wave Based Structural Health Monitoring in Polymer Composites(Cham: Springer) (https://doi.org/10.1007/978-3-319-49715-0)
[10] Yeum C M, Sohn H and Ihn J B 2011 Delamination detection in a composite plate using a dual piezoelectric transducer network Proc. SPIE7984 798406
[11] Gangadharan R, Murthy C R L, Gopalakrishnan S and Bhat M R 2011 Time reversal health monitoring of composite plates using Lamb waves Int. J. Aerosp. Innov.3 131–42 [12] Huang L, Zeng L and Lin J 2018 Baseline-free damage
detection in composite plates based on the reciprocity principle Smart Mater. Struct.27 015026
[13] Giurgiutiu V 2008 Structural Health Monitoring with Piezoelectric Wafer Active Sensors(Amsterdam: Elsevier) (https://doi.org/10.1016/B978-0-12-088760-6.X5001-6)
[14] Yeum C M, Sohn H and Ihn J B 2011 Lamb wave mode decomposition using concentric ring and circular piezoelectric transducers Wave Motion48 358–70
[15] Sohn H and Kim S B 2010 Development of dual PZT transducers for reference-free crack detection in thin plate structures IEEE Trans. Ultrason. Ferroelectr. Freq. Control
57 229–40
[16] Lim H J, Sohn H, Yeum C M and Kim J M 2013 Reference-free damage detection, localization, and quantification in composites J. Acoust. Soc. Am.133 3838–45
[17] An Y-K and Sohn H 2010 Instantaneous crack detection under varying temperature and static loading conditions Structural Control and Health Monitoring17 730–41
[18] Anton S R, Park G, Farrar C R and Inman D J 2007 On piezoelectric Lamb wave-based structural health monitoring using instantaneous baseline measurements Proc. SPIE6532
65320B
[19] Anton S R, Inman D J and Park G 2009 Reference-free damage detection using instantaneous baseline measurements AIAA J.47 1952–64
[20] Alem B, Abedian A and Nasrollahi-Nasab K 2016 Reference-free damage identification in plate-like structures using Lamb-wave propagation with embedded piezoelectric sensors J. Aerosp. Eng.29 04016062
[21] Bagheri A, Li K and Rizzo P 2013 Reference-free damage detection by means of wavelet transform and empirical mode decomposition applied to Lamb waves J. Intell. Mater. Syst. Struct.24 194–208
[22] Sohn H, Woo Park H, Law K and Farrar C R 2006 Combination of a time reversal process and a consecutive outlier analysis for baseline-free damage diagnosis J. Intell. Mater. Syst. Struct.18 335–46
[23] Park Hyun Woo, Law Kincho H and Farrar C R 2007 Damage detection in composite plates by using an enhanced time reversal method J. Aerospace Eng.20 140–51
[24] Park H W, Sohn H, Law K H and Farrar C R 2007 Time reversal active sensing for health monitoring of a composite plate J. Sound Vib.302 50–66
[25] Liu Z, Zhong X, Dong T, He C and Wu B 2016 Delamination detection in composite plates by synthesizing time-reversed Lamb waves and a modified damage imaging algorithm based on RAPID Struct. Control Health Monit.24 (5) [26] Park H W, Kim S B and Sohn H 2009 Understanding a time
reversal process in Lamb wave propagation Wave Motion46
451–67
[27] Kim S B and Sohn H 2008 Instantaneous crack detection using dual PZT transducers Proc. SPIE6935 693509
[28] Worden K and Burrows A P 2001 Optimal sensor placement for fault detection Eng. Struct.23 885–901
[29] Dogancay K and Hmam H 2009 On optimal sensor placement for time-difference-of-arrival localization utilizing
uncertainty minimization Proceedings of the 48h IEEE Conference on Decision and Control(CDC) held jointly with 2009 28th Chinese Control Conferencepp 1136–40 [30] Gao H and Rose J L 2006 Ultrasonic sensor placement
optimization in structural health monitoring using evolutionary strategy AIP Conf. Proc.820 1687–93 [31] Flynn E B and Todd M D 2010 Optimal placement of
piezoelectric actuators and sensors for detecting damage in plate structures J. Intell. Mater. Syst. Struct.21 265–74 [32] Flynn E B and Todd M D 2010 A Bayesian approach to
optimal sensor placement for structural health monitoring with application to active sensing Mech. Syst. Signal Process.24 891–903
[33] Fendzi C, Morel J, Rébillat M, Guskov M, Mechbal N and Coffignal G 2014 Optimal sensors placement to enhance damage detection in composite plates 7th European Workshop on Structural Health Monitoring pp 1–8 [34] Thiene M, Khodaei Z S and Aliabadi M H 2016 Optimal
sensor placement for maximum area coverage(MAC) for damage localization in composite structures Smart Mater. Struct.25 095037
[35] Salmanpour M S, Sharif Khodaei Z and Aliabadi M H 2017 Transducer placement optimisation scheme for a delay and sum damage detection algorithm Struct. Control Health Monit.24 e1898
[36] Lamb H 1917 On waves in elastic plates Proc. R. Soc. A93 144-128
[37] Marzani A and Bocchini P Guided waves made easywww. guiguw.com
[38] Rose J L 2004 Ultrasonic Waves in Solid Media (Cambridge: Cambridge University Press)
[39] Raghavan A and Cesnik C E S 2005 Finite-dimensional piezoelectric transducer modeling for guided wave based structural health monitoring Smart Mater. Struct.14 1448–61 [40] Balmes E, Bianchi J and Leclere J Structural Dynamics
Toolbox 6.2(for use with MATLAB)http://sdtools.com/ [41] Gresil M and Giurgiutiu V 2015 Prediction of attenuated guided
waves propagation in carbonfiber composites using Rayleigh damping model J. Intell. Mater. Syst. Struct.26 2151–69 [42] Balmès E, Guskov M and Bianchi J-P 2016 Validation and
verification of FE models of piezo based SHM systems
ISMA Int. Conf. on Noise and Vibration Engineering pp 1527–38
[43] Fendzi C, Rébillat M, Mechbal N, Guskov M and Coffignal G 2016 A data-driven temperature compensation approach for structural health monitoring using Lamb waves Struct. Health Monit.15 525–40
[44] Yeum C M, Sohn H, Ihn J B and Lim H J 2012 Instantaneous delamination detection in a composite plate using a dual piezoelectric transducer network Compos. Struct.94
3490–3499
[45] Su Z and Ye L 2004 Selective generation of Lamb wave modes and their propagation characteristics in defective composite laminates Proc. Inst. Mech. Eng. Part J. Mater. Des. Appl.
218 95–110
[46] Kim Y-H, Kim D-H, Han J-H and Kim C-G 2007 Damage assessment in layered composites using spectral analysis and Lamb wave Compos. Part B Eng.38 800–9
[47] Cawley P 2018 Structural health monitoring: closing the gap between research and industrial deployment Struct. Health Monit.17 1225–44