Science Arts & Métiers (SAM)
is an open access repository that collects the work of Arts et Métiers Institute of Technology researchers and makes it freely available over the web where possible.
This is an author-deposited version published in: https://sam.ensam.eu Handle ID: .http://hdl.handle.net/10985/19449
To cite this version :
Steven ARAUJO, Nicolas DELPOUVE, Sandra DOMENEK, Alain GUINAULT, Roman
GOLOVCHAK, Roman SZATANIK, Adam INGRAM, Cyrille FAUCHARD, Laurent DELBREILH, Eric DARGENT Cooperativity Scaling and Free Volume in Plasticized Polylactide
-Macromolecules - Vol. 52, n°16, p.6107-6115 - 2019
Any correspondence concerning this service should be sent to the repository Administrator : [email protected]
Cooperativity Scaling and Free Volume in Plasticized Polylactide
Steven Araujo,
*
,†,‡Nicolas Delpouve,
†Sandra Domenek,
§Alain Guinault,
∥Roman Golovchak,
⊥Roman Szatanik,
#Adam Ingram,
∇Cyrille Fauchard,
‡Laurent Delbreilh,
†and Eric Dargent
††Normandie Univ, UNIROUEN Normandie, INSA Rouen, CNRS, Groupe de Physique des Matériaux, 76000 Rouen, France ‡CEREMA, Direction territoriale Normandie Centre, 76120 Grand-Quevilly, France
§UMR Ingénierie Procédés Aliments, AgroParisTech, INRA, Université de Saclay, 1 Avenue des Olympiades, F-91744 Massy Cedex, France
∥Laboratoire PIMM, Ensam, CNRS, Cnam, 151 Boulevard de l’Hôpital, 75013 Paris, France
⊥Department of Physics and Astronomy, Austin Peay State University, Clarksville, Tennessee 37044 United States #Institute of Physics, Opole University, Opole PL-45052, Poland
∇Faculty of Physics, Opole University of Technology, Opole PL-45370, Poland
ABSTRACT: The experimental evidence of the increase of activation energy associated with the super Arrhenius behavior governing amorphous polylactide by free volume variations has been obtained through a combination of calorimetric, dielectric, and positron annihilation lifetime measurements. The amount of free volume in polylactide was controlled by the amount of acetyltributylcitrate plasticizer in the composition. Plasticization is shown to decrease both the fragility index and the scale of cooperative motions at the glass transition. The calculations of volume and energetic
components of kinetic fragility reveal that the fragility drop is governed by the change in the size of cooperative rearranging region. As a result, direct correlation has been established between cooperativity and activation energy for the entire plasticized polylactide series. It is also shown that cooperativity variations with both temperature and plasticizer content can be simplified as a master curve with free volume.
■
INTRODUCTIONUpon cooling toward glass transition, the temperature dependence of relaxation times for polymer glass formers tend to deviate from conventional Arrhenius law.1−3 The parameter m, fragility index, indicator of relaxation time vs temperature behavior in the supercooled liquid state, is commonly used4to characterize this relaxation time deviation at Tg m d d log ( ) T T T T 10 g g τ = = i k jjj y{zzz (1) In many studies, this so-called viscous slowing down of supercooled liquid is associated with drastic change in the energy barrier that the structural units must overcome to enable relaxation process.3,5−7 The activation energy of segmental relaxation, Ea, can be obtained from dielectric relaxation spectroscopy (DRS) according to
( )
E ln( )R T a max 1 τ = ∂ ∂ α (2)where Tαis the segmental relaxation temperature, τmaxis the relaxation time at a given Tα, and R is the universal gas constant.
Cooperative Rearranging Regions (CRR). While the reason for drastic increase in the activation energy near Tg is not understood yet, several studies correlate the viscous slowing down to the cooperative character of relaxation dynamics.8−14In the approach proposed by Adam and Gibbs,9 the segmental relaxation occurs within the so-called cooper-ative rearranging regions (CRRs), defined as the smallest subsystems in which the main relaxation process occurs independent of the dynamics of the neighboring subsystems. Each CRR is characterized by its own thermodynamic variables and relaxation dynamics.9 Another approach, proposed by Berthier et al.,15relies on the number of correlated molecules
Ncorr. Experiments of Bauer et al.16successfully established a correlation between Ncorr (obtained from nonlinear dielectric measurements10) and activation enthalpy (obtained from linear dielectric measurements) for liquid glass formers such as glycerol, depicting the increasingly cooperative nature of the molecular motions in space and time. Recently, the same team demonstrated such a correlation (although more complex) for plastic crystal.17 However, to the best of our knowledge, a direct experimental correlation between activation energy and cooperative motions in polymers has not been demonstrated yet.
From calorimetric measurements, Donth18,19 proposed to estimate the average volume of a CRRξTα3(also the number of relaxing units per CRR, Nα), which is related to cooperative motions, from the temperaturefluctuations associated with the alpha relaxation process
k T T T C C 3 1 p 1 p B 2 2 T T glass liquid ξ ρδ = − α α α α i k jjjj y{zzzz (3) where Cp is the specific heat capacity at constant pressure, kBis the Boltzmann constant, Tα is the dynamic glass transition temperature, ρ is the density, and δT is the mean square temperature fluctuation associated with the glass transition. Strictly speaking, Ncorr and Nα are two different parameters obtained from nonlinear dielectric measurement and temper-ature fluctuation, respectively, dealing nevertheless with the same concept of cooperative motions. Saiter et al.20,21 combined the calorimetric and linear dielectric measurements to apply the Donth’s equation in an extended domain of temperature ranging from the crossover region (corresponding to the rise of cooperativity) to the glass transition. They observe an increase of cooperativity when cooled down to glass transition temperature, consistence with the increase of activation energy. However, the structural cause of the cooperativity increase at the macromolecular scale is not clearly established.
Structural Dependence of Cooperativity. The cooper-ativity length depends not only on temperature but also on structural constraints. Many studies report that confinement effect decreases the CRR size such as in nanoparticles,22 nanolayers,23intercalated nanocomposites,24and semicrystal-line polymers.25 Cooperativity is also impacted by any modification of intermolecular interactions as observed in plasticized polylactic acid (PLA),26when electron-donor and electron-acceptor side groups are associated in statistical methacrylate copolymers,27or whenπ-stacking is hindered in polycarbonate.28A hydrogen-bonding model was proposed by Nakanishi et al.,29 supporting the increase of CRR size with intermolecular interactions. When structural changes govern the cooperativity variations, the relaxation time temperature dependence does not necessarily evolve accordingly.30Recent studies have highlighted some discrepancies between the variations of fragility and cooperativity length with structural changes.31,32 For example, Liu et al.33 proposed to tune the dynamic fragility in acrylic polymers by modifying the intermolecular interaction with the addition of small molecules. They reported that the formation of hydrogen bonding increases the glass transition temperature and cooperativity but induces a decrease in fragility. Hong et al.34,35 studied a large number of glass-forming liquids including polymers and reported no clear correlation between
ξTα and m. As a consequence, the relation between cooperativity and activation energy might also be more complex than initially assumed.
Volume and Energetic Components of the Fragility Index. Hong et al.35 attempted to explain the inconsistency between ξTα and m by separating the fragility in two contributions: the isochoric fragility mV associated with the temperature dependence of the structural relaxation time at a constant volume and (m− mV), corresponding to the volume contribution. Following their assumption, the fragility can be written as m m V k Ln(10) T V B α κ = + Δ # (4) where κ is the compressibility and αT is the coefficient of thermal expansion of the supercooled liquid at Tg. The ratio αT/κ goes from 0.5 to 3.0 MPa K−1for a wide range of glass formers, and ΔV# is equal to approximately 4% of the cooperativity volume. Thus, only the parameter (m− mV) is assumed to be directly correlated to the cooperativity at the glass transition. Consequently, fragility varies accordingly with cooperativity only when mVremains invariant.
Structural Interpretation of the Two Fragility Components. In a recent study on the interpenetrated polymer networks,36we proposed a structural interpretation of the two components governing the liquid fragility in polymers. In this representation, (m− mV) depends on the interchain interactions, whereas the stiffness of the backbone mainly influences mV. Therefore, one can assume that structural changes impacting only the interchain interactions without affecting the polymer backbone stiffness should lead to ideal variations of fragility and activation energy with cooperativity. To challenge this assumption, we investigate in this study a system in which it is possible to selectively break the intermolecular interactions between macromolecules. Consid-ering the gel theory introduced by Doolittle37,38in the 1950s, plasticization interrupts the noncovalent bonds between the macromolecules without damaging the covalent bonds. Thus, in this study, the inter-relationships between cooperativity, fragility, and activation energy are investigated in plasticized polylactide to different degrees, from the rise of cooperativity down to the glass-transition temperature. Because it is difficult to quantify the amount of interchain interactions, we have chosen to estimate the amount of additional free volume generated by plasticization.39−41 To do so, the experimental evidence of free volume changes was obtained through the positron annihilation lifetime spectroscopy (PALS).
■
EXPERIMENTAL SECTIONMaterials. PLA with a D content of 8% was provided by NatureWorks. Acetyltributylcitrate (ATBC, CAS number 77-90-7) was obtained from Sigma Aldrich (France). PLA and ATBC were dried at 80°C under vacuum for 12 h. Blending was performed with an internal mixer (Haake Rheocord 9000) at 160°C and 60 rpm for 15 min. After a successive drying step (4 h at 80°C under vacuum), the samples were thermomolded between two hot plates under 10 bars for 2 min and quenched to room temperature. The processing procedure yielded amorphous PLA x% ATBCfilms, with the weight percentage of plasticizer x included between 2.5, 5, 9, and 13%w, referred to as PLA x% in the text. The average molecular weight (Mn) of the PLA after processing calibrated against polystyrene standards was 90 500 g mol−1estimated from size exclusion chromatography (M0,PLA= 72.06, polydispersity = 2.75 and number average degree of polymerization = 1117).
Modulated Temperature Differential Scanning Calorimetry (MT-DSC). Modulated temperature differential scanning calorimetry (MT-DSC) analyses were carried out by DSC Q100 (TA instru-ments) under a nitrogen atmosphere. The samples (about 10 mg) were put into hermetic aluminium pans (T-Zero, TA Instruments). The calibration was carried in three steps using standards of indium and benzophenone for temperature calibration, indium for energy calibration, and sapphire for heat capacity calibration. Experiments were performed under a nitrogen atmosphere (70 mL min−1) with an oscillation amplitude of 1.5°C, a period of 80 s, and a heating rate of 1°C min−1. These conditions correspond to the heat−cool mode and are required for a clear analysis of the glass transition. The modulation step number was estimated to be higher than five during the glass transition. The complete deconvolution procedure was done as proposed by Reading,42and the phase angle correction as proposed by Weyer et al.43Before the MT-DSC measurements, the samples were heated at 10°C min−1up to a temperature just above the glass transition range and cooled at 10°C min−1down to 0°C to erase thermal history.
Dielectric Relaxation Spectroscopy (DRS). Dielectric relaxa-tion spectroscopy (DRS) measurements were performed on samples with 30 mm diameter and 200 μm thickness (parallel brass electrodes) with a broadband frequency response analyzer (Alpha Analyzer, Novocontrol Technologies). The temperature was con-trolled with a Novocontrol Quatro system. Complex dielectric permittivity measurements were acquired isothermally every degree from 5°C below calorimetric glass transition temperature to 40 °C above calorimetric Tg. The frequency window ranged from 10−2to 106Hz. To analyze the dielectric curves, the Havriliak−Negami (HN) complex function was used44
( ) 1 (i ) HN HN HN HN ε ω ε ε ωτ * = + Δ [ + α ]β ∞ (5) where ω (= 2πf) is the angular pulsation, ΔεHN is the relaxation strength (=εs− ε∞),τHNis the relaxation time, andαHNandβHNare shape parameters corresponding, respectively, to the broadening and the asymmetry of the relaxation.
Positron Annihilation Lifetime Spectroscopy (PALS). Posi-tron annihilation lifetime spectroscopy (PALS, ORTEC Instrument) was performed with the fast coincidence system (ORTEC) of 230 ps resolution within Tg− 20 K − Tg+ 20 K temperature range (0.007 K
min−1ramp) at 35% relative humidity. Each spectrum contained 8.105 coincidences in total. Isotope22Na (activity∼2 MBq) was used as the source of positrons and sandwiched between two identical samples. The PALS spectra analysis was performed according to the three components fitting (Standard LT 9.0 program45). The third component (lifetimeτ3, intensity I3) is used to estimate the fraction of free volume ( fv) with the following approach46
f (%) A I(%) 4 R 3 v 3 3 π = · (6) where the coefficient A ≈ 1.8 in polymers46and R is the radius of
pores (in nm) calculated according to the Tao−Eldrup model47,48 R R R R R R R 1 ( ) 1 1 2 sin 2 0.007 o P A s TE TE τ λ λ π π = ≅ − + Δ + + Δ + − i k jjjjj y{zzzzz Ä Ç ÅÅÅÅÅ ÅÅÅÅ ikjjj y { zzz É Ö ÑÑÑÑÑ ÑÑÑÑ (7) where A s t 2 1 4 3 4 1 ns
λ = λ + λ ≅ is the average weighted annihilation rate of positrons in vacuum andΔR = 0.18 nm for cylinderlike pores.49,50
■
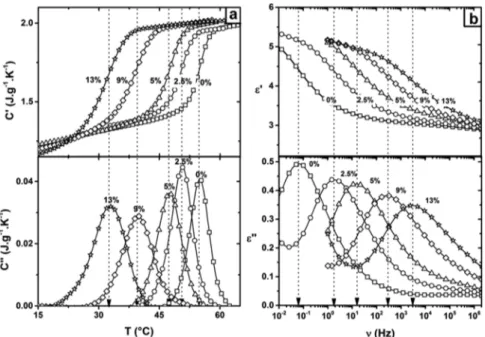
RESULTS AND DISCUSSIONFigure 1 depicts the glass transition signature of neat and plasticized PLA (x%) recorded from MT-DSC (Figure 1a) in temporal domain and from DRS (Figure 1b) in frequency domain. MT-DSC results show a progressive decrease in the glass transition temperature from 328 K (PLA 0%) to 306 K (PLA 13%) accompanied by a broadening of the temperature range due to the plasticization of PLA. Such a decrease in Tg and a broadening of the glass transition range should result in a decrease of the CRR size (eq 3) due to an increase in temperature fluctuations. Besides, the dielectric signature of the glass transition shifts toward high frequency when x% increases, revealing an increase in the relaxation rate. These variations are indicators of the modification of the molecular mobility due to the reduction of the intermolecular interaction Figure 1.(□) PLA 0%, (○) PLA 2.5%, (△) PLA 5%, (◇) PLA 9%, and (star) ATBC 13%. (a) MT-DSC in-phase (C′) and out-of-phase (C″) components of the complex heat capacity versus temperature. Arrows illustrate the MT-DSC midpoint of the glass transition (b) DRS real part (ε′) and imaginary part (ε″) of the complex permittivity versus frequency at 332 K. Arrows depict the maximum frequency of the main relaxation process.
density. This plasticization effect was previously reported in PLA from MT-DSC26,51−53and DRS.52,53
It should be noted here, that mixing two polymers (or plasticizer and polymer) together may lead to a broadening of the glass transition range due to concentration fluctuations, which has nothing to do with temperaturefluctuations.54−59
Colmenero and Arbe60 performed a review on relaxation dynamics and concentration fluctuations in polymer blends. They reported that blending two polymers together to a certain extent leads to concentrationfluctuations, resulting in two main effects on the alpha relaxation. First, a double peak during the alpha relaxation may be observed. Second, the alpha relaxation signature broadens when the temperature is decreased close to Tg. According to DRS data (Supporting
Information), there is no obvious indication of a double peak during the alpha relaxation at any temperature and for any plasticizer concentration. Also, PLA 13%α relaxation does not exhibit an obvious broadening in frequency when the temperature decreases close to Tg. Consequently, there is no indication of significant concentration fluctuations in our system up to ATBC 13% (limit of miscibility61between PLA and ATBC around 50 wt %). Therefore, in the investigated blends, the concentration fluctuations may be considered negligible compared to the temperaturefluctuations as a result of plasticization (see theSupporting Informationfor a detailed explanation).
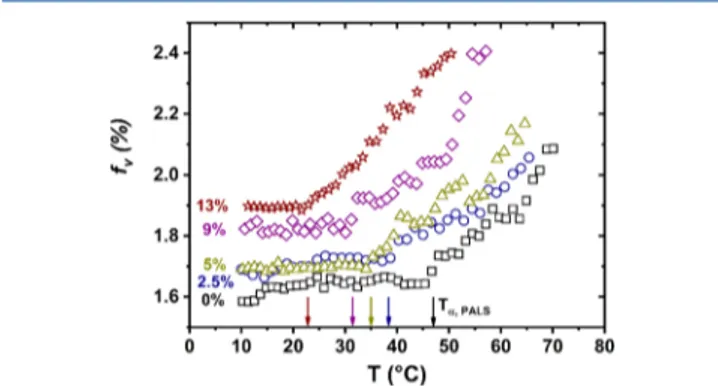
Structural information regarding mobility changes was obtained from PALS as shown in Figure 2 (raw PALS data
and theirfits are given in theSupporting Information). At low temperature, the free volume of each sample remains nearly constant. This effect is in agreement with the free volume concept,38 where the macromolecular segments in the glassy state are densely packed, acting as a frozen liquid structure where the internal mobility is negligible. Nevertheless, the free volume fraction slightly increases (from 1.6% for PLA 0% to 1.9% for PLA 13%) with the plasticizer content, depicting a slight increase in the diameter of holes and their number due to plasticization. The arrows in Figure 2 depict the PALS signature of the glass transition. Although lower than the calorimetric signature of the glass transition, Tα,PALS also decreases with the plasticizer content. Once the energetic barrier of the main relaxation is surpassed (Tg), the internal liquid configuration changes, and the space between atoms and molecules becomes bigger, allowing the segments to move
away from each other.38It is revealed here by an increase of free volume with temperature. Same plasticization effect can be seen above Tg, i.e., the free volume values are higher when x% increases. These variations seem to strengthen the idea that the plasticizer spreads out the macromolecular chains of PLA by reducing the intermolecular interactions between the PLA chains.
The increase of free volume can be correlated to the structural modifications in PLA. As mentioned in Introduction section, plasticization is expected to break intermolecular interactions without affecting the covalent bonds. In PLA, the monomer unit contains carbonyl oxygen, which prevents the creation of hydrogen bond.62So, the macromolecular chains are linked with each other mainly by van der Waals and n→ π* interactions. The ATBC plasticizer does not contain alcohol groups but contains carbonyl oxygen groups such as PLA, enabling the polymer and plasticizer to link to each other by weak intermolecular interactions. Only the PLA end chains are constituted of alcohol groups, which may induce hydrogen bond linkages, so the probability to create hydrogen bonds remains weak and the amount of hydrogen bonds is negligible compared to the van der Waals forces. In this respect, we henceforth assume that all of these interactions are interchain interactions that the plasticizer is able to modify.
To determine the effect of plasticization on the segmental relaxation above the glass transition temperature, where PALS measurements show a rapid increase of the free volume in
Figure 2, the DRS measurements were analyzed with the Havriliak−Negami equation (eq 5).
Figure 3a presents the relaxation time (τmax) as a function of inverse temperature related to the segmental relaxation for each sample. The data points are well-fitted (full lines) with the Vogel−Fulcher−Tammann−Hesse (VTFH) law63−65
DT T T exp 0 0 0 τ =τ − i k jjjjj y{zzzzz (8)
where τ0 is a pre-exponential factor, T0 is the Vogel temperature, and D is a steepness parameter. The glass transition temperature obtained from DRS, calculated by the extrapolation of VTFHfitting to τmax= 100 s, is shifted toward lower temperatures (from 327.5 K for PLA 0% to 304 K for PLA 13%) by adding the plasticizer (represented by full symbols inFigure 3a). This is in consistence with the results presented inFigure 1.
The segmental relaxation is impacted by the amount of plasticizer, evolving from a so-called “super Arrhenius” behavior with a high curvature for neat PLA toward lower curvatures for a highly plasticized PLA. This means that the relaxation time temperature dependence in PLA becomes closer and closer to the Arrhenius prediction with the increasing content of the plasticizer.52,53 To estimate the degree of deviation from the Arrhenius law, the fragility index m (eq 1) can be determined from the normalized plot Tα,DRS/ T, as shown inFigure 3b.
The calculated fragility index m shows that the initially “fragile” PLA, m = 152, reaches a much “stronger” behavior with plasticization, m = 87, for PLA 13%. It is worth mentioning that this decrease is significant since the fragility index drops almost by 43% for the highest plasticized PLA. Inset inFigure 3b presents the existing correlation between the glass transition temperature and the fragility index when the plasticizer amount varies from 0 to 13% in the PLA. Qin et Figure 2.Free volume fv(%) as a function of temperature assessed
from PALS for (□) PLA 0%, (blue ring) PLA 2.5%, (green triangle) PLA 5%, (purple diamond) PLA 9%, and (brown star) 13% ATBC. Arrows correspond to the signature of the glass transition obtained from PALS.
al.66investigated the correlations between fragility and Tgand concluded that polymeric glass formers display roughly a linear relationship. In a previous paper,52we discussed the relation between m and x% in the frame of the CRR concept. Ngai67 restricted the correlations between fragility index and cooperativity parameters to polymers of the same chemical family (epoxy resins), i.e., higher cooperativity lengths imply higher fragility values. Consequently, cooperativity lengthξ(Tα) was calculated for our system using eq 3 and the MT-DSC results at glass transition temperature. The obtained data are in good agreement with those from Ngai:67 PLA 0% exhibits a cooperativity length ofξPLA 0%= 3 nm (with a high fragility, m = 152), whereas PLA 13% has a cooperativity length ofξPLA 13% = 2 nm (with a low fragility, m = 87). Intermediate plasticized PLAs also have intermediate cooperativity lengths,ξPLA 2.5% = 2.8 nm,ξPLA 5%= 2.6 nm, andξPLA 9% = 2.2 nm.
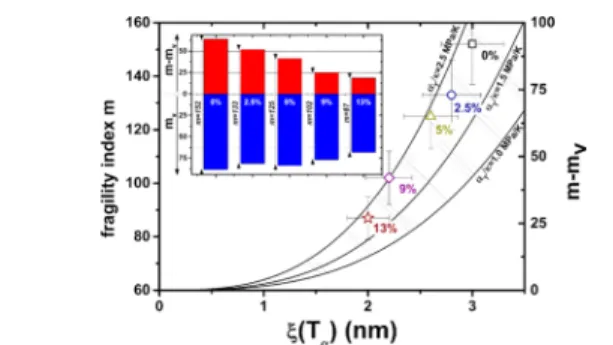
Fragility is drawn as a function of cooperativity inFigure 4. Applying the equation proposed by Hong et al.35(eq 4), the
theoretical domain of volume contribution (hatched area) is superimposed on the experimental data of the fragility index as a function of the cooperativity length. For afixed value of αT/κ, m vsξ should follow a linear trend if the change in fragility is ascribed solely to the variations in cooperativity, which is verified there. It is important to mention that in the literature,
such a direct correlation between the cooperativity and the fragility is not universally reported.30,35The bar chart in the inset ofFigure 4gives a better illustration of the thermal and volume contributions to fragility (calculated fromeq 4). The volume contribution to fragility (m − mV) falls significantly when increasing the plasticizer content, whereas the thermal contribution (mV) only slightly decreases with plasticizer. From the correlation between the volume contribution to the fragility and cooperativity, it is evident that the segmental dynamic variations in plasticized PLA are mainly governed by the variations of intermolecular interactions.
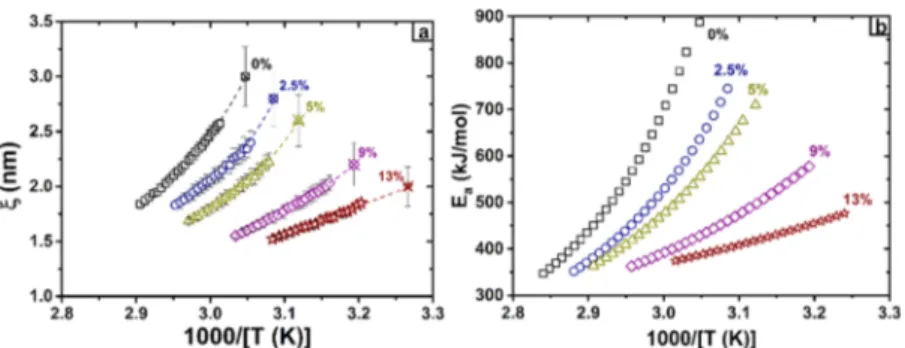
Another parameter affecting the intermolecular interactions is the temperature.16Bauer et al. assume that the variations of cooperativity drive the change in the activation energy upon cooling to the glass transition temperature. The extension of Donth’s model (eq 3) as applied by Saiter et al.20 allows to determine the cooperativity length above the glass transition temperature from DRS measurements. Furthermore, eq 2
allows to calculate the activation energy Earelated to segmental relaxation. Cooperativity length and activation energy calcu-lated above the glass transition temperature are presented in
Figure 5a,b, respectively.
It is shown inFigure 5that the cooperativity length and the activation energy decrease similarly with temperature, depend-ing on the plasticizer content (i.e., higher curvature for PLA 0%, smaller curvature for PLA 13%). PLA 0% cooperativity falls from 3.0 to 1.7 nm and the activation energy from nearly 900 to 350 kJ mol−1, while PLA 13% cooperativity varies from 2.0 to 1.5 nm and Earanges from 470 to 350 kJ mol−1. From these results, the correlation between intermolecular inter-actions and cooperativity is clearly confirmed. White and Lipson68developed over the recent years the cooperative free volume rate model. They state that free volume variation is a key parameter for the non-Arrhenius behavior of the primary relaxation above the glass transition temperature69 (for simulated 20-mer polymer melt). It has been shown by simulations that segmental rearrangement requires an increase in cooperativity and activation energy, along with a reduction of free volume when the glass transition is approached upon cooling.
To investigate the impact of intermolecular interactions on free volume and relaxation dynamics, we plotted the activation energy versus cooperativity length inFigure 6a and free volume versus cooperativity inFigure 6b.
Figure 3.(□) PLA 0%, (blue ring) PLA 2.5%, (green triangle) PLA 5%, (purple diamond) PLA 9%, and (brown star) 13% ATBC. Empty symbols correspond to the DRS relaxation times. Crossed symbols are the MT-DSC glass transition temperatures forτmax≈ 10 s. (a) Segmental relaxation timeτmaxversus 1000/T. Solid lines are the VTFfitting. Full symbols correspond to the glass transition temperature, called Tα,DRS, extrapolated from the VTF equation (dashed lines) toτmax= 100 s. (b) Segmental relaxation timeτmaxversus Tα,DRS/T. Inset shows the fragility index of the plasticized PLA as a function of temperature (red dashed line is a linear guideline).
Figure 4. Colored dots are the experimental fragility index m as a function of cooperativity length ξ(Tα) for each material obtained through DRS and MT-DSC measurements. The hatched area corresponds to the theoretical value domain of the “volume contribution to fragility” m − mVas a function of the cooperativity length, calculated according toeq 4, with 1.0 MPa K−1<αT/κ < 2.5 MPa K−1, that corresponds to the reduced domain of polymers investigated by Hong et al.35The inset provides the value of each contribution for all materials.
In Figure 6a, the activation energy versus the cooperativity length follows a unique trend for neat and plasticized PLA over a wide range of temperature. The superposition of the relaxations of neat and plasticized PLA could be seen in this plot as a single relaxation process with a cooperativity length changing from 3.0 to 1.5 nm with associated activation energy ranging from 900 to 400 kJ mol−1, in good agreement with Bauer et al.16 This “master relaxation curve” is obtained by combining the effect of plasticizer and temperature increase, both of them resulting in the modification of intermolecular interactions. In this case, it is possible to approximate the activation energy at cooperativity minimum ξmin. The extrapolation of the superposed data for neat and plasticized PLA (blue dashed line) may be carried out with a cubic law (eq 9) similar to the equation established by Hong et al.35(eq 4), i.e., eq 9 seems to have an asymptotic behavior at low cooperativity length when temperature and/or plasticizing effects increase
Ea( )ξ = Ea(ξmin)+A.ξ3 (9) where A is afitting constant. When cooperativity reaches its minimum, the activation energy also approaches a minimum value at∼300−350 kJ mol−1. These values are consistent with those obtained from the glassy state52 using thermally stimulated depolarization currents. In the previous work, the activation energy, determined at the glass transition temper-ature upon heating from the glassy state, was mainly associated with a nonvolume-activated part of the process. It corresponds to the green dashed line inFigure 6a, calculated as the ratio between the thermal contribution of fragility (mV, eq 4) and
the overall fragility m estimated at Tα,DRS, multiplied by the corresponding activation energy for each PLA sample. The extrapolation of this linear trend to the minimum of cooperativity gives an activation energy range (300−350 kJ mol−1) similar to the extrapolation of the overall activation energy (blue dashed line in Figure 6a). Considering the correlation between the impact of temperature and plasti-cization degree on intermolecular interactions and, as a consequence, activation energy and cooperativity, we may assume that activation energy variations above the green dashed line can be related exclusively to the intermolecular interaction modifications.
Plotting the free volume versus cooperativity in Figure 6b, two asymptotic behaviors are highlighted from the superposed data of plasticized PLA. At high cooperativity value (low temperature), the free volume seems to vary slightly around 1.8%, characterizing a weak molecular mobility of the macromolecular chains. When the free volume increases, the cooperativity decreases, and the data superimpose in a master curve taking into account the plasticizer content and temperature effect. Saiter et al.70 found a good correlation as well between cooperativity and free volume for AS−Se glasses. The second asymptotic behavior appears when the coopera-tivity reaches its minimum. So, it can be concluded that the activation energy and the free volume both follow a single master dependence if considered as functions of cooperativity and vary in a similar way. We may deduce also that the increase of activation energy at cooling is correlated with the increase in cooperativity, which itself is revealed through a decrease in free volume due to modifications of the intermolecular interactions. Figure 5.(□) PLA 0%, (blue ring) PLA 2.5%, (green triangle) PLA 5%, (purple diamond) PLA 9%, and (brown star) 13% ATBC. Open and crossed symbols are obtained from DRS and MT-DSC measurements, respectively. (a) Cooperativity length versus inverse temperature. (b) Activation energy versus inverse temperature.
Figure 6.(□) PLA 0%, (blue ring) PLA 2.5%, (green triangle) PLA 5%, (purple diamond) PLA 9%, and (brown star) 13% ATBC. Open and crossed symbols are respectively obtained from DRS and MT-DSC measurements. (a) Activation energy associated to the segmental relaxation versus cooperativity length. Blue dashed curve is drawn according toeq 9. Full symbols are related to the activation energy associated to the thermal contribution (further details are given in the main text), i.e., they were estimated from the equation: Ea(mv)=(mV/m) Ea. Green dashed dotted line is a guide for the eyes. (b) Free volume versus cooperativity length.
■
CONCLUSIONSA direct correlation between the activation energy and cooperativity, which has been a controversial point in polymer materials for a long time, is observed through the structural relaxation studies of neat and plasticized PLA. It is shown that the addition of ATBC plasticizer into PLA induces a decrease in activation energy, cooperativity, and dynamic fragility. Using this result, the master dependence of the activation energy on cooperativity can be obtained within a broad temperature range, e.g., from crossover temperature down to the glass transition temperature. It allowed the estimation of the activation energy associated with the rise of cooperative motions at the level of 300−350 kJ mol−1. For thefirst time, it is shown that free volume variations for the whole sample series can be plotted in the form of a unique master curve as a function of cooperativity. More importantly, we show that the decrease of cooperativity is directly correlated to the free volume variations that capture the modifications of interchain interactions due to temperature and structural changes. This means that the free volume model provides a robust description of the viscous slowing down of the investigated polylactide upon cooling from supercooled liquid state.
■
AUTHOR INFORMATION Corresponding Author*E-mail:[email protected]. Tel.: (+33) 2 32 95 50 79. ORCID Steven Araujo:0000-0003-2973-8140 Nicolas Delpouve:0000-0002-6064-7151 Laurent Delbreilh:0000-0002-9322-7153 Notes
The authors declare no competingfinancial interest.
■
ACKNOWLEDGMENTSThe authors would like to thank the region Haute Normandie for theirfinancial support and the acquisition of the Broadband Dielectric Spectrometer. R.G. acknowledges U.S. National Science Foundation (Grant no. DMR-1725188) for the acquisition of PAL spectrometer.
■
REFERENCES(1) Debenedetti, P. G.; Stillinger, F. H. Supercooled liquids and the glass transition. Nature 2001, 410, 259.
(2) Kivelson, S. A.; Tarjus, G. In search of a theory of supercooled liquids. Nat. Mater. 2008, 7, 831.
(3) Ediger, M. D.; Angell, C. A.; Nagel, S. R. Supercooled liquids and glasses. J. Phys. Chem. 1996, 100, 13200.
(4) Angell, C. A. Spectroscopy simulation and scattering, and the medium range order problem in glass. J. Non-Cryst. Solids 1985, 73, 1. (5) Dyre, J. C. The glass transition and elastic models of glass-forming liquids. Rev. Mod. Phys. 2006, 78, No. 953.
(6) Hecksher, T.; Nielsen, A. I.; Olsen, N. B.; Dyre, J. C. Little evidence for dynamic divergences in ultraviscous molecular liquids. Nat. Phys. 2008, 4, 737−741.
(7) Garcia, J. C.; Rzoska, S. J.; Drozd-Rzoska, A.; Martinez-Garcia, J. A universal description of ultraslow glass dynamics. Nat. Commun. 2013, 4, No. 1823.
(8) Kirkpatrick, T. R.; Wolynes, P. G. Stable and metastable states in mean-filed Potts and structural glasses. Phys. Rev. B 1987, 36, 8552.
(9) Adam, G.; Gibbs, J. H. One the temperature dependence of cooperative relaxation properties in glass-forming liquids. J. Chem. Phys. 1965, 43, 139.
(10) Crauste-Thibierge, C.; Brun, C.; Ladieu, F.; L’Hôte, D.; Biroli, G.; Bouchaud, J.-P. Evidence of growing spatial correlations at the glass transition from nonlinear response experiments. Phys. Rev. Lett. 2010, 104, No. 165703.
(11) Berthier, L. Dynamic heterogeneity in amorphous materials. Physics 2011, 4, No. 42.
(12) Ediger, M. D. Spatially heterogeneous dynamics in supercooled liquids. Annu. Rev. Phys. Chem. 2000, 51, 99.
(13) Andersen, H. C. Molecular dynamics studies of the heterogeneous dynamics and dynamic crossover in supercooled atomic liquids. Proc. Natl. Acad. Sci. U.S.A. 2005, 102, 6686−6691.
(14) Brun, C.; Ladieu, F.; L’Hote, D.; Tarzia, M.; Biroli, G.; Bouchaud, J. P. Nonlinear dielectric susceptibilities: Accurate determination of the growing correlation volume in a supercooled liquid. Phys. Rev. B 2011, 84, No. 104204.
(15) Berthier, L.; Biroli, G.; Bouchaud, J.-P.; Cipilletti, L.; El Masri, D.; L’Hote, A.; Ladieu, F.; Pierno, M. Direct experimental evidence of a growing length scale accompanying the glass transition. Science 2005, 310, 1797−1800.
(16) Bauer, T.; Lunkenheimer, P.; Loidl, A. Cooperativity and the freezing of molecular motion at the glass transition. Phys. Rev. Lett. 2013, 111, No. 225702.
(17) Michl, M.; Bauer, T.; Lunkenheimer, P.; Loidl, A. Cooperativity and heterogeneity in plastic crystals studied by nonlinear dielectric spectroscopy. Phys. Rev. Lett. 2015, 114, No. 067601.
(18) Donth, E. The size of cooperatively rearranging regions at the glass transition. J. Non-Cryst. Solids 1982, 53, 325.
(19) Chua, Y. Z.; Zorn, R.; Holderer, O.; Schmelzer, J. W. P.; Schick, C.; Donth, E. Temperature fluctuations and the thermodynamic determination of the cooperativity length in glass forming liquids. J. Chem. Phys. 2017, 146, No. 104501.
(20) Saiter, A.; Delbreilh, L.; Couderc, H.; Arabeche, K.; Schönhals, A.; Saiter, J.-M. Temperature dependence of the characteristic length scale for glassy dynamics: Combination of dielectric and specific heat spectroscopy. Phys. Rev. E 2010, 81, No. 41805.
(21) Rijal, B.; Delbreilh, L.; Saiter, A. Dynamic heterogeneity and cooperative length scale at dynamic glass transition in glass forming liquids. Macromolecules 2015, 48, 8219−8231.
(22) Zhang, C.; Guo, Y.; Priestley, R. D. Characteristic length of the glass transition in isochorically confined polymer glasses. ACS Macro Lett. 2014, 3, 501−505.
(23) Nassar, S. F.; Domenek, S.; Guinault, A.; Stoclet, G.; Delpouve, N.; Sollogoub, C. Structural and dynamic heterogeneity in the amorphous phase of poly(L,L-lactide) confined at the nanoscale by the coextrusion process. Macromolecules 2018, 51, 128−136.
(24) Saiter, A.; Prevosto, D.; Passaglia, E.; Couderc, H.; Delbreilh, L.; Saiter, J. M. Cooperativity length scale in nanocomposites: Interfacial and confinement effects. Phys. Rev. E 2013, 88, No. 042605.
(25) Schick, C.; Donth, E. Characteristic length of glass transition: experimental evidence. Phys. Scr. 1991, 43, 423−429.
(26) Monnier, X.; Delpouve, N.; Basson, N.; Guinault, A.; Delbreilh, L.; Saiter, A.; Mallon, P. E.; Dargent, E. Molecular dynamics in electrospun amorphous plasticized polylactide fibers. Polymer 2015, 73, 68−78.
(27) Grigoras, C. V.; Grigoras, A. G. Nanoscale cooperativity on a series of statistical methacrylates copolymers with electron
donor-acceptor pendant groups. J. Therm. Anal. Calorim. 2011, 103, 661− 136.
(28) Arabeche, K.; Delbreilh, L.; Adhikari, R.; Michler, G. H.; Hiltner, A.; Baer, E.; Saiter, J.-M. Study of the cooperativity at the glass transition temperature in PC/PMMA multilayered films: Influence of thickness reduction from macro to nanoscale. Polymer 2012, 53, 1355−1361.
(29) Nakanishi, M.; Nozaki, R. Model of the cooperative rearranging region for polyhydric alcohols. Phys. Rev. E 2011, 84, No. 011503.
(30) Delpouve, N.; Delbreilh, L.; Stoclet, G.; Saiter, A.; Dargent, E. Structural dependence of the molecular mobility in the amorphous fractions of polylactide. Macromolecules 2014, 47, 5186−5197.
(31) Sharma, M.; Madras, G.; Bose, S. Unusual fragility and cooperativity in glass-forming and crystalline PVDF/PMMA blends in the presence of multiwall carbon nanotubes. Macromolecules 2015, 48, 2740−2750.
(32) Puente, J. A. S.; Rijal, B.; Delbreilh, L.; Fatyeyeva, K.; Saiter, A.; Dargent, E. Segmental mobility and glass transition of poly (ethylene-vinyl acetate) copolymers: Is there a continuum in the dynamic glass transitions from PVAc to PE? Polymer 2015, 76, 213−219.
(33) Liu, C.; Liu, L.; Yin, X.; Wu, G. Tuning the dynamic fragility of acrylic polymers by small molecules: The interplay of hydrogen bonding strength. Macromolecules 2015, 48, 4196−4206.
(34) Sokolov, A. P. Cooperativity and heterogeneity in dynamics of glass-forming systems. AIP Conf. Proc. 2013, 1518, No. 104.
(35) Hong, L.; Novikov, V. N.; Sokolov, A. P. Is there a connection between fragility of glass forming systems and dynamic heterogeneity/ cooperativity? J. Non-Cryst. Solids 2011, 357, 351−356.
(36) Araujo, S.; Batteux, B.; Li, W.; Butterfield, L.; Delpouve, N.; Esposito, A.; Tan, L.; Saiter, J.-M.; Negahban, M. A structural interpretation of the two components governing the kinetic fragility from the example of interpenetrated polymer networks. J. Polym. Sci., Part B: Polym. Phys. 2018, 56, 1393−1403.
(37) Doolittle, A. K. In The Technology of Solvents and Plasticizers; John Wiley & Sons: New York, 1954; Chapters 14 & 15.
(38) Wypych, G. In Handbook of Plasticizers; ChemTech Publishing: Toronto-Scarborough, 2004, 2012 & 2017; Chapter 2, pp 7−85.
(39) Bartoš, J.; Šauša, O.; Köhler, M.; Švajdlenková, H.; Lunkerheimer, P.; Krištiak, J.; Loidl, A. Positron annihilation and broadband dielectric spectroscopy: A series of propylene glycols. J. Non-Cryst. Solids 2011, 357, 376−384.
(40) Bartoš, J.; Švajdlenková, H. On the mutual relationships between spin probe mobility, free volume and relaxation dynamics in organic glass-formers: Glycerol. Chem. Phys. Lett. 2017, 670, 58−63. (41) Švajdlenková, H.; Arrese-Igor, S.; Nógellová, Z.; Alegria, A.; Bartoš, J. Molecular dynamic heterogeneity in relation to free volume and relaxation dynamics in organic glass formers: Oligomeric cis-1,4-poly(isoprene). Phys. Chem. Chem. Phys. 2017, 19, 15215−15226.
(42) Reading, M.; Hourston, D. J. In Modulated Temperature Differential Scanning Calorimetry; Springer: Dordrecht, The Nether-lands, 2006; Vol. 6, Chapter 1, pp 1−81.
(43) Weyer, S.; Hensel, A.; Schick, C. Phase angle correction for TMDSC in the glass-transition region. Thermochim. Acta 1997, 304-305, 267−275.
(44) Havriliak, S.; Negami, S. A complex plane analysis of α-dispersions in some polymer systems. J. Polym. Sci., Part C: Polym. Symp. 1966, 14, No. 99.
(45) Kansy, J. Microcomputer program for analysis of positron annihilation lifetime spectra. Nucl. Instrum. Methods Phys. Res., Sect. A 1996, 374, 235−244.
(46) Wang, Y. Y.; Nakanishi, H.; Jean, Y. C.; Andreczki, T. C. Positron annihilation in amine-cured epoxy polymers-pressure dependence. J. Polym. Sci., Part B: Polym. Phys. 1990, 28, 1431−1441. (47) Tao, S. J. Positroniium annihilation in molecular substances. J. Chem. Phys. 1972, 56, No. 5499.
(48) Eldrup, M.; Lightbody, D.; Sherwood, J. N. The temperature dependence of positron lifetimes in solid pivalic acid. J. Chem. Phys. 1981, 63, 51−58.
(49) Zaleski, R.; Wawryszczuk, J.; Goworek, T. Pick-off models in the studies of mesoporous silica MCM-41. Comparison of various methods of the PAL spectra analysis. Radiat. Phys. Chem. 2007, 76, 243−247.
(50) Goworek, T.; Jasinska, B.; Wawryszczuk, J.; Zaleski, R.; Suzuki, T. On possible deviations of experimental PALS data from positronium pick-off model estimates. Chem. Phys. 2002, 280, 295− 307.
(51) Dobircau, L.; Delpouve, N.; Herbinet, R.; Domenek, S.; Le Pluart, L.; Delbreilh, L.; Ducruet, V.; Dargent, E. Molecular mobility and physical ageing of plasticized poly(lactide). Polym. Eng. Sci. 2015, 55, 858−865.
(52) Araujo, S.; Delpouve, N.; Dhotel, A.; Domenek, S.; Guinault, A.; Delbreilh, L.; Dargent, E. Reducing the gap between the activation energy measured in the liquid and the glassy states by adding a plasticizer to polylactide. ACS Omega 2018, 3, 17092−17099.
(53) Delpouve, N.; Araujo, S.; Domenek, S.; Guinault, A.; Delbreilh, L.; Dargent, E. Relaxation dynamics in plasticized PLA. AIP Conf. Proc. 2018, 1981, No. 020055.
(54) Zetsche, A.; Fischer, E. W. Dielectric studies of theα-relaxation in miscible polymer blends and its relation to concentration fluctuations. Acta Polym. 1994, 45, 168−175.
(55) Kumar, S. K.; Colby, R. H.; Anastasiadis, S. H.; Fytas, G. Concentration fluctuation induced dynamic heterogeneities in polymer blends. J. Chem. Phys. 1996, 105, No. 3777.
(56) Kamath, S.; Colby, R. H.; Kumar, S. K. Dynamic heterogeneity in miscible polymer blends with stiffness disparity: Computer simulations using the bond fluctuation model. Macromolecules 2003, 36, 8567−8573.
(57) Fytas, G.; Floudas, G.; Ngai, K. L. Density and concentration fluctuations in plasticized poly(cyclohexyl methacrylate). Macro-molecules 1990, 23, 1104−1109.
(58) Floudas, G.; Pakula, T.; Fischer, E. W. Density and concentration fluctuations in plasticized poly(cyclohexyl methacry-late) as studied by X-ray diffraction. Macromolecules 1994, 27, 917− 922.
(59) Cangialosi, D.; Alegria, A.; Colmenero, J. Dynamical heterogeneity in binary mixtures of low-molecular-weight glass formers. Phys. Rev. E 2009, 80, No. 041505.
(60) Colmenero, J.; Arbe, A. Segmental dynamics in miscible polymer blends: recent results and open questions. Soft Matter 2007, 3, 1474−1485.
(61) Baiardo, M.; Frisoni, G.; Scandola, M.; Rimelin, M.; Lips, D.; Ruffieux, K.; Wintermantel, E. Thermal and mechanical properties of plasticized Poly(L-lactic acid). J. Appl. Polym. Sci. 2003, 90, 1731− 1738.
(62) Newberry, R. W.; Raines, R. T. n→π* interactions in poly(lactic acid) suggest a role in protein folding. Chem. Commun. 2013, 49, 7699−7701.
(63) Vogel, H. The temperature dependence law of the viscosity of fluids. Phys. Z 1921, 22, No. 645.
(64) Fulcher, G. S. Analysis of recent measurements of the viscosity of glasses. J. Am. Ceram. Soc. 1925, 8, 339−355.
(65) Tammann, G.; Hesse, W. Die Abhängigkeit der Viskosität von der Temperatur bei unterkühlten Flüssigkeiten. Z Anorg. Allg. Chem. 1926, 156, No. 121.
(66) Qin, Q.; McKenna, G. B. Correlation between dynamic fragility and glass transition temperature for different classes of glass forming liquids. J. Non-Cryst. Solids 2006, 352, 2977−2985.
(67) Ngai, K. L. In Relaxation and Diffusion in Complex Systems; Springer, 2011.
(68) White, R. P.; Lipson, J. E. G. Polymer free volume and its connection to the glass transition. Macromolecules 2016, 49, 3987− 4007.
(69) White, R. P.; Lipson, J. E. G. Pressure-dependent dynamics of polymer melts from Arrhenius to non-Arrhenius: The cooperative free volume rate equation tested against simulation data. Macromolecules 2018, 51, 4896−4909.
(70) Saiter, A.; Saier, J.-M.; Golovchak, R.; Shpotyuk, M.; Shpotyuk, O. Cooperative rearranging region size and free volume in As-Se glasses. J. Phys.: Condens. Matter 2009, 21, 075105−075111.