HAL Id: hal-01346311
https://hal.archives-ouvertes.fr/hal-01346311
Submitted on 21 Jul 2016HAL is a multi-disciplinary open access
archive for the deposit and dissemination of sci-entific research documents, whether they are pub-lished or not. The documents may come from teaching and research institutions in France or abroad, or from public or private research centers.
L’archive ouverte pluridisciplinaire HAL, est destinée au dépôt et à la diffusion de documents scientifiques de niveau recherche, publiés ou non, émanant des établissements d’enseignement et de recherche français ou étrangers, des laboratoires publics ou privés.
A study on the influence of nanofluids on gas hydrate
formation kinetics and their potential: Application to
the CO2 capture process
Samer Said, Varun Govindaraj, Jean-Michel Herri, Yamina Ouabbas,
Mohamed Khodja, Mohamed Belloum, Jitendra Sangwai, Ramamurthy
Nagarajan
To cite this version:
Samer Said, Varun Govindaraj, Jean-Michel Herri, Yamina Ouabbas, Mohamed Khodja, et al.. A study on the influence of nanofluids on gas hydrate formation kinetics and their potential: Application to the CO2 capture process. Journal of Natural Gas Science and Engineering, Elsevier, 2016, 32, pp.95-108. �10.1016/j.jngse.2016.04.003�. �hal-01346311�
Research Article
A study on the influence of nanofluids on gas hydrate formation kinetics
and their potential: Application to the CO
2capture process
Said Samer1,*, Varun Govindaraj2, Jean-Michel Herri3, YaminaOuabbas3, Mohamed Khodja4, Mohamed Belloum1, Jitendra S. Sangwai5, Ramamurthy Nagarajan2
1Laboratory of Materials Chemistry and the Living (LCMVAR), University Hadj Lakhdar
Batna-1, 05 a.v. Chahid Boukhlouf, 05000 Batna, Algeria
2
Department of Chemical Engineering, Indian Institute of Technology Madras, Chennai, Tamil Nadu 600036, India
3
Gas Hydrates Dynamic Centre, ENSM Etienne, 158 cours Fauriel, 42023 Saint-Etienne, France
4
Sonatrach-Upstream Activity, Technologies and Development Division, Avenue 01 November 35000 Boumerdes, Algeria
5
Gas Hydrate and Flow Assurance Laboratory, Petroleum Engineering Program, Department of Ocean Engineering, Indian Institute of Technology Madras, Chennai, Tamil Nadu 600036,
India
Corresponding Author:
Samer said: saidpg2006@gmail.com Phone: +213 662 38 69 00
ABSTRACT
In this work, the effects of Al2O3, SiO2, Ag and Cu nanoparticles on the kinetics of
CO2-CH4 hydrate formation process were experimentally studied by measuring the amount of
gas consumed and the rate of gas consumption. A suspension of 0.1wt%, 0.2wt % and 0.3wt% of each nanoparticle was injected into the hydrate formation reactor, while pressure and temperature were maintained at 4.0 MPa and 274.15 K, and the magnetic stirrer speed was set at 350 rpm. The CO2-CH4 hydrate formation process was studied in both pure water
and water containing a 0.1wt%, 0.2wt% and 0.3wt% of each nanoparticle suspension. The results showed that these nanoparticles had a positive effect on hydrate formation. These effects varied from one nanoparticle to another. It was observed that nanoparticles of SiO2
had the most positive effect on CO2 gas consumption, particularly at a concentration of
0.3wt%. At this concentration the average amount of gas consumed was about 45% higher than that in pure water during the dissolution and 77% during crystallization. Cu and Al2O3
nanoparticles had an intermediate effect with improvement in gas consumption by 1% to 15% during dissolution; while it had an important impact on gas consumption during hydrate crystallization with an improvement of 30% to 65%. Ag nanoparticles had no significant effect during these two phases.
Keywords: Gas Hydrates; Nanoparticles; Kinetics; CO2.
1. INTRODUCTION
The main techniques used to capture the CO2 at the source are based on absorption
processes (chemical or physical), adsorption and membrane methods. These techniques are efficient, but often have high energy costs (nearly USD $20 per ton of CO2) (Deppe et al.,
currently under investigation which are based on the use of low temperature distillation, ionic liquids, and, more recently, gas hydrate crystallization (Mondal et al., 2012).
CO2 capture process by hydrate formation is proving to be one of the promising
options for long term carbon storage. This technology is desirable as CO2 hydrate deposited
in the deep ocean where the suitable pressure and temperature is ready without any extra cost. The principle of this process is based on hydrate selectivity towards CO2; the trapping of CO2
molecules is preferred to the trapping of other molecules present in the charge. There are certain barriers that should be overcome before this technique could have the industrial applications. The sluggish process of hydrate formation is one of significant problems in the industrial application; therefore, investigating the kinetics of hydrate formation and searching for effective promoters is very important. Several studies have been carried out on the effects of some surfactants on gas hydrate induction time, growth rate, and storage capacity (Ganji et al., 2007a,b; Zhang et al., 2007; Karimi et al., 2013). The addition of nanoparticles to the aqueous phase is a novel approach for the enhancement of the gas hydrate formation kinetics by increasing heat and mass transfer. There are several methods for creating nanoparticles, including attrition, pyrolysis and hydrothermal synthesis (Sobhani et al., 2014; Ansari et al., 2014; Sobhani et al., 2015). The suspensions of these nanoparticles in base fluids showed enhancement ability in heat and mass transfer so that gas dissolution and heat releasing efficiency increased in comparison with their base fluids (Kim et al., 2007; Özerinç et al., 2010; Torres et al., 2012; Jung et al., 2012; Lee and Kang, 2013).
In 2006, Li et al. (2006) studied the formation and dissociation of HFC134a (CH2FCF3) gas hydrates in the presence of copper nanoparticles. This study was inspired from the positive effect of nanoparticles on transfer phenomena (mass and heat) in fluids. It was conducted over a number of different mass fractions of nanoparticles. The results indicated that the addition of these particles increased both mass and heat transfer during the
process of formation and dissociation of HFC134a hydrates. Park et al. (2010) studied the effect of water based solutions of MWCNTs (Multi-Walled Carbon Nano-tubes) on the formation rate of methane hydrates and on the amount of gas consumed during the formation process. They used pure water as the base fluid, and added to it a dispersion of MWCNTs of 10 to 15 nm in diameter and 10-20 microns in length for different mass fractions (0.001, 0.002, 0.003, 0.004, 0.005 and 0.006 wt%). The results showed an increase in gas consumption and in the rate of formation of methane hydrates (e.g, a nanofluid of 0.004 wt% led to an increase of nearly 300% in the amount of gas consumed during the hydrate formation process, relative to pure water).
Another study by Kim et al. (2011) compared the effect two kinds of MWCNTs (CM-95 and CM-100) had on the methane hydrate formation rate (the length of CM-(CM-95 is much smaller than that of CM-100). Pure water was used as the base fluid and different concentrations (0.001, 0.002, 0.003, 0.004, 0.005 and 0.006 wt%) of CM-95 and CM-100 were dispersed in it to form a solution. They found that the maximum gas consumption was observed at a concentration of 0.004 wt% of CM-95 and CM-100. For CM-95, the experiments showed that gas consumption for a weight fraction of 0.004 % exceeded that of pure water by nearly 300%. Also, at the same temperature, the methane hydrate formation pressure was lower for CM-95 in water at 0.004 wt% when compared to CM-100 in water at the same mass fraction. This indicates an unexpected thermodynamic effect. The results also showed that the methane hydrate formation time was significantly reduced when using CM-95 and CM-100 nanofluids at 0.004wt%, more prominently so for the CM-CM-95 nanofluid. They concluded that MWCNTs with short lengths were more effective in reducing the hydrate formation time. A second study that was carried out by Park et al. (2012) was on the characteristics of methane hydrates in two types of carbon nanofluids, namely MWCNT/water nanofluids and OMWCNT/water nanofluids (oxidized MWCNT). They
chemically oxidized the surface of the MWCNT and then dispersed it in distilled water. They found that the amount of gas consumed during the formation of methane hydrates in nanofluids of OMWCNT/water were 4.5 times higher than that in nanofluids of MWCNT/water.
In 2013, Ganji et al. (2013) investigated the effect of polymers and polymer nanoparticles suspensions on stability and storage capacity of methane gas hydrate. They found that some tested additives can increase the stability of the formed hydrate effectively. The hydrate formed in the presence of these additives had higher gas content compared to the pure water hydrate. Another study by Mohammadi et al. (2014) focused on the kinetic formation of CO2 hydrates in the presence of silver nanoparticles and a surfactant (sodium
dodecyl sulfate, SDS). These systems were tested in a stirred reactor, with an aqueous solution of SDS at concentrations of 300 and 500 ppm, nanofluids of Ag at concentrations of 0.000045 M and 0.00009 M, and in a mixture of SDS (500 ppm) and nanoparticles of Ag (0.000045 M). The obtained results showed that individually, the SDS and Ag nanoparticles did not have a significant effect on the induction time and hydrate storage capacity, however, the mixture of SDS and Ag nanoparticles led to an increase in the CO2 storage
capacity.
The effects of the graphite nanoparticles on the CO2 hydrate formation process was
studied by Zhou et al (2014). The results showed that the nanographite particles had a positive effect on the CO2 hydrate formation. In comparison to pure water, the induction time
of CO2 hydrate formed in the presence of the graphite nanoparticles decreased by 80.8%,
while the maximum CO2 consumption increased by 12.8%. In addition, the hydrate reaction
was 98.8% complete within 400 min in the presence of nanographite particles. Mohammadi et al. (2016) studied the effect of synthesized zinc oxide (ZnO) nanoparticles on the kinetic and thermodynamic equilibrium conditions of CO2 hydrate formation. The amount of the gas
consumption was measured and compared for the four sample fluids: pure water, aqueous solution of sodium dodecyl sulfate (SDS), water-based ZnO nanofluid and water-based ZnO nanofluid in the presence of SDS (0.001 mass fraction). The results showed that the time of hydrate growth decreased and the amount of the storage gas enhanced in the presence of nanoparticles. The literature survey indicated that the nanofluids can be effectively used for improving the performance of several hydrate formation processes. The studies involving some of industrially important nanoparticle systems, such as Al2O3, SiO2, Ag and Cu
nanoparticles, on the performance of CO2-CH4 hydrate formation are not yet been reported in
the open literature.
In this study, the effects of Al2O3, SiO2, Ag and Cu nanoparticles on the kinetics of
CO2–CH4 hydrate formation process were experimentally studied by measuring the amount
of gas consumed and the rate of gas consumption. The use of single apparatus, with exactly the same experimental conditions, allowed us to compare the effectiveness of these different nanoparticles.
2. EXPERIMENTAL PROCEDURE 2.1.Compounds used
The gases used (CO2 and CH4) were provided by the Air-Liquide Company. The CO2
-CH4 mixture was prepared to be representative of a gas stream rich in CO2 (75 mol% CH4
and 25 mol% CO2). The water used was distilled through a water purifier (Milli-Q plus185
model), and the total organic carbon rate was estimated to be less than 50%. A suspension of 0.1wt%, 0.2wt % and 0.3wt% of different nanoparticles (Al2O3, SiO2, Cu and Ag) was
prepared and tested. Table 1 shows some physio-chemical properties of the used nanoparticles.
Table 1: Physio-chemical properties of nanoparticles used Nanoparticles Diameter
(nm)
Purity (%) Density (g/cm3) Specific Surface area (m2/g)
Al2O3 SiO2 Cu Ag <50 10-20 40-60 <150 >99.0 >99.5 >99.9 >99.0 4.00 2.2-2.60 8.94 10.49 >40 (BET) 140-180 ~12 > 5.4 2.2.Compounds used
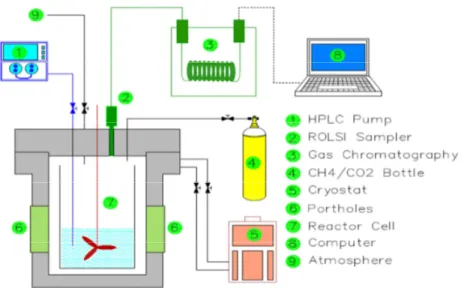
The main experiment apparatus (Figure 1) is the reactor in which the hydrates are formed and dissociated. The tank is enclosed in an autoclave equipped with sapphire glass portholes. The portholes enable visual observation of the reactor inside. The autoclave is cooled or heated using a cryostat (RLM LAUDA 6S). The refrigerant mixture (water + ethanol) circulates through a double wall to ensure heat exchange within the autoclave. The liquid introduced into the reactor can be stirred with a stirrer, at a speed of up to 800 RPM. A high pressure pump (PU-1587 of JASCO Corporation) allows the injection of the liquid into the pressurized reactor. A vacuum pump (ALCATEL brand) allows us to purge the reactor of any remnants from previous experiments. A cylindrical bottle is connected to the main reactor by a system of tubes and valves, and acts as the supply unit of the pressurized gas mixture. A sampling system called ROLSI (Rapid On-Line Sampler Injector), developed by Mines Paris Tech, was fixed on the top of the autoclave. The gas phase within the reactor could be analyzed by an in-line gas chromatograph (Varian 450 GC model) which was equipped with a TCD detector.
Figure 1: Schematic of the experimental setup at ENSM Saint-Etienne 2.3.Procedure
2.3.1. Nanofluid preparation
A suspension of 0.1 wt%, 0.2 wt% and 0.3wt% of different nanoparticles (Al2O3,
SiO2, Cu and Ag) was prepared. To prepare these nanofluids, the required amounts of
nanoparticles were dispersed in 5 ml of demineralized water and stirred for 2 hours (to ensure that there was no caking). The resultant solution was then further diluted with distilled water to reach a volume of 400 ml. This dilution procedure is well explained in the experimental procedure section.
2.3.2. Formation of CO2-CH4 mixed hydrates 2.3.2.1 Experimental procedure with pure water
At the beginning of each test, the reactor was evacuated using the vacuum pump in order to eliminate all traces of the previous experiment, and then pressurized to 4 MPa to initiate a new experiment. The gas phase was stirred and cooled to a temperature of 1°C
. Once this temperature was reached, the stirring was stopped. At this time, an analysis of the gas phase by the in-line GC was carried out to check the initial composition. At time t=ta, 400 ml of pure water was injected into the reactor using a HPLC pump (the selected
volume can be changed in accordance with the ability to see the gas-liquid interface through the reactor portholes). The stirring was started again, and set at 350 RPM (which corresponds to the speed limit to avoid vortex and bubbles formation). From this moment onwards, the gas phase composition was analyzed every two hours by the GC. As soon as the water was injected, the temperature and pressure increased simultaneously. The reactor was cooled again and brought down to the temperature of the experiment (1°C), which was kept constant until equilibrium was reached. The evolution of the key parameters (pressure, temperature) of this experiment is shown in Figure 2a.
2.3.2.2 Experimental procedure with nanofluids
Nanofluids of different nanoparticles concentrations of (0.1, 0.2 and 0.3 wt%) were previously prepared by the dispersion of precise amounts (0.4 to 1.2g) of them in 5 ml of distilled water. Here, the procedure followed for 0.1 wt% of Al2O3 is described, and is
consistent with the procedure followed for other nanofluids as well. At time t=0, 5 ml of the first sample of Al2O3 nanofluid (0.4g/5 ml of pure water) was introduced into the reactor,
which was then pressurized with the gas mixture to a pressure of 4 MPa . The gas phase was stirred and cooled to a temperature of 1°C . At this time, stirring was stopped, and an analysis of the gas phase was performed using the GC to check the initial composition of the mixture within the reactor. At time t=ta, 395 ml of pure water was injected into the reactor using the HPLC pump. The stirring was started again at a speed of 350 RPM. A different procedure is followed here, when compared to the case of pure water in order to avoid difficulties in cleaning nanoparticles from the HPLC pump. From this point on, the procedure was identical to that of the previous case with pure water. Figure 2b shows the evolution of key parameters being measured (P, T) during this experiment (nanofluid of 0.3 %wt SiO2/water).
Figure 2a: Evolution of pressure and temperature for the gas hydrate formation in pure
water.
Figure 2b: Evolution of Pressure and Temperature for the gas hydrate formation with
nanofluid (0.3%wt SiO2) 0 2 4 6 8 10 12 14 16 18 20 2.0 2.2 2.4 2.6 2.8 3.0 3.2 3.4 3.6 3.8 4.0 4.2 4.4 4.6 0 20 40 60 80 100 120 140 160 180 T em p er at u re ( °C ) P re ss u re ( M P a) Time (hr) Pressure Liq Temp Gas Temp 0 2 4 6 8 10 12 14 16 18 20 2 2.2 2.4 2.6 2.8 3 3.2 3.4 3.6 3.8 4 4.2 4.4 4.6 0 20 40 60 80 100 120 T em p ér at u re ( °C ) P re ss u re ( M P a) Time (hr) Pressure Liq Temp Gas Temp
As is shown in Figures 2a and 2b, there is simultaneous increase in the pressure and temperature during the first stage of the experiment, which corresponds to the injection of water into the reactor, then, there is an initial sharp decrease in the pressure, which corresponds to the dissolution of gas in the aqueous phase until it is supersaturated with respect to the equilibrium conditions. After that, the pressure in the reactor decreases due to the hydrate growth. As can be seen in these two figures, a slight increase in the temperature of the system is observed exactly at the beginning of the hydrate growth stage. This increase in temperature is owing to the exothermic nature of the hydrate formation. The pressure is rapidly decreases in the presence of nanoparticles compared to the case of water and the equilibrium pressure is achieved after 80 hours with nanoparticles; however, in water this pressure is achieved after 170 hours.
3. RESULTS AND DISCUSSION 3.1.Dissolution
To understand the kinetics of dissolution, the amount of gas consumed between the times (the time at which the gas is injected) and (the time at which the crystallization begins) may be tracked. The rate constant of the dissolution of gas in water K a, now becomes an important factor in the study of this process. Using the following consumption rate equation (1), the value of K a is calculated:
= − (1) Where:
: Rate of gas consumption and dissolution (mol.s-1) : Liquid-side mass transfer coefficient (m.s-1)
: Specific interfacial area based on the liquid volume (m−1) : Gas concentration at the gas-liquid interface (mol/m3)
: Gas concentration in the liquid (mol/m3)
Experimentally, the total amount of gas consumed A ) during dissolution at the time can be calculated from the pressure, , and the reactor temperature, , obtained from the data acquisition device connected to the reactor. This amount of gas consumed can by expressed by the following equation:
= !" −! " # (2) , $% and are the pressure, volume, and temperature of the gas, respectively.& is the gas universal constant and ' is the compressibility factor.
In this expression, the index ( refers to the initial time at the beginning of the experiment, just before the liquid is injected into the reactor. At this point in time, the amount of gas consumed is assumed to be zero. The compressibility factors, ') and ' , can be determined from the Peng-Robinson equation (Mohammadi et al., 2014; Najibi et al., 2015).
At any time :
*− = − $% (3)
Where:
*: The cumulative consumption of the gas mixture at saturation
: The cumulative consumption of the gas mixture at time : The gas concentration at the gas-liquid interface : The gas concentration in the liquid at time
The rate of consumption is written as:
+,
-+ = − $% = *− (4)
By integrating this equation between the time , the start time of stirring, and any point of time t the following relationship may be obtained:
ln ,1
,12,-= − (5)
At time t , the gas consumption may be assumed to be zero.
3.1.1. Evolution of pressure during dissolution of the gas mixture
Figures 3a through 3d represent the evolution of the pressure ratio P/Ps (Ps
corresponds to the pressure immediately after the injection of water) as a function of time during the dissolution phase of the gas mixture in pure water and in nanofluids of Al2O3,
SiO2, Cu and Ag, respectively.
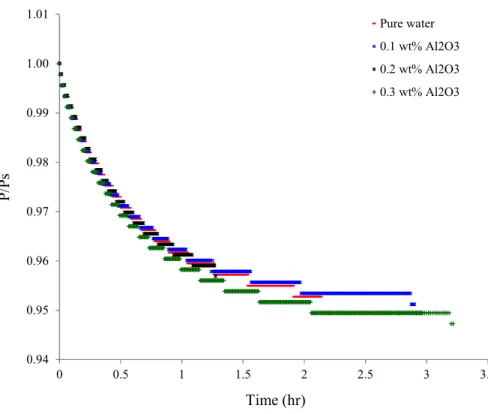
Figure 3a: Pressure evolution during dissolution (Al2O3 nanofluid)
0.94 0.95 0.96 0.97 0.98 0.99 1.00 1.01 0 0.5 1 1.5 2 2.5 3 3.5 P /P s Time (hr) Pure water 0.1 wt% Al2O3 0.2 wt% Al2O3 0.3 wt% Al2O3
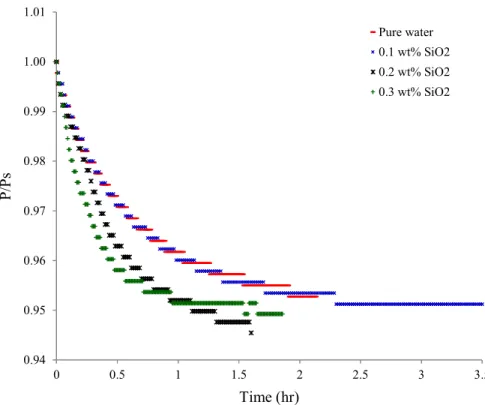
Figure 3b: Pressure evolution during dissolution (SiO2 nanofluid)
Figure 3c: Pressure evolution during dissolution (Cu nanofluid) 0.94 0.95 0.96 0.97 0.98 0.99 1.00 1.01 0 0.5 1 1.5 2 2.5 3 3.5 P /P s Time (hr) Pure water 0.1 wt% SiO2 0.2 wt% SiO2 0.3 wt% SiO2 0.94 0.95 0.96 0.97 0.98 0.99 1.00 1.01 0 0.5 1 1.5 2 2.5 3 3.5 P /P s Time (hr) Pure water 0.1 wt% Cu 0.2 wt% Cu 0.3 wt% Cu
Figure 3d: Pressure evolution during dissolution (Ag nanofluid)
The P/Ps ratio is observed to rapidly decrease in the presence of SiO2 nanoparticles as
compared to pure water, particularly for the concentration of 0.2wt% and 0.3 wt%. Different decreases of this ratio are noted in presence of Cu and Al2O3 nanoparticles, however, no
change is observed with Ag nanoparticles.
3.1.2. Gas consumption during dissolution
Figures 4a trough 4d show the consumption of gas versus time during the dissolution
of the gas mixture in pure water and in nanofluids Al2O3, SiO2, Cu and Ag, respectively.
Figure 4e shows the gas consumption improvement during the dissolution compared to the
case of pure water.
0.94 0.95 0.96 0.97 0.98 0.99 1.00 1.01 0 0.5 1 1.5 2 2.5 3 3.5 P /P s Time (hr) Pure water 0.1 wt% Ag 0.2 wt% Ag
Figure 4a: Gas consumption during dissolution (Al2O3 nanofluid)
Figure 4b: Gas consumption during dissolution (SiO2 nanofluid)
0 10 20 30 40 50 60 70 80 90 100 0 0.5 1 1.5 2 2.5 3 3.5 G as c o n su m p ti o n ( m o l/ m 3 ) Time (hr) Pure water 0.1 wt% Al2O3 0.2 wt% Al2O3 0.3 wt% Al2O3 0 10 20 30 40 50 60 70 80 90 100 0 0.5 1 1.5 2 2.5 3 3.5 G as c o n su m p ti o n ( m o l/ m 3 ) Time (hr) Pure water 0.1 wt% SiO2 0.2 wt% SiO2 0.3 wt% SiO2
Figure 4c: Gas consumption during dissolution (Cu nanofluid)
Figure 4d: Gas consumption during dissolution (Ag nanofluid) 0 10 20 30 40 50 60 70 80 90 100 0 0.5 1 1.5 2 2.5 3 3.5 G as c o n su m p ti o n ( m o l/ m 3 ) Time (hr) Pure water 0.1 wt% Cu 0.2 wt% Cu 0.3 wt% Cu 0 10 20 30 40 50 60 70 80 90 100 0 0.5 1 1.5 2 2.5 3 3.5 G as c o n su m p ti o n ( m o l/ m 3 ) Time (hr) Pure water 0.1 wt% Ag 0.2 wt% Ag
Figure 4e: Gas consumption improvement compared to the case of pure water during
dissolution.
To explain the obtained results during this stage, it is interesting to note that:
First, regarding the tested nanoparticles type, the SiO2 particles had the highest
specific surface, while Ag particles had the lowest surface area (Table 1), the decreasing in the pressure during the dissolution is due to the dissolution of gas in the aqueous phase (mass transfer) until it is supersaturated and this dissolution depends on the gas-liquid interface area, it can be assumed that may be the presence of nanoparticles with high specific area (eg. SiO2) in the hydrate formation system increases the interfacial area, which enhances the mass
transfer (gas consumption).
Second, regarding the concentration of nanoparticles used, it can be hypothesized that there may be bounds within which nanoparticle concentration must fall for these solutions to be effective during the gas dissolution stage. These bounds would be of two kinds: a lower
0 10 20 30 40 50 60 70 80 90 100 110 0 0.5 1 1.5 2 2.5 G as c o n su m p ti o n i m p ro v em en t (% ) Time (hr) 0.1 wt% Al2O3 0.2 wt% Al2O3 0.3 wt% Al2O3 0.1 wt% SiO2 0.2 wt% SiO2 0.3 wt% SiO2 0.1 wt% Cu 0.2 wt% Cu 0.3 wt% Cu 0.1 wt% Ag 0.2 wt% Ag
bound, below which the presence of these particles has a negligible impact on increasing of gas-liquid interfacial area; and an upper bound, above which other factors (such as agglomeration and layer “barrier” formation at gas-liquid interface) may interfere with any benefits these nanoparticles may provide. These bounding concentrations vary from one nanoparticle to the next, but, as can be seen from those that were tested, a high specific surface area seems to lead to strong positive promotion at certain concentration levels. This lower bound is demonstrated by nanoparticles of silica, where very low effect is seen at concentration of 0.1 wt%, while the upper bound can be observed in the case of Cu, where, at concentration 0.2 wt% the kinetics revert to those of pure water.
3.1.3. Calculation of the dissolution rate constant 345 for different nanofluids Figures 5a through 5d show the evolution of the dissolution rate constant of the gas
mixture, K a, in pure water and in nanofluids of Al2O3, SiO2, Cu and Ag, respectively.
Figures 6a through 6d look at the initial linear part of this curve for the same nanofluids.
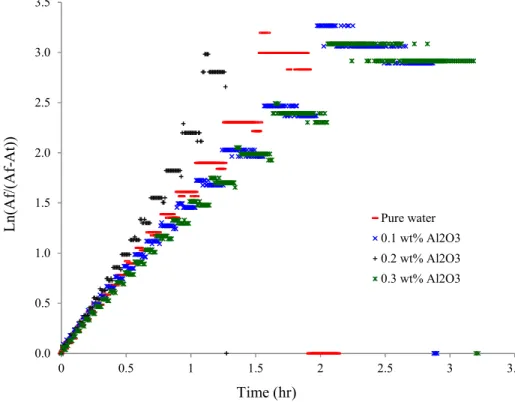
Figure 5a: Calculation of Dissolution rate constant (Al2O3 nanofluid)
0.0 0.5 1.0 1.5 2.0 2.5 3.0 3.5 0 0.5 1 1.5 2 2.5 3 3.5 L n (A f/ (A f-A t) ) Time (hr) Pure water 0.1 wt% Al2O3 0.2 wt% Al2O3 0.3 wt% Al2O3
Figure 6a: Calculation of Dissolution rate constant-Linear part of curve (Al2O3 nanofluid)
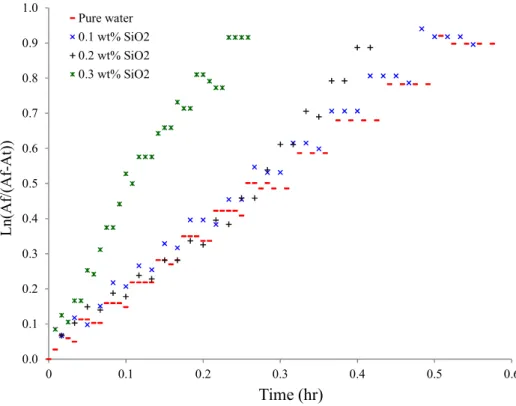
Figure 5b: Calculation of Dissolution rate constant (SiO2 nanofluid)
0.0 0.1 0.2 0.3 0.4 0.5 0.6 0.7 0.8 0.9 1.0 0 0.1 0.2 0.3 0.4 0.5 0.6 L n (A f/ (A f-A t) ) Time (hr) Pure water 0.1 wt% Al2O3 0.2 wt% Al2O3 0.3 wt% Al2O3 0.0 0.5 1.0 1.5 2.0 2.5 3.0 3.5 0 0.5 1 1.5 2 2.5 3 3.5 L n (A f/ (A f-A t) ) Time (hr) Pure water 0.1 wt% SiO2 0.2 wt% SiO2 0.3 wt% SiO2
Figure 6b: Calculation of Dissolution rate constant-Linear part of curve (SiO2 nanofluid)
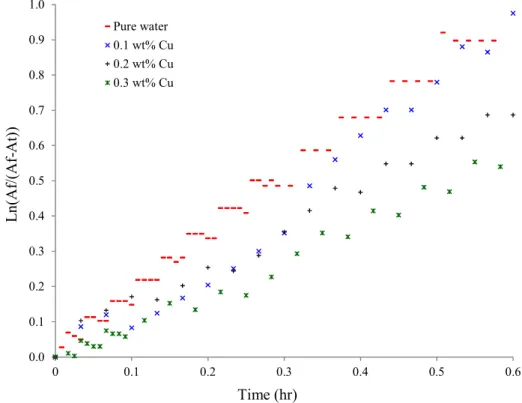
Figure 5c: Calculation of Dissolution rate constant (Cu nanofluid) 0.0 0.1 0.2 0.3 0.4 0.5 0.6 0.7 0.8 0.9 1.0 0 0.1 0.2 0.3 0.4 0.5 0.6 L n (A f/ (A f-A t) ) Time (hr) Pure water 0.1 wt% SiO2 0.2 wt% SiO2 0.3 wt% SiO2 0.0 0.5 1.0 1.5 2.0 2.5 3.0 3.5 0 0.5 1 1.5 2 2.5 3 3.5 L n (A f/ (A f-A t) ) Time (hr) Pure water 0.1 wt% Cu 0.2 wt% Cu 0.3 wt% Cu
Figure 6c: Calculation of Dissolution rate constant-Linear part of curve (Cu nanofluid)
Figure 5d: Calculation of Dissolution rate constant (Ag nanofluid) 0.0 0.1 0.2 0.3 0.4 0.5 0.6 0.7 0.8 0.9 1.0 0 0.1 0.2 0.3 0.4 0.5 0.6 L n (A f/ (A f-A t) ) Time (hr) Pure water 0.1 wt% Cu 0.2 wt% Cu 0.3 wt% Cu 0.0 0.5 1.0 1.5 2.0 2.5 3.0 3.5 0 0.5 1 1.5 2 2.5 3 3.5 L n (A f/ (A f-A t) ) Time (hr) Pure water 0.1 wt% Ag 0.2 wt% Ag
Figure 6d: Calculation of Dissolution rate constant-Linear part of curve (Ag nanofluid)
Initially, these trends are perfectly linear, but gradually deviate from linearity as saturation approaches. The alignment of the experimental points indicates that dissolution kinetics is not disturbed by the use of nanofluids. The kinetic model remains valid, and the determination of constants of the gas dissolution rate ( K a) can be done by evaluating the slope of the linear part of the curve.
The values of K a reported in Table 2 are for the gas mixture in the presence of different nanofluids with a stirring rate of 350 RPM.
The transfer constant is observed to increase slightly for nanofluids of Al2O3 and
SiO2, particularly for SiO2 at 0.3%. However, K a seems to decrease in the case of Cu and
Ag nanofluids. From the literature (Olle et al.2006), an enhancement in K a may be attributed to either an increase in mass transfer coefficient K or an increase in an interfacial area a or both. In this work, it seems like the presence of nanoparticles with high specific surface area is improving the interface area (a and consequently improve the K a.
0.0 0.1 0.2 0.3 0.4 0.5 0.6 0.7 0.8 0.9 1.0 0 0.1 0.2 0.3 0.4 0.5 0.6 L n (A f/ (A f-A t) ) Time (hr) Pure water 0.1 wt% Ag 0.2 wt% Ag
Table 2: Values of transfer constant K a for different nanofluids 345 [s-1] (10-4) Pure Water 5.20 Nanofluid Al2O3/H2O 0.1wt% 5.60 0.2wt% 5.90 0.3wt% 4.80 SiO2/H2O 0.1wt% 5.60 0.2wt% 5.80 0.3wt% 12.00 Cu/H2O 0.1wt% 4.00 0.2wt% 3.90 0.3wt% 2.00 Ag/H2O 0.1wt% 4.00 0.2wt% 4.90 3.2.Crystallization
Crystallization rates are obtained by evaluating the amount of gas consumed as a function of time during the hydrate formation process. Here, the initial time corresponds to the onset of the exothermic peak or the visual detection of the first hydrate crystals. The evolution of pressure in the reactor, combined with the gas composition (obtained via chromatograph measurements), allows the determination the crystallization rates of each gas.
3.2.1. Evolution of Pressure during hydrate crystallization
Figures 7a through 7d show the evolution of the pressure ratio P/Pc (where Pc is the
pressure at the onset of hydrate crystallization) as a function of time during hydrate crystallization in pure water and in nanofluids of Al2O3, SiO2, Cu and Ag, respectively.
Figure 7a: Evolution of Pressure with time during hydrate crystallization (Al2O3 nanofluid)
Figure 7b: Evolution of Pressure with time during hydrate crystallization (SiO2 nanofluid)
0.55 0.60 0.65 0.70 0.75 0.80 0.85 0.90 0.95 1.00 1.05 0 20 40 60 80 100 120 140 160 180 P /P c Time (hr) Pure water 0.1 wt% Al2O3 0.2 wt% Al2O3 0.3 wt% Al2O3 0.55 0.60 0.65 0.70 0.75 0.80 0.85 0.90 0.95 1.00 1.05 0 20 40 60 80 100 120 140 160 180 P /P c Time (hr) Pure water 0.1 wt% SiO2 0.2 wt% SiO2 0.3 wt% SiO2
Figure 7c: Evolution of Pressure with time during hydrate crystallization (Cu nanofluid)
Figure 7d: Evolution of Pressure with time during hydrate crystallization (Ag nanofluid) 0.55 0.6 0.65 0.7 0.75 0.8 0.85 0.9 0.95 1 1.05 0 20 40 60 80 100 120 140 160 180 P /P c Time (hr) Pure water 0.1 wt% Cu 0.2 wt% Cu 0.3 wt% Cu 0.55 0.60 0.65 0.70 0.75 0.80 0.85 0.90 0.95 1.00 1.05 0 20 40 60 80 100 120 140 160 180 P /P c Time (hr) Pure water 0.1 wt% Ag 0.2 wt% Ag
These results show that in the presence of Al2O3 nanoparticles, the P/Pc ratio
decreases rapidly for concentrations of 0.1 wt% and 0.2 wt%, but not for the concentration of 0.3 wt%. In the case of SiO2 nanofluids, a very rapid decline in the P/Pc ratio is observed for
the concentration of 0.3 wt%, while no significant effects were observed for the other two concentrations. The solutions of Cu nanoparticles in pure water with 0.1 wt%, 0.2 wt% and 0.3 wt% show a considerable influence on the P/Pc ratio at the beginning of the experiment,
but it converges to the effectiveness of pure water by the time the experiments end. At the beginning of crystallization, the presence of Ag nanoparticles seems to have a positive effect on the pressure ratio, but this gradually reverses by the end of crystallization.
3.2.2. Moles of gas consumed during hydrate crystallization
Figures 8a trough 8d show the moles of gas consumed per unit volume as a function
of time during hydrate crystallization with various nanofluids. Figure 8e shows the gas consumption improvement during the crystallization compared to the case of pure water.
Figure 8a: Gas consumption during crystallization (Al2O3 nanofluid)
0.0 0.2 0.4 0.6 0.8 1.0 1.2 1.4 1.6 1.8 2.0 2.2 2.4 0 20 40 60 80 100 120 140 160 180 M o le s o f g as c o n su m ed ( m o l/ m 3 ) Time (hr) Pure water 0.1 wt% Al2O3 0.2 wt% Al2O3 0.3 wt% Al2O3
Figure 8b: Gas consumption during crystallization (SiO2 nanofluid)
Figure 8c: Gas consumption during crystallization (Cu nanofluid) 0.0 0.2 0.4 0.6 0.8 1.0 1.2 1.4 1.6 1.8 2.0 2.2 2.4 0 20 40 60 80 100 120 140 160 180 M o le s o f g as c o n su m ed ( m o l/ m 3 ) Time (hr) Pure water 0.1 wt% SiO2 0.2 wt% SiO2 0.3 wt% SiO2 0.0 0.2 0.4 0.6 0.8 1.0 1.2 1.4 1.6 1.8 2.0 2.2 2.4 0 20 40 60 80 100 120 140 160 180 M o le s o f g as c o n su m ed ( m o l/ m 3 ) Time (hr) Pure water 0.1 wt% Cu 0.2 wt% Cu 0.3 wt% Cu
Figure 8d: Gas consumption during crystallization (Ag nanofluid)
Figure 8e: Gas consumption improvement compared to the case of pure water during
crystallization. 0.0 0.2 0.4 0.6 0.8 1.0 1.2 1.4 1.6 1.8 2.0 2.2 2.4 0 20 40 60 80 100 120 140 160 180 M o le s o f g as c o n su m ed ( m o l/ m 3 ) Time (hr) Pure water 0.1 wt% Ag 0.2 wt% Ag 0 10 20 30 40 50 60 70 80 90 100 110 120 130 140 150 160 170 180 0 20 40 60 80 100 120 140 160 180 G as c o n su m p ti o n i m p ro v em en t (% ) Time (hr)
0.1 wt% Al2O3 0.2 wt% Al2O3 0.3 wt% Al2O3 0.1 wt% SiO2 0.2 wt% SiO2 0.3 wt% SiO2 0.1 wt% Cu 0.2 wt% Cu 0.3 wt% Cu 0.1 wt% Ag 0.2 wt% Ag
The presence of SiO2 nanoparticles in pure water at concentrations of 0.3 wt% causes
a considerable increase in the amount of gas consumed during hydrate crystallization (average gas consumption improvement of 77%); while small change is visible at the other two concentrations. In the case of Al2O3 nanoparticles, there is an important increase in the
amount of gas consumed during crystallization at concentrations of 0.2 wt% and 0.3 wt% (average gas consumption improvement of 30% to 65%); however, this does not seem to be the case at a concentration of 0.1 wt%. Cu nanoparticles at 0.1 wt%, 0.2 wt% and 0.3 wt% show a considerable influence on the amount of gas consumed at the beginning of the experiment, but it converges to the effectiveness by the end of this phase. A positive influence is shown by Ag nanoparticles at the beginning of the crystallization process; however, this reverses to a negative one at the later stages of the experiment, in line with our observations on pressure.
These obtained results can be explained as follow:
First, regarding the type of tested nanoparticles, the hydrates formation process is an exothermic nature, which means a considerable amount of heat is released when hydrate crystals are growing in the system, also for the hydrate former gas with low solubility in water, such CO2, the mass transport of the hydrate former to the hydrate surface may
dominate the growth process. Based on the demonstrated positive effect of nanoparticles with high specific surface area on mass and heat transfer phenomena in fluids, it can be assumed that the addition of nanoparticles with high specific surface area (eg. SiO2) increased strongly
the mass and heat transfer between the gases, liquid, and hydrate phases, which increased the amount of consumed gas and the released heat and consequently the improvement of crystallization.
Second, regarding the concentration of nanoparticles used, it can be assumed that there may be bounds within which nanoparticle concentration must fall for these solutions to
be effective during the crystallization. These bounds would be of two kinds: a lower bound, below which the presence of these particles has a negligible impact on increasing of heat transfer; and an upper bound, above which other factors (such as agglomeration) may interfere with any benefits these nanoparticles may provide. These bounding concentrations vary from one nanoparticle to the next, but, as can be seen from those that were tested, a high specific surface area seems to lead to strong positive promotion at certain concentration levels. This lower bound is demonstrated by nanoparticles of silica, where very low effect is seen at concentration of 0.1 wt%, while the upper bound can be observed in the case of Cu, where, at concentration 0.2 wt% the kinetics revert to those of pure water.
3.2.3. Variation of the gas consumption rate during hydrate crystallization in pure water and in different nanofluids
The evolution of the gas consumption rate as a function of time during the hydrate crystallization process in nanofluids of Al2O3, SiO2, Cu and Ag are shown in Figures 9a
through 9d, respectively.
Figure 9a: Gas consumption rate during crystallization (Al2O3 nanofluid)
0 0.01 0.02 0.03 0.04 0.05 0.06 0.07 0.08 0.09 0 20 40 60 80 100 120 140 160 180 C o n su m p ti o n r at e (m o l/ h ) Time (hr) Pure water 0.1 wt% Al2O3 0.2 wt% Al2O3 0.3 wt% Al2O3
Figure 9b: Gas consumption rate during crystallization (SiO2 nanofluid)
Figure 9c: Gas consumption rate during crystallization (Cu nanofluid) 0 0.02 0.04 0.06 0.08 0.1 0.12 0.14 0 20 40 60 80 100 120 140 160 180 C o n su m p ti o n r at e (m o l/ h ) Time (hr) Pure water 0.1 wt% SiO2 0.2 wt% SiO2 0.3 wt% SiO2 0.00 0.05 0.10 0.15 0.20 0.25 0.30 0.35 0 20 40 60 80 100 120 140 160 180 C o n su m p ti o n r at e (m o l/ h ) Time (hr) Pure water 0.1 wt% Cu 0.2 wt% Cu 0.3 wt% Cu
Figure 9d: Gas consumption rate during crystallization (Ag nanofluid)
The presence of Al2O3 nanoparticles at concentrations of 0.1 wt% and 0.2 wt%
considerably increases the gas consumption rate during crystallization, while no significant change of this rate appears at a concentration of 0.3 wt%. The addition of SiO2 nanoparticles
also causes a significant increase in the gas consumption rate during crystallization at a concentration of 0.1 wt%, but little or no effect is observed for the other two concentrations. In the case of Cu nanoparticles with concentrations of 0.1 wt%, 0.2 wt% and 0.3 wt%, there is a significant positive influence on the gas consumption rate during the crystallization at the beginning of the experiment, but this eventually converges with results for pure water. Similarly, at the beginning of the crystallization step, the presence of Ag nanoparticles has a positive effect on the gas consumption rate, but this effect also seems to reach a limiting behavior at the end of the process.
3.2.4. Evolution of the mole fraction of CO2 and CH4 during hydrate crystallization Figures 10a through 10d show the evolution of the mole fraction of CO2 in the gas
phase as a function of time during the hydrate crystallization process in nanofluids of Al2O3,
0.00 0.05 0.10 0.15 0.20 0.25 0.30 0 20 40 60 80 100 120 140 160 180 C o n su m p ti o n r at e (m o l/ h ) Time (hr) Pure water 0.1 wt% Ag 0.2 wt% Ag
SiO2, Cu and Ag, respectively. Figures 11a through 11d show the evolution of the mole
fraction of CH4 in the gas phase as a function of time during the hydrate crystallization
process for the same nanofluids.
Figure 10a: Evolution of mole fraction of CO2 in the gas phase during crystallization (Al2O3
nanofluid)
Figure 11a: Evolution of mole fraction of CH4 in the gas phase during crystallization (Al2O3
nanofluid) 0.17 0.19 0.21 0.23 0.25 0.27 0.29 0 20 40 60 80 100 120 140 160 180 M o le f ra ct io n o f C O 2 i n g as p h as e Time (hr)
CO2 / Pure water CO2 / 0.1 wt% Al2O3 CO2 / 0.2 wt% Al2O3 CO2 /0.3 wt% Al2O3 0.70 0.72 0.74 0.76 0.78 0.80 0.82 0 20 40 60 80 100 120 140 160 180 M o le f ra ct io n o f C H 4 i n g as p h as e Time (hr) CH4 / Pure water CH4 / 0.1 wt% Al2O3 CH4 / 0.2 wt% Al2O3 CH4 / 0.3 wt% Al2O3
Figure 10b: Evolution of mole fraction of CO2 in the gas phase during crystallization (SiO2
nanofluid)
Figure 11b: Evolution of mole fraction of CH4 in the gas phase during crystallization (SiO2
nanofluid) 0.17 0.19 0.21 0.23 0.25 0.27 0.29 0 20 40 60 80 100 120 140 160 180 M o le f ra ct io n o f C O 2 i n g as p h as e Time (hr)
CO2 / Pure water CO2 / 0.1 wt% SiO2 CO2 / 0.2 wt% SiO2 CO2 /0.3 wt% SiO2 0.7 0.72 0.74 0.76 0.78 0.8 0.82 0 20 40 60 80 100 120 140 160 180 M o le f ra ct io n o f C H 4 i n g as p h as e Time (hr) CH4 / Pure water CH4 / 0.1 wt% SiO2 CH4 / 0.2 wt% SiO2 CH4 / 0.3 wt% SiO2
Figure 10c: Evolution of mole fraction of CO2 in the gas phase during crystallization (Cu
nanofluid)
Figure 11c: Evolution of mole fraction of CH4 in the gas phase during crystallization (Cu
nanofluid 0.17 0.19 0.21 0.23 0.25 0.27 0.29 0 20 40 60 80 100 120 140 160 180 M o le f ra ct io n o f C O 2 i n g as p h as e Time (hr)
CO2 / Pure water CO2 / 0.1 wt% Cu CO2 / 0.2 wt% Cu CO2 / 0.3 wt% Cu 0.7 0.72 0.74 0.76 0.78 0.8 0.82 0 20 40 60 80 100 120 140 160 180 M o le f ra ct io n o f C H 4 i n g as p h as e Time (sec) CH4 / Pure water CH4 / 0.1 wt% Cu CH4 / 0.2 wt% Cu CH4 / 0.3 wt% Cu
Figure 10d: Evolution of mole fraction of CO2 in the gas phase during crystallization (Ag
nanofluid)
Figure 11d: Evolution of mole fraction of CH4 in the gas phase during crystallization (Ag
nanofluid) 0.17 0.19 0.21 0.23 0.25 0.27 0.29 0 20 40 60 80 100 120 140 160 180 M o le f ra ct io n o f C O 2 i n g as p h as e Time (hr)
CO2 / Pure water CO2 / 0.1 wt% Ag CO2 / 0.2 wt% Ag 0.7 0.72 0.74 0.76 0.78 0.8 0.82 0 20 40 60 80 100 120 140 160 180 M o le f ra ct io n o f C H 4 i n g as p h as e Time (hr) CH4 / Pure water CH4 / 0.1 wt% Ag CH4 / 0.2 wt% Ag
The addition of Al2O3 nanoparticles to pure water at a concentration of 0.3 wt%
causes a slight increase in the capture selectivity of CO2, as compared to CH4 during
crystallization, while no significant change in this selectivity appears for concentrations of 0.1wt% and 0.2wt%. Similarly, the presence of SiO2 nanoparticles, a marginal increase in the
capture selectivity of CO2 compared to CH4 during crystallization at a concentration of 0.3
wt% has been observed. However, no effect is observed for the other two concentrations. In the case of Cu nanoparticles, none of the three concentrations tested significantly impacted the selectivity of CO2 capture. Finally, the addition of Ag nanoparticles at concentrations of
0.1 wt%, 0.2 wt% and 0.3 wt% negatively impacts the CO2 capture selectivity as compared to
CH4.
4. CONCLUSION
The effect of Al2O3, SiO2, Ag and Cu nanoparticles on the kinetics of hydrate
formation of a gas mixture rich in CO2 (75 mol% CH4 and 25 mol% CO2) was studied. The
results obtained show that the presence of these nanoparticles induces mixed effects on the improvement of the kinetics of this process, the degree of which seems to differ from one additive to another, and also with the concentration in nanoparticles being used. During dissolution, it was observed that nanoparticles of SiO2 had the most positive effect on gas
consumption, particularly concentration of 0.3%wt. At this concentration the average amount of gas consumed was about 45% higher than that in pure. Cu and Al2O3 nanoparticles had an
intermediate effect with average improvement of 1% to 15%. Ag nanoparticles had no significant effect. It can be assumed that may be the presence of nanoparticles with high specific area (eg. SiO2) in the hydrate formation system increased the interfacial area, which
enhances the mass transfer (gas consumption). During crystallization, it was seen that nano-silica at a concentration of 0.3 wt% had a very important effect on gas consumption with an improvement of 77% compared to the pure water. In the case of alumina, the significant
impact was observed between 0.1 and 0.2 wt%., the gas consumption was increased by 30% to 65%, while Ag nanoparticles had no significant effect during this phase. It can be hypothesized that the addition of nanoparticles with high specific surface area increased strongly the mass and heat transfer between the gases, liquid, and hydrate phases, which increased the amount of consumed gas and the released heat.
5. ACKNOWLEDGMENT
LCMVAR (Laboratory of Materials Chemistry and the Living), University of Batna is gratefully acknowledged for financial support of this work. ENSM Saint-Etienne (France), Sonatrach Upstream Activity, Technologies & Development Division and Indian Institute of Technology Madras are gratefully acknowledged for technical support and advisory.
6. REFERENCES
Ansari, F., Sobhani, A., Salavati-Niasari, Masoud,. 2014. Sol–gel auto-combustion synthesis of PbFe12O19 using maltose as a novel reductant. RSC Advances. 4, 63946-63950
Deppe, G., Tam, S.S., Currier, R.P., Young, J.S., Anderson, G.K., Le, L., Spencer, D.F.,
2006. Developments in the SIMTECHE Process-Separation of CO2 From Coal
Syngas by Formation of Hydrates. NEXANT, INC.
Ganji, H., Aalaie, J., Boroojerdi, S.H., Rezaei Rod, A., 2013. Effect of polymer nanocomposites on methane hydrate stability and storage capacity. Journal of Petroleum Science and Engineering. 112, 32-35.
Ganji, H., Manteghian, M., Rahimi Mofrad, H., 2007b. Effect of mixed compounds on methane hydrate formation and dissociation rates and storage capacity. Fuel Processing Technology. 88, 891-895.
Ganji, H., Manteghian, M., Sadaghiani zadeh, K., Omidkhah, M.R., Rahimi Mofrad, H.,
2007a. Effect of different surfactants on methane hydrates formation rate, stability
Jung, J. Y., Lee, J.W., Kang, Y.T., 2012. CO2 absorption characteristics of nanoparticle
suspensions in methanol. Journal of Mechanical Science and Technology. 26, 2285– 2290.
Karimi, R., Varaminian, F., Izadpanah, A.A., Mohammadi, A.H., 2013. Effects of Different Surfactants on the Kinetics of Ethane-Hydrate Formation: Experimental and Modeling Studies. Energy Technology. 1, 530-536.
Kim, N. J., Park S. S., Kim, H. T., Chun W., 2011. A comparative study on the enhanced formation of methane hydrate using CM-95 and CM-100 MWCNTs. International Communication in Heat and Mass Transfer. 38, 31-36.
Kim, W.-G., Kang, H.U., Jung, K.-M., Kim, S.H., 2008. Synthesis of Silica Nanofluid and Application to CO2 Absorption. Separation Science and Technology. 43, 3036–3055.
Lee, J.W., Kang, Y.T., 2013. CO2 absorption enhancement by Al2O3 nanoparticles in NaCl
aqueous solution: Energy, 53, 206–211.
Li. J, Liang, D., Guo, K., Wang R., Fan, S, 2006. Formation and dissociation of HFC134a gas hydrate in nano-copper suspension. Energy Conversion and Management. 47, 201-210.
Mohammadi, A., Manteghian, M., Haghtalab, A., Mohammadi, A.H., Abkenar, M.R., 2014. Kinetic Study of Carbon Dioxide Hydrate Formation in Presence of Silver Nanoparticules and SDS. Chemical Engineering Journal. 237, 387-395.
Mohammadi, M., Haghtalab, A., Fakhroueian, Z., 2016. Experimental study and thermodynamic modeling of CO2 gas hydrate formation in presence of zinc oxide
nanoparticles: The Journal of Chemical Thermodynamics. 96, 24–33.
Mondal, M., Balsora, H., Varshney, P., 2012. Progress and Trends in CO2 Capture/Separation
Najibi, H., Mirzaee Shayegan, M., Heidary, H., 2015. Experimental investigation of methane hydrate formation in the presence of copper oxide nanoparticles and SDS. Journal of Natural Gas Science and Engineering. 23, 315-323.
Olle, B., Bucak, S., Holmes, T.C., Bromberg, L., Hatton, T.A., Wang D.I.C., 2006. Enhancement of oxygen mass transfer using functionalized magnetic nanoparticles. Ind Eng Chem. 45, 4355–4363.
Özerinç, S., Kakaç, S., Yazıcıoğlu, A., 2010. Enhanced thermal conductivity of nanofluids: a state-of-the-art review. Microfluidics and Nanofluidics. 8, 145-170.
Park, S. S., An E. J., Lee S. B., Chun W., Kim N. J.2012. Characteristics of methane hydrate formation in carbon nanofluids. Journal of Industrial and Engineering Chemistry. 18, 443-448.
Park, S. S.,Li, S. B., Kim N. J., 2010. Effect of multi-walled carbon nanotubes on methane hydrate formation. Journal of Industrial and Engineering Chemistry. 16, 551-555. Sobhani, A., Salavati-Niasarib, Masoud., 2014. A new simple route for the preparation of
nanosized copper selenides under different conditions. 40, 8173–8182.
Sobhani, A., Salavati-Niasarib, Masoud., 2015. Synthesis and characterization of FeSe2
nanoparticles and FeSe2/FeO(OH) nanocomposites by hydrothermal method. Journal
of Alloys and Compounds. 625, 26-33.
Sobhani, A., Salavati-Niasarib, Masoud., 2015. CdSe nanoparticles: facile hydrothermal synthesis, characterization and optical properties. Journal of Materials Science: Materials in Electronics.26, 6831-6836.
Torres, P., I., Lee, J.W., Jung, I., Kang, Y.T., 2012. CO2 absorption enhancement by
methanol-based Al2O3 and SiO2 nanofluids in a tray column absorber. International
Zhang, J.S., Lee, S., Lee, J.W., 2007. Kinetics of Methane Hydrate Formation from SDS Solution. Industrial & Engineering Chemistry Research. 46, 6353-6359.
Zhou, S.D., Yu, Y.S., Zhao, M.M., Wang, S.L., Zhang, G.Z., 2014. Effect of Graphite Nanoparticles on Promoting CO2 Hydrate Formation. Energy Fuels. 28, 4694–4698.