HAL Id: hal-01261282
https://hal.archives-ouvertes.fr/hal-01261282
Submitted on 25 Jan 2016
HAL is a multi-disciplinary open access archive for the deposit and dissemination of sci-entific research documents, whether they are pub-lished or not. The documents may come from teaching and research institutions in France or abroad, or from public or private research centers.
L’archive ouverte pluridisciplinaire HAL, est destinée au dépôt et à la diffusion de documents scientifiques de niveau recherche, publiés ou non, émanant des établissements d’enseignement et de recherche français ou étrangers, des laboratoires publics ou privés.
Human perception-based distributed architecture for
scalable video conferencing services: theoretical models
and performance
Tien Anh Le, Hang Nguyen
To cite this version:
Tien Anh Le, Hang Nguyen. Human perception-based distributed architecture for scalable video conferencing services: theoretical models and performance. Annals of Telecommunications - annales des télécommunications, Springer, 2014, 69 (1), pp.111 - 121. �10.1007/s12243-013-0355-x�. �hal-01261282�
Enriched human perception-based distributed
architecture for scalable video conferencing
services: theoretical models and performance
Tien Anh LE, Student Member, IEEE, and Hang NGUYEN, Member, IEEE
Abstract
This research work proposes an enriched human perception-based distributed architecture for the multi-party video conferencing services. Rich theoretical models of the three different architectures: the proposed perception-based distributed architecture, the conventional centralized architecture and perception-based centralized architecture have been constructed by using queuing theory to reflect the traffic generated, transmitted and processed on all three architectures. The performance of these three different architectures has been considered in different aspects from the total waiting time, the point-to-point delay and the required service rates to the total throughput. Together, the modelling tools, the analysis, and the numerical results help to answer the common concern about advantages and disadvantages between the centralized and distributed architectures for the video conferencing service architecture.
Index Terms
Service architecture, Distributed architecture, Centralized architecture, Scalable video coding, Video-conference Service
Tien Anh LE, and Hang NGUYEN are with the Department of Wireless Networks and Mobile Multimedia Services, Telecom
I. INTRODUCTION
Video conferencing service, the most complex type of video communications is foreseen to be the next popular digital communication after voice communications. In general, centralized architectures are mainly used to build a video conference service and distributed architectures are finding their ways to be widely recognized. Centralized and distributed architectures have their own advantages and questions are usually asked about which architecture is preferable in certain network and usage conditions. Main players in the centralized video conferencing architectures are often special equipment-based solutions [2], [3], web-based services [4] or IMS-based architectures [5]. When more participants want to join the conference (e.g. at big events), the cost of the centralized architecture increases sharply. Therefore, distributed architectures have been proposed in [6], [7]. Both IP-Multicast and Application Layer Multicast have been applied to build the distributed video conferencing architecture [8], [9]. In[10], [11] scalability has been considered and Scalable Video Coding (SVC) has been applied to support varied types of participants’ terminals. From the best of our knowledge, none of the proposed distributed architectures has compared its performance with the conventional centralized architecture. Thus, no conclusion can be made on whether a distributed architecture is really better than the centralized architecture and whether service users should bother changing their current centralized conferencing systems with a new distributed system. So far,[12] is an early attempt to compare the two types of conferencing architectures using its proposed evaluation platform[13]. The experimental results show that, when using a much higher computational capacity, the MCU of the centralized architecture can only provide a similar bit-rate with the distributed architecture at the trade-off of a much higher delay. These results were interesting but they need to be validated by theoretical analysis in order to be applied in more general conditions.
In section II of this paper, we propose a new enriched human perception-based distributed video conferencing architecture in which limitations of human perception when participating
into the conference will be considered in order to reduce the unnecessary traffic on the overlay network. In section III, theoretical queuing models are constructed and analysed for four main performance criteria: total waiting time, end-to-end delay, computational requirements and total throughput of three different architectures: centralized, perception-based centralized and the proposed perception-based distributed architectures. The performance of the three architectures have been considered and compared in terms of the four performance criteria. Mathematical analysis and expression for these parameters have also been constructed. The waiting time performance compares the processing and queuing mechanisms in the three architectures. The end-to-end delay comparison considers the delay of a packet including the processing time in the queues and also the transmission time in the underlay network. The required service rates explain how much computation capacity the important nodes have to equip in order to support steady states of the queues formed and processed by each architecture. Finally, the total throughput performance answers very common concerns of whether the distributed architecture usually has much more traffic than the centralized architecture or not. By approaching the performance from different aspects, a completed view of the proposal is archived. Numerical computation of the analysing models for four main performance criteria shows that the perception-based distributed architecture performs better than the other two in all four main aspects of performance.
II. PROPOSEDARCHITECTURE OF HUMAN PERCEPTION-BASEDDISTRIBUTED SCALABLE
VIDEO CONFERENCING SERVICES
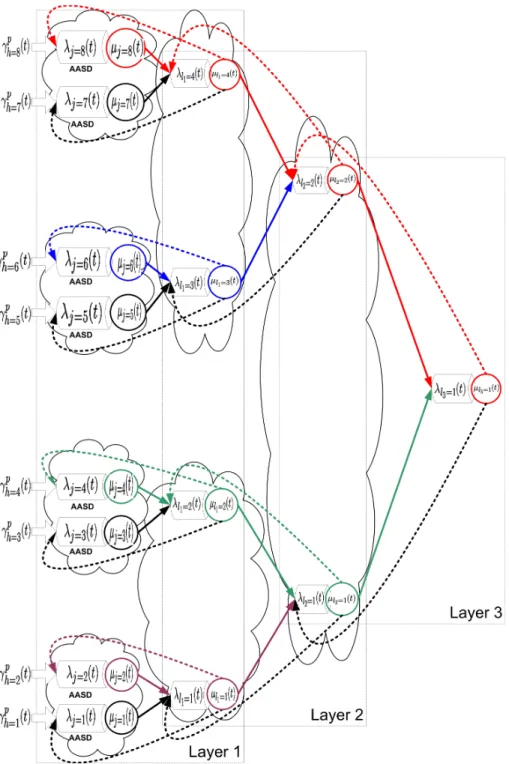
In our first proposal [14] and in this paper, the application-aware multi-variable cost function proposed in [15] can be used as the optimal cost function to build the media distribution tree for the perception-based distributed architecture. The following model and analysis can be generally applied to a media distribution tree built from any cost function. Figure 1 displays the main characteristics of our proposal. A cluster is a group of k peers which have the nearest distance to each other according to the optimization of the applied cost function. When a peer wants to
join the overlay group, it will first try to explore its nearest cluster to join into by measuring the costs to reach the leaders of all clusters. A cluster has the maximum size of k peers depending on the network conditions. A group’s leader is the one who has the minimum total cost to reach to all other peers in the cluster. Here we assume that all the important criteria such as processing capacity, available memory, bandwidth of the group’s leader have been fully considered in the applying multi-variable cost function before calculating the cost. All leaders, from the first layer, will then use the same cost function to calculate its costs to reach to all other leaders at layer 1. These costs will then be applied to form clusters and a second layer. The calculations are made until the maximum number of layers (lmax) is reached. A leader l will receive bit-streams
from its cluster’s peers j with a throughput of λj→l and a traffic variation represented by Cj→l2 .
The leader makes (k-1) duplications of the arriving bit-stream before multicasting the traffic back to the other peers at a variation of Cψ→l2 and to the upper layer’s leaders. At the same time, it receives the bit-streams from upper layer’s leader and forwards them to its cluster’s members. The proposed architecture is applied when SVC (or any multilayer video coding) is used. In a conference session, at any given time, there are normally one or a few active speakers (the participants who are giving the speech or participating into the discussion). They can be automatically found by comparing the participant microphones’ output power. A simple reason is that, if all participants are to be displayed with full quality in a conference session, a human-being and his terminal will not have enough perception and displaying capacity to follow all of them. From the multicast tree’s point of view, an Auto Active Speaker Detector (AASD) can easily reduce the unnecessary traffic for the entire distributed system. The AASD is a functional block placed at each peer to automatically detect whether the peer is an active speaker by comparing its input audio powers[16]. We call rb
hl(t), r ei
hl(t) the instantaneous values of the traffic rectification
coefficients on base and ith enhancement video layers from hth participant to a cluster leader l.
Let rei
hl(t) = 1 if the member wants to receive ith enhancement video layer from hth participant,
it equals to 0 otherwise. All peers send their base video layer (at a bit-rate of γb
cluster’s leader. Active speakers also send their ith enhancement layers to the cluster’s leader (at a bit-rate of γhlei(t)). Enhancement layer bit-stream from an inactive but interesting users may be desirable for some peers. Those particular peers can inform its cluster’s leader about the interesting user(s) they want to receive enhancement video layers from. Through a network of leaders, this information will be notified to the interesting users and to all the cluster’s leaders. After receiving the notification, the interesting users send their enhancement video layers to the group as if they are active speakers. Each leader maintains a Conferee Preference Table (CPT) and to all the cluster’s leaders. This is a record table of N rows and N columns (N is the number of participants). The AASD at each participant can also update its cluster leader whether it is an active speaker so that the cluster’s leader can update to the CPT. Therefore, the default value of the CPT can be determined by the AASD at each participant. Another option is that each conferee can also select the interesting participant(s) by updating 1 to the corresponding place(s) (CPT[h,h’]) of the table. Each participant can also select whether or not it wants to have the CPT automatically updated by its AASD. Thus, the CPT can be dynamically updated by the AASD or it can be manually maintained by the users’ selections. The CPT’s content is synchronized among all the leaders of the perception-based distributed architecture. As a result, rhlei(t) = 1 if it is an active speaker detected by the AASD or it is an interesting user registered by at least one other participant, it equals to 0 otherwise. A participant sends its enhancement video layers if its corresponding traffic rectification coefficient rei
hl(t) = 1 and does not send it otherwise. On the
other hand, after receiving the enhancement video layers from its upper layer leader, each leader decides whether or not it should forward an enhancement video layer to its cluster’s members based on its CPT. A private point to point video chat session can be established and maintained using the same CPT’s mechanism.
III. THEORETICAL ANALYSIS
In order to compare the queuing delay of the three different architectures, three queuing models are constructed with the notations in Table I, Fig.1 and Fig.2. According to[17], the approximated waiting time of each service architecture (G/G/1 queue of General distribution of inter-arrival time, General distribution of service time, 1 parallel server) is calculated by:
Wq≈ ρ 1 − ρ ! C2 A+ CB2 2 ! 1 µ ! g(ρ, CA2, CB2) (1) where: g(ρ, CA2, CB2) = exp " −2(1 − ρ) 3ρ . (1 − C2 A)2 C2 A+ CB2 # , if C2 A < 1 1, if C2 A ≥ 1 (2) C2
B is a fixed value determined by the type of hardware used at the queuing nodes. The SCV
value of the distribution of arriving traffic at each node (C2
Ai) can be calculated by:
CAi2 = 1 λi γiCOi2 + k X j=1 λjCji2 (3)
The SCV value of the distribution of departing traffic from each node (C2
Di) can be calculated by: CDi2 = ρ2iCBi2 + (1 − ρ2i)CAi2 (4) Cij2 = λi→j λDi CDi2 + 1 − λi→j λDi ! (5) Replace Equ.4 into Equ.5, we have the final form of the SCV of service rate for traffic generated by node i departing for node j:
Cij2 = λi→j λDi h ρ2iCBi2 + (1 − ρi2)CAi2 i+ 1 − λi→j λDi ! (6) For all of the following models, we use an abstract concept of traffic arriving from the ”multicast duplicator”. This is due to the fact that, in a multicast session, each transmitting node has to duplicate the arriving traffic before forwarding them to several multicast receivers. We model that extra traffic as the traffic from an abstract ”multicast duplicator” (ψ) at the multicast transmitter.
Since the end-to-end delay of each architecture depends on the queuing time, if we succeed in building queuing models and then calculate the approximated waiting time for the three different architectures, end-to-end delay can be compared based on these results.
A. Theoretical expression of the waiting time in queues
Each peer encodes a scalable video stream with a base layer and several enhancement layers. nemax is the pre-defined number of enhancement video layers from each participant. The instan-taneous value of the traffic rate departing from the hth participant to the leader l at the 1st layer is: γhlp(t) = rbhl(t).γhlb (t) + ne max X i=1 reihl(t).γhlei(t) (7) To calculate the waiting time in the three architectures, we need to properly calculate the value of CoV2 in these three cases. Let Xhlb (t), Xhlei(t), Xhlp(t) are respectively the instantaneous random inter-arrival time of the traffic generated by the base layer, the ith enhancement layer, and the aggregated video layer from participant h to the leader l of its cluster. Since a SVC stream comprises of one base layer and i enhancement layers, we have:
Xhlp(t) = Xhlb (t).rhlb (t) + ne max X i=1 Xhlei(t).rhlei(t) (8) The CoV value of the aggregated video can be calculated from Equ.8 as:
CoV2(Xhlp(t)) = V ar(X p hl(t)) E2(Xp hl(t)) (9) In which, V ar(Xhlp(t)), E2(Xp
hl(t)) can be calculated from Equ.8:
V ar(Xhlp(t)) = (rb hl(t))2.CoV2(Xhlb (t)).E2(Xhlb (t)) + ne max X i=1 (reihl(t))2.CoV2(Xhlei(t)).E2(Xhlei(t)) E(Xhlp(t)) = rb hl(t).E(Xhlb (t)) + nemax X i=1 reihl(t).E(Xhlei(t)) (10)
In the case of the perception-based centralized architecture, the final form of CoV2(Xhpp (t)) is: CoV2(Xhpp (t)) = (rb hp(t))2.CoV2(Xhpb (t)).E2(Xhpb (t)) + ne max X i=1 (reihp(t))2.CoV2(Xhpei(t)).E2(Xhpei(t)) rbhp(t).E(Xhpb (t)) + ne max X i=1 .rhpei(t).E(Xhpei(t)) 2 (11) In case of the MCU (centralized architecture), the CoV2(Xhla(t)) can be directly calculated by:
CoV2(XhSa (t)) = V ar(X a hS(t)) E2(Xa hS(t)) (12) 1) Perception-based distributed architecture: The distributed model for this architecture is as shown in Fig.1. The throughput arriving to a leader at layer l (λAl) is comprised of: the
throughput arriving from all peers j of the cluster to the leader l (λj→l), and the throughput
from the ”multicast duplicator” ψl to the leader l (γψ→l), considered as the external traffic at the
leader l.
The throughput arriving from all peer j of the cluster to the leader l (λj→l) is comprised of
the throughput from all the video bit-streams from all the conferees belonging to the sub-trees whose root is the leader l to the leader l:
λj→l =
jkl−1 X
h=1+(j−1)kl−1
γhlp(t) (13)
The throughput from the ”multicast duplicator” ψl to the leader l (γψ→l) comprises of (k-1)
copies of throughput from all the peers:
γψ→l = (k − 1) N
X
h=1
γhlp(t) (14)
From Equations (13) and (14), we can calculate the overall throughput arriving to the leader l: λAl = k
N
X
h=1
γhlp(t) (15)
The purpose is to form an equation for calculating the SCV of times between arrivals to the leader l because it will determine the waiting time of the traffic queue at the leader l. The general
form of CAl2 is: CAl2 = vAl λAl = 1 λAl . γψ→l.Coψl2 + N X j=1 λj→l.Cj→l2 (16)
We need to calculate the SCV of times between departures from peer j to the leader l (Cj→l2 ) and from the abstract ”multicast duplicator” to the leader l (Coψl2 ).
At the first layer, since all the peers are directly the video conferees, we have:
Cj→l=12 = Ch=j→l2 = CoV2(Xhlp(t)) (17) The value of CoV2(Xhlp(t)) is given by Equ.9. Now we can calculate the SCV of times between departures from the abstract ”multicast duplicator” to the leader l as the combination of the SCV of times between departures from (k-1) peers j to the leader l:
Coψl=12 =
k−1
X
j=1
Cj→l=12 (18) In Equ.16, for the first layer, all of the parameters have been given in Equ.15 (λAl), Equ.14
(γψ→l), Equ.13 (λj→l), Equ.18 (Coψl2 ), and Equ.17 (Cj→l2 ). Therefore, CAl=12 is known for the
first layer.
At the second layer, according to Equ.4 and Equ.5, we have: Cj→l=22 = λj→l λDj h ρ2j.CBj2 + (1 − ρ2j).CAj2 i+ (1 − λj→l λDj ) (19)
The traffic intensity (traffic congestion) at each peer (ρj) is calculated by:
ρj = λj Ml = k N X h=1 γhlp(t) Ml (20) λDj is the throughput departing from a peer j, calculated by:
λDj = k. N
X
h=1
γhlp(t) (21)
For the second layer, the SCV of service rate for the traffic arriving to the peer j (C2
Aj) at layer
2 can be calculated from C2
Al=1 at the first layer as:
In Equ.19, all of the parameters are known (λj→l in Equ.13, λDj in Equ.21, ρj in Equ.20,
C2
Aj in Equ.22). Therefore, Cj→l=22 is known. Now we can calculate the SCV of times between
departures from the abstract ”multicast duplicator” to the leader l of the second layer as the combination of the SCV of times between departures from (k-1) peers j to the leader l at the second layer: Coψl=22 = k−1 X j=1 Cj→l=22 (23) In Equ.16, for the second layer, all of the parameters have been given in Equ.15 (λAl), Equ.14
(γψ→l), Equ.13 (λj→l), Equ.23 (Coψl=22 ), and Equ.19 (Cj→l=22 ). Then, we would be able to
calculate the SCV of service rate for the traffic arriving to the leader l at layer 2 (C2 Al=2).
Recursively, we can calculate the values of C2
Al on all the upper layers by applying the same
method of calculating it on the first and the second layers and using Equ.16. From the value of C2
Al of all layers obtained from Equ.16 we can calculate the waiting time at
a leader in layer l according to Equ.1, we have: Wql ≈ ρl 1 − ρl ! C2 Al+ CBl2 2 ! 1 µl ! (24) The required service rate and the congestion rate at each leader l (µl, ρl) are explained and
calculated in more details in section III-C and Equ.39. Since k members in a cluster have to wait in sequence to be served by the cluster’s leader, the total waiting time of the perception-based distributed architecture is calculated by:
Wqd = lmax
X
l=1
kWql (25)
In which lmax is the maximum number of layers in the perception-based distributed architecture.
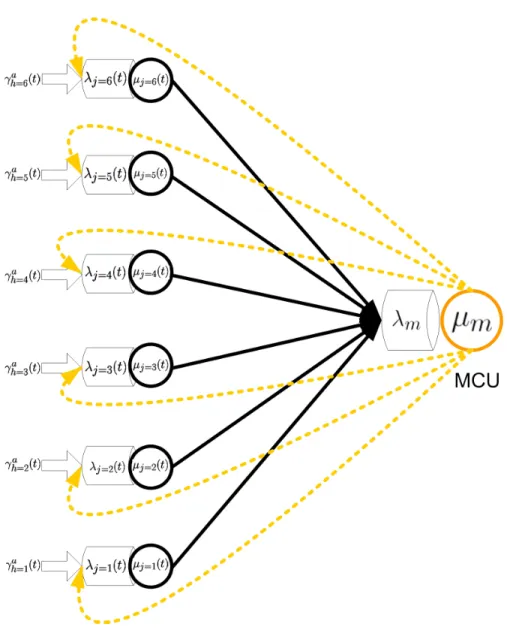
2) Centralized architecture: The centralized model is as shown in Fig.2. The throughput arriving to the centralized MCU (λAS) is comprised of: the throughput arriving from each peer
j = h to the MCU (λj→S), and the throughput generated by the ”multicast duplicator” ψS for
to the centralized MCU is therefore: λAS = γψ→S + N X j=1 λj→S (26)
Applying Equ.3, we can obtain the SCV of the service rate at the MCU server: CAS2 = 1 λAS . γψ→S.CoψS2 + N X j=1 λj→S.Cj→S2 (27) In which: CoψS2 = N −1 X j=1
Cj→S2 and Cj→S2 = CoV2(Xh=j,l=Sa (t)) = CoV2(XhSa (t)) λj→S = γh=ja (t) and λAS = (N − 1) N X h=1 γhSa (t) γψ→S = (N − 2) N X h=1 γhSa (t) (28)
From the value of C2
AS obtained from Equ.27 and Equ.28 we can calculate the waiting time at
the MCU according to Equ.1, we have: Wqm ≈ ρS 1 − ρS ! C2 AS+ CBS2 2 ! 1 µm ! (29) The required service rate and the congestion rate at the MCU (µm, ρm) are explained and
calculated in more details in section III-C and Equ.40.
Since N participants have to wait in sequence to be served by the MCU, the total waiting time of the centralized architecture is calculated by:
Wqc= N Wqm (30)
3) Perception-based centralized architecture: is a special case of the centralized architecture with the newly proposed perception-based function (replacing γhSa (t) by γhpp (t)):
CAp2 = 1 λAp . γψ→p.Coψp2 + N X j=1 λj→p.Cj→p2 (31) Coψp2 = N −1 X j=1
Cj→p2 and Cj→p2 = CoV2(Xh=j,l=pp (t)) = CoV2(Xhpp (t)) λj→p = γh=jp (t) and λAp = (N − 1) N X h=1 γhpp (t) γψ→p = (N − 2) N X h=1 γhpp (t) (32)
Wqp ≈ N ρp 1 − ρp ! CAp2 + CBp2 2 ! 1 µp ! (33)
The required service rate and congestion rate at the perception-based centralized server p (µp, ρp)
are explained and calculated in more details in section III-C and Equ.41.
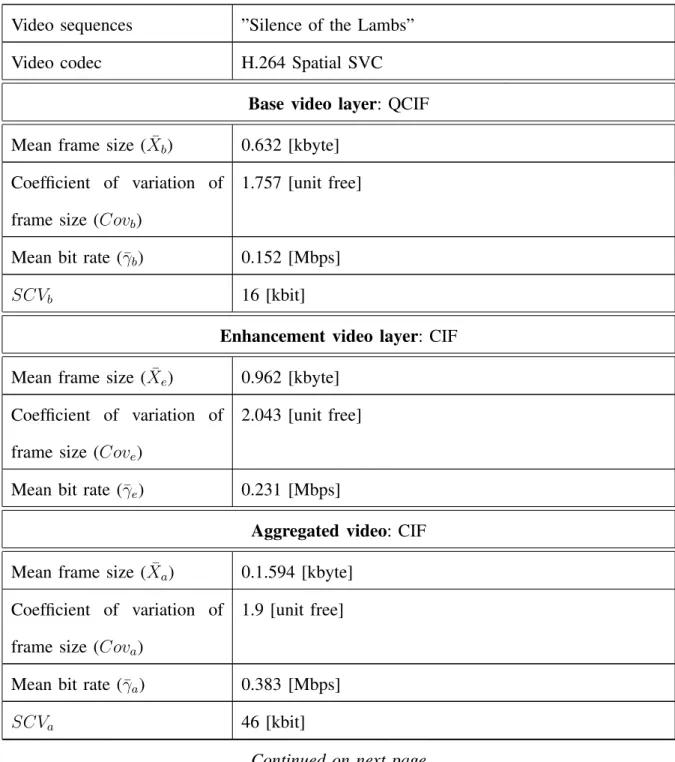
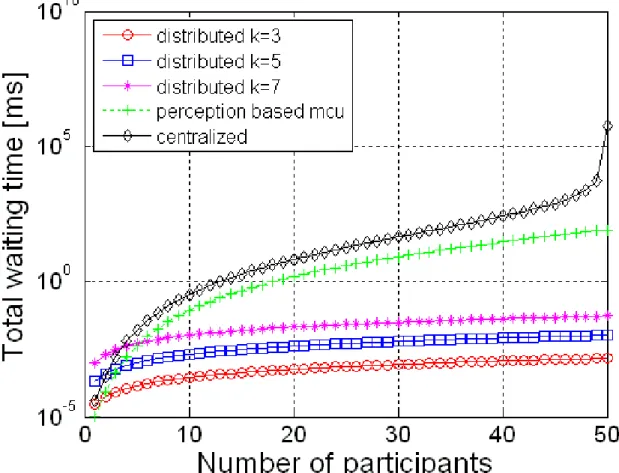
4) Numerical calculation of the waiting time in queues: The newly proposed theoretical models and mathematical expressions formed in the previous subsections allow us to evaluate the performance in the four different performance criteria for the three different architectures in real-time, with an arbitrary number of participants, and with very heterogeneous contexts of peers such as peers with terminals of different screen sizes, different available bandwidth, different computational capacities and a variety of users’ preferences. The proposed theoretical models and mathematical expressions can be applied to model a very complex enriched video conferencing services. Our first step here is to have a first comparison of the three different architectures. Therefore, we apply the available traffic models of the SVC video streams which are currently limited to the mean values of a video session presented in [18], [19] for a simple case of the distributed scalable video conference service. To provide first numerical results of the waiting time in the three different architectures, we apply an averaging of some video conferencing sessions’ values presented in the previous subsections so that we can apply the data provided in [18], [19]. The specifications of the spatial video traffic are shown in Table I. Figures 3 and 4 show the comparison among the total waiting time of the three architectures when the clusters’ sizes are k = 3, k = 5, k = 7. The video streams are encoded with spatial SVC. In the centralized architecture, we assume that the MCU can support of up to Nmax
participants at the same time, all participants are sending both their base and enhancement video layers. In the two figures, there are in average 3 enhancement video layers which are transmitted from all the participants (ne = 3). In the perception-based centralized architecture
and the perception-based distributed architecture, all peers send their base layers and some peers send their enhancement video layers. In Figure 3, the base video layer and the enhancement
video layers from 10% of the total number of participants are sent (rb = 1, re = 0.1). In
Figure 4, 50% of the peers send their enhancement video traffic (rb = 1, re= 0.5). Each leader
can support at least k peers in its cluster. We are going to analyze the results to show the effect of three main aspects on the total waiting time performance: (i) comparison between the distributed and the centralized architectures, (ii) impacts of the cluster size on the performance, and (iii) the newly proposed perception-based function’s performance. The total waiting time of both the centralized and perception-based centralized architectures increases exponentially with the increasing number of participants. Meanwhile the total waiting time of the perception-based distributed architecture increases at a much lower logarithmic speed. The centralized architecture has the highest value followed by the based centralized architecture. The perception-based distributed architecture outperforms the other two centralized architectures. Especially, when the number of participants increases. The cluster size also plays a role in the waiting time. When the number of peers in a cluster (k) increases, the total waiting time in the distributed queue increases. Therefore, for a certain number of participants (N=50), it is recommended to use a smaller cluster size to maintain a lower total waiting time. When we make comparisons among the total waiting time of the two different figures (re = 0.1, re = 0.5), the more unnecessary traffic
is reduced by applying our newly proposed based function (both in the perception-based centralized and perception-perception-based distributed architectures), the lower the total waiting time is. The newly proposed perception-based function can actually limit the unnecessary traffic and reduce the total waiting time.
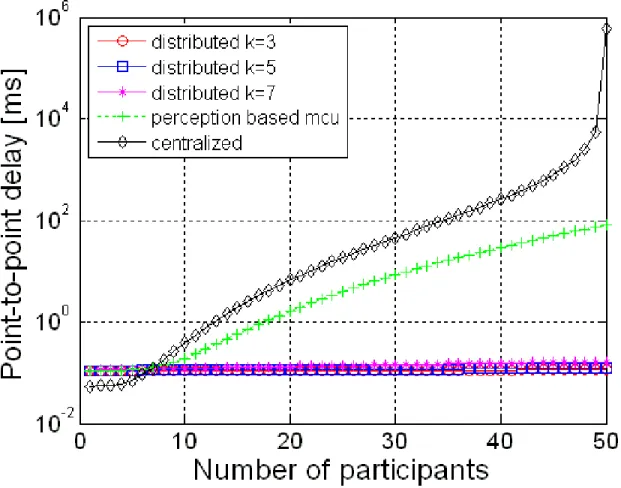
B. Point-to-point delay
We apply the point-to-point delay analysis proposed in[20] to analyse the delay caused by packet transmission on the underlay network. This end-to-end delay comprises of a fixed delay
and a variable delay: dpoint−to−point= df ix+ dvar = p. h X i=1 ( 1 Ci ) + h X i=1 δi+ dvar = p.α + β + dvar (34)
In which, h is the number of hops, Ci is the capacity of each link, δi is the propagation delay
on each link, and p is the packet’s size. Through real measurement data: α is found to be in the range of {27.10−6 : 6.10−5} and β is found to be in the range of {28 : 35}. There are two value ranges for the dvar: if the link utilization ≤ 90% then dvar ≤ 1ms, otherwise if the link utilization > 90% then dvar is tens of ms, we choose dvar to be 20ms. With a packet size ranging from {40 : 1500} bytes (most common packet size on the Internet), we obtain df ix from Equ.34.
1) Perception-based distributed architecture: A cost function considering the cost to join each cluster has been applied. We manage to group participants which are in the same local area or with the lowest possible cost into one cluster. Therefore, it is likely that a packet has to travel across less hops before reaching its cluster’s leader. The parameter set for calculating the point-to-point delay in the perception-based distributed architecture is: αALM = 3.10−5, βALM =
28ms, dvar
ALM = 1ms. From Equ.34, applying p = 1500(bytes) we can obtain the total delay of
the perception-based distributed architectures which is equal to the sum of the total waiting time at all nodes (as calculated by Wqd) and its correspondent point-to-point delay:
DALM = Wqd+ dALM = Wqd+ (3.10−5+ 28). logkN = Wqd+ 28 logkN (35)
2) Centralized architecture: All participants have to connect to the same MCU to be served. Thus the probability that these participants are located in different countries or even different continents is high. In such cases, the number of underlay hops that a packet has to travel in order to reach the MCU is also high. Therefore, we choose a value set which has the highest value to calculate the point-to-point delay of the centralized architecture. The parameter set for calculating the point-to-point delay in the centralized architecture is αM CU = 6.10−5, βM CU =
35ms, dvar
the centralized architecture which is equal to the sum of the total waiting time at all nodes (as calculated by Wqc) and its correspondent point-to-point delay.
DM CU = Wqc+ dM CU = Wqc+ 6.10−5p + 55 = Wqc+ 55 (36)
3) Perception-based centralized architecture:
DP erM CU = Wqp+ 55 (37)
4) Result Analysis: Figures 5 and 6 show the point-to-point delay of the three different architectures considering both total waiting time in queues and point-to-point transverse time at the underlay network. It is clear in all figures that, the point-to-point delay of the perception-based distributed architecture is far better than the centralized and perception-perception-based centralized architectures. Regarding the perception-based distributed architecture, the larger the cluster size (k) is, the higher the delay is. Therefore, it is better to keep it small. When the newly proposed perception-based function is applied to reduce the unnecessary traffic, the point-to-point delay performance is improved. The more unnecessary traffic is reduced by applying our newly proposed perception-based function, the lower the point-to-point delay is.
C. Required service rate
In general, a required service rate is necessary to maintain stability in a queue. According to the queuing theory, this required service rate can be calculated by the following condition:
ρ = λ
µ < 1 (38)
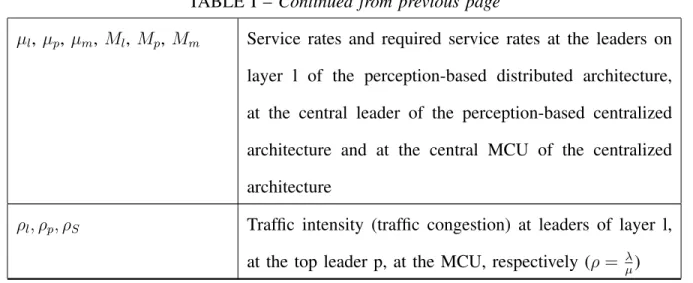
We will calculate and analyze these requirements in details for each architecture. If an architecture can fulfill its required service rate, it can maintain the stability of the service queues. There are required services rates to maintain steady-states at the queues processed by each architecture (Ml, Mp, MS).
1) Perception-based distributed architecture: The traffic intensity at a leader of layer l is ρl = λµAl
l . In order for the queue at the leader to be in steady-state conditions, we must have
ρl < 1 or µl > λAl. Assuming that the perception-based leader l has been designed to support
the maximum throughput M ax(λAl) and the system can support of up to Nmax participants, we
have:
ρl =
λAl
Ml
and µl = Ml= (k.Nmax+ 1).M ax(γhlp(t)) (39)
M ax(γhlp(t)) is the peak value of the instantaneous γhlp(t).
2) Centralized architecture: The traffic intensity at the MCU is ρm = λµASm (assuming that
only one server is used as the MCU). In order for the queue at the MCU to be in steady-state conditions, we must have ρm < 1 or µm > λAS. Assuming that we have designed a MCU to
support of up to Nmax participants, and a peak value of the instantaneous M ax(λAS) then the
maximum throughput to be managed at the MCU is: ρm =
λAS
Mm
and µm = Mm = (Nmax2 − Nmax+ 1).M ax(γhSa (t)) (40)
3) Perception-based centralized architecture: ρp =
λAp
Mp
and µp = Mp = (Nmax2 − Nmax+ 1).M ax(γhpp (t)) (41)
4) Result Analysis: Figures 7 and 8 show the required service rates among the three architec-tures for two different traffic configurations (re = 0.1, re = 0.5). If a steady state is maintained
in a queue, the waiting time can be high but never be infinitive meaning that all of the traffic will be definitely processed. Otherwise, if the steady state is not maintained, the queues will enter a blocked state in which no more traffic can be processed and congestion happens. It is clear from the two figures that the required service rate at the perception-based distributed architecture is much smaller than it is at the centralized and perception-based centralized architectures. With the same perception-based distributed architecture, and with the total number of 50 participants, the required service rate increases when the cluster size increases. Therefore, for this config-uration of video conference, it is recommended to use a smaller cluster size. All two figures
show that, when the newly proposed perception-based function is applied, the perception-based centralized architecture can reduce the required service rate in comparison with the centralized architecture. The more unnecessary traffic is reduced by applying our newly proposed perception-based function, the lower the required service rate is. There is an obvious relation between the required service rate and the price of the solution built from each architecture. This relation can be exponential. We can conclude that, the distributed architecture and the newly proposed perception-based function, when applied, can reduce the required service rate and therefore the cost of the video conferencing service.
D. Estimation of global throughput in the network
In this section, we will estimate the global throughput generated by the three architectures. The purpose is to prove that the newly proposed perception-based distributed architecture does not actually increase the total traffic transmitted on the overlay network. It can even reduce the total traffic when the perception-base function is applied to throttle the enhancement video layer traffic.
1) Perception-based distributed architecture: Considering a peer j at layer l of the perception-based distributed architecture, we have the throughput from a peer j to a leader l and the throughput from the leader l to the peer j are λj→l and λl→j, respectively. The throughput
from a peer j to a leader l (λj→l) can be calculated by adding the traffic arriving from each
participant: λj→l = jkl−1 X h=1+(j−1)k(l−1) γhlp(t) (42) λl→j = N X h=kl+1 γhlp(t) + kl X h=1 γhlp(t) − jk(l−1) X h=1+(j−1)k(l−1) γhlp(t) (43)
The total throughput in a cluster is calculated by the throughput from all k participants and the multicasting throughput from the leader l to k participants.
Tclusterl = kl X h=1 γhp(t) + k N X h=kl+1 γhp(t) + (k − 1) kl X h=1 γhp(t) = k N X h=1 γhp(t) (44)
There are totally Nkl clusters at layer l. Thus, the total throughput at layer l is: Tl= N k(l−1) N X h=1 γhp(t) (45)
Since there are lmax = logkN layers, the total throughput is:
Td= lmax X l=1 Tl = kN N X h=1 γhp(t) lmax X l=1 1 kl = kN N X h=1 γhp(t) " (N − 1) (k − 1)N # = k(N − 1) (k − 1) N X h=1 γhp(t) (46) 2) Perception-based centralized architecture: We mainly have the throughputs from partici-pant j to the perception-based centralized leader L (λj→L = γh=jp (t)) and vice versa from the
perception-based centralized leader L to the participant j (λL→j = N
X
h=1
γhlp(t)−γh=jp (t)). Therefore, the total throughput is:
Tp = N N
X
h=1
γhp(t) (47)
3) Centralized architecture: By replacing γhp(t) with γa
h(t) in Equ.47, we have: Tm = N N X h=1 γha(t) (48)
4) Result analysis: From Figures 10 and 11 we can see the total throughputs in the three architectures. In fact, the total throughput of the perception-based distributed architecture is equiv-alent to the total throughput of both the centralized and perception-based centralized architectures when 50% (re = 0.5) and all (re = 1) participants send their enhancement video layers. We can
hardly realize the difference between these throughputs in a logarithm plot. When the newly proposed perception-based function is fully applied in Fig.9 so that only 10% of the participants send their enhancement video layers (re = 0.1), the total throughput of the perception-based
centralized and perception-based distributed architectures can be even far lower than the total throughput of the centralized architecture when no perception-based function is applied. This will answer many concerns about whether the perception-based distributed architecture has to manage a higher total throughput than the two conventional centralized architectures or not. The answer is clearly no. It can even reduce the total traffic when the perception-base architecture is applied to throttle the enhancement video layer traffic.
IV. CONCLUSION
In this research, a new enriched distributed video conferencing architecture considering the limitation of human’s perception has been proposed. Mathematical analysis and models have been built and compared for the three architectures using queuing theory in terms of total waiting time, point-to-point delay, required service rates, and total throughput. It is worth noticing that all the enriched features of the proposed video conferencing architecture have been modelled in details and included in the mathematical analysis and expressions. The theoretical models and mathematical expressions allow us to evaluate the performance in all four different criteria for all three different architectures in real-time, with an arbitrary number of participants and with very heterogeneous contexts of peers. Our mathematical models and expressions can be used to determine the optimal cluster size for a given number of participants of the distributed video conference. Numerical simulations obtained from the theoretical analysis models and the off-line statistical data have been done in the context of a multi-party multi-layer video conferencing service. The results show that the newly proposed perception-based distributed architecture outperforms over all four performance criteria the centralized and perception-based centralized architectures. Regarding the original question we try to solve from the beginning of the paper for whether the distributed architecture is better than the centralized architecture or not, we can conclude that, from three different criteria (total waiting time, end-to-end delay and required service rate) that we have chosen to compare, the distributed architecture outperforms the two conventional centralized architectures. Especially when the total number of participants is large. In terms of the total throughput, it is also shown that the distributed architecture has an equivalent performance with the centralized architecture. The newly proposed perception-based function when applied can reduce the total waiting time, point-to-point delay, the required service rate. It can maintain an equivalent or even can reduce the total throughput of the perception-based distributed architecture in comparison with the centralized architecture. In our future work, more
simulations exploiting all the power and details of our mathematical models and expressions should be done. The instantaneous values of γ and λ can be applied for evaluating a global performance in real-time of the three architectures with heterogeneous contexts of peers.
REFERENCES
[1] K. Tirasoontorn, S. Kamolphiwong, and S. Sae-Wong, “Distributed P2P-SIP conference construction,” in Proceedings of the International Conference on Mobile Technology, Applications, and Systems. ACM, 2008, p. 20.
[2] T. M. O’Neil, “Quality of experience and quality of service for IP video conferencing,” Polycom Video Communications, Milpitas, CA, USA, White paper, 2002.
[3] Y. Lu, Y. Zhao, F. Kuipers, and P. Van Mieghem, “Measurement study of multi-party video conferencing,” NETWORKING 2010, pp. 96–108, 2010.
[4] M. S. Silver, “Browser-based applications: popular but flawed?” Information Systems and E-Business Management, vol. 4, no. 4, pp. 361–393, 2006.
[5] R. Spiers and N. Ventura, “An Evaluation of Architectures for IMS Based Video Conferencing,” University of Cape Town, Rondebosch South Africa, 2009.
[6] L. De Cicco, S. Mascolo, and V. Palmisano, “Skype video responsiveness to bandwidth variations,” in Proceedings of the 18th International Workshop on Network and Operating Systems Support for Digital Audio and Video. ACM, 2008, pp. 81–86.
[7] S. A. Baset and H. Schulzrinne, “An analysis of the skype peer-to-peer internet telephony protocol,” Arxiv preprint cs/0412017, 2004.
[8] S. E. Deering, “Multicast routing in a datagram internetwork,” 1991.
[9] C. Luo, W. Wang, J. Tang, J. Sun, and J. Li, “A Multiparty Videoconferencing System Over an Application-Level Multicast Protocol,” IEEE Transactions on Multimedia, vol. 9, no. 8, pp. 1621–1632, 2007.
[10] F. Pereira, L. Torres, C. Guillemot, T. Ebrahimi, R. Leonardi, and S. Klomp, “Distributed Video Coding: Selecting the most promising application scenarios,” Signal Processing: Image Communication, vol. 23, no. 5, pp. 339–352, 2008. [11] H. Jeong, J. Abuan, J. Normile, R. Salsbury, and B. S. Tung, “Heterogeneous video conferencing,” May 2011.
[12] T. A. Le and H. Nguyen, “Centralized and distributed architectures of scalable video conferencing services,” in The Second International Conference on Ubiquitous and Future Networks (ICUFN 2010), Jeju Island, Korea, Jun. 2010, pp. 394–399. [13] T. A. L. H. N. H. Zhang, “EvalSVC - an evaluation platform for scalable video coding transmission,” in 14th International
Symposium on Consumer Electronics (ISCE 2010), Braunschweig, Germany, Jun. 2010, pp. 85–90.
[14] T. A. Le and H. Nguyen, “Perception-based Application Layer Multicast Algorithm for scalable video conferencing,” in IEEE GLOBECOM 2011 - Communication Software, Services, and Multimedia Applications Symposium (GC’11 - CSWS), Houston, Texas, USA, Dec. 2011.
[15] T. A. Le, H. Nguyen, and H. Zhang, “Multi-variable cost function for Application Layer Multicast routing,” in IEEE Globecom 2010 - Communications Software, Services and Multimedia Applications Symposium (GC10 - CSSMA), Miami, Florida, USA, Dec. 2010.
[16] K. Boakye, B. Trueba-Hornero, O. Vinyals, and G. Friedland, “Overlapped speech detection for improved speaker diarization in multiparty meetings,” in Acoustics, Speech and Signal Processing, 2008. ICASSP 2008. IEEE International Conference on. IEEE, 2008, pp. 4353–4356.
[17] D. Gross, Fundamentals of queueing theory. Wiley-India, 2008.
[18] G. Van der Auwera, P. T. David, and M. Reisslein, “Traffic and quality characterization of single-layer video streams encoded with the H. 264/MPEG-4 advanced video coding standard and scalable video coding extension,” IEEE Transactions on Broadcasting, vol. 54, no. 3 part 2, pp. 698–718, 2008.
[19] G. Van der Auwera, P. T. David, M. Reisslein, and L. J. Karam, “Traffic and quality characterization of the H.264/AVC scalable video coding extension,” Adv. MultiMedia, vol. 2008, no. 2, pp. 1–27, 2008. [Online]. Available: http://dx.doi.org/http://dx.doi.org.gate6.inist.fr/10.1155/2008/164027
[20] B. Y. Choi, S. Moon, Z. L. Zhang, K. Papagiannaki, and C. Diot, “Analysis of point-to-point packet delay in an operational network,” Computer Networks, vol. 51, no. 13, pp. 3812–3827, 2007.
TABLE I: Scalable video codec parameters and notations for reference of the queuing model.
Video sequences ”Silence of the Lambs” Video codec H.264 Spatial SVC
Base video layer: QCIF Mean frame size ( ¯Xb) 0.632 [kbyte]
Coefficient of variation of frame size (Covb)
1.757 [unit free]
Mean bit rate (¯γb) 0.152 [Mbps]
SCVb 16 [kbit]
Enhancement video layer: CIF Mean frame size ( ¯Xe) 0.962 [kbyte]
Coefficient of variation of frame size (Cove)
2.043 [unit free]
Mean bit rate (¯γe) 0.231 [Mbps]
Aggregated video: CIF Mean frame size ( ¯Xa) 0.1.594 [kbyte]
Coefficient of variation of frame size (Cova)
1.9 [unit free]
Mean bit rate (¯γa) 0.383 [Mbps]
SCVa 46 [kbit]
TABLE I – Continued from previous page
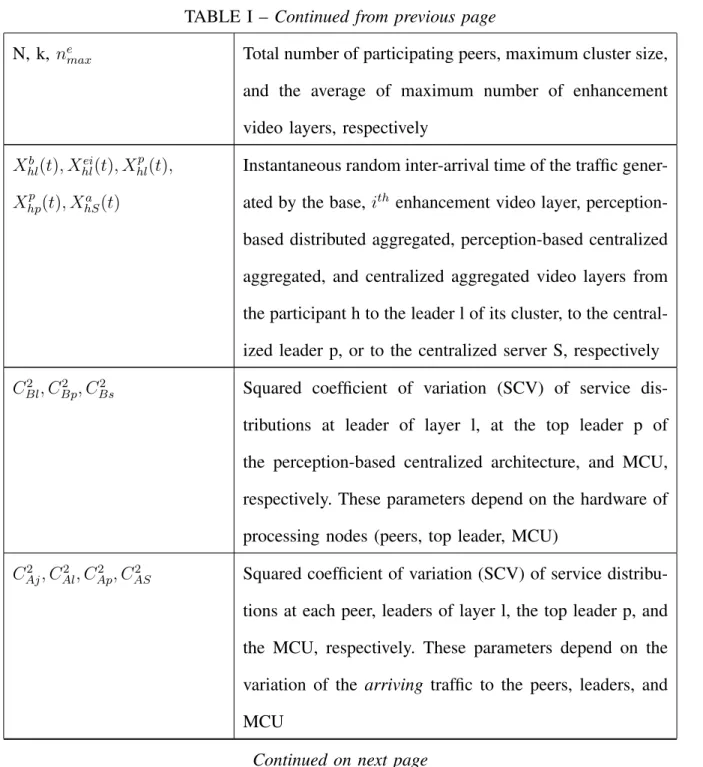
N, k, nemax Total number of participating peers, maximum cluster size, and the average of maximum number of enhancement video layers, respectively
Xb hl(t), Xhlei(t), X p hl(t), Xhpp (t), Xa hS(t)
Instantaneous random inter-arrival time of the traffic gener-ated by the base, ith enhancement video layer,
perception-based distributed aggregated, perception-perception-based centralized aggregated, and centralized aggregated video layers from the participant h to the leader l of its cluster, to the central-ized leader p, or to the centralcentral-ized server S, respectively C2
Bl, CBp2 , CBs2 Squared coefficient of variation (SCV) of service
dis-tributions at leader of layer l, at the top leader p of the perception-based centralized architecture, and MCU, respectively. These parameters depend on the hardware of processing nodes (peers, top leader, MCU)
CAj2 , CAl2 , CAp2 , CAS2 Squared coefficient of variation (SCV) of service distribu-tions at each peer, leaders of layer l, the top leader p, and the MCU, respectively. These parameters depend on the variation of the arriving traffic to the peers, leaders, and MCU
TABLE I – Continued from previous page
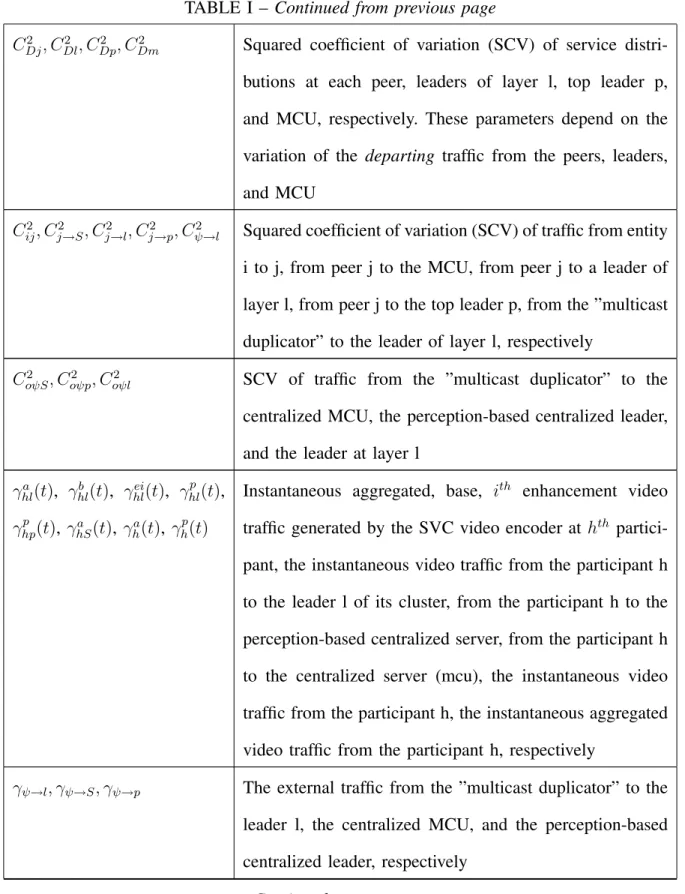
CDj2 , CDl2 , CDp2 , CDm2 Squared coefficient of variation (SCV) of service distri-butions at each peer, leaders of layer l, top leader p, and MCU, respectively. These parameters depend on the variation of the departing traffic from the peers, leaders, and MCU
C2
ij, Cj→S2 , Cj→l2 , Cj→p2 , Cψ→l2 Squared coefficient of variation (SCV) of traffic from entity
i to j, from peer j to the MCU, from peer j to a leader of layer l, from peer j to the top leader p, from the ”multicast duplicator” to the leader of layer l, respectively
C2
oψS, Coψp2 , Coψl2 SCV of traffic from the ”multicast duplicator” to the
centralized MCU, the perception-based centralized leader, and the leader at layer l
γhla(t), γhlb (t), γhlei(t), γhlp(t), γhpp (t), γhSa (t), γha(t), γhp(t)
Instantaneous aggregated, base, ith enhancement video traffic generated by the SVC video encoder at hth partici-pant, the instantaneous video traffic from the participant h to the leader l of its cluster, from the participant h to the perception-based centralized server, from the participant h to the centralized server (mcu), the instantaneous video traffic from the participant h, the instantaneous aggregated video traffic from the participant h, respectively
γψ→l, γψ→S, γψ→p The external traffic from the ”multicast duplicator” to the
leader l, the centralized MCU, and the perception-based centralized leader, respectively
TABLE I – Continued from previous page ¯ γb = Eh,t(γhlb (t)), ¯ γe = Eh,t(γhlei(t)), ¯ γp = Eh,t(γhpp (t)), ¯ γa = Eh,t(γhSa (t))
Mean value over time and for all of the conference par-ticipants of the base, enhancement, and aggregated video traffic from hth participant to a leader in lth layer and to the leader l of its cluster, respectively
λAl, λAS, λAp The throughput arriving to a leader at layer l, the
cen-tralized MCU, the perception-based cencen-tralized leader, respectively
λi→j, λj→S, λj→l, λj→p,
λj→L, λL→j
Throughput from entity i to j, from peer j to the MCU, from peer j to a leader of layer l, from j to the perception-based centralized leader, from member j to the centralized leader L and from the centralized leader L to the member j in the perception-based centralized architecture, respectively λj(t), λl(t), λm(t) Instantaneous throughput at the peer j, the leader l, and the
MCU, respectively rb
hl(t), reihl(t), rbhp(t), reihp(t) Instantaneous values of the traffic rectification coefficients
on base and ith enhancement video layers from hth partic-ipant to the leader l of its cluster, to the perception-based centralized server
¯
rb = Eh,t(rbhl(t)),
¯
re = Eh,t(rhlei(t))
Mean values of the traffic rectification coefficients for base, enhancement video traffics from hth participant to a leader
in lth layer and to the leader l of its cluster, respectively
TABLE I – Continued from previous page
µl, µp, µm, Ml, Mp, Mm Service rates and required service rates at the leaders on
layer l of the perception-based distributed architecture, at the central leader of the perception-based centralized architecture and at the central MCU of the centralized architecture
ρl, ρp, ρS Traffic intensity (traffic congestion) at leaders of layer l,
Fig. 3. Comparison of queuing waiting time among centralized, perception-based centralized and perception-based distributed
Fig. 4. Comparison of queuing waiting time among centralized, perception-based centralized and perception-based distributed
Fig. 5. Comparison of total point-to-point delay among centralized, perception-based centralized and perception-based distributed
Fig. 6. Comparison of total point-to-point delay among centralized, perception-based centralized and perception-based distributed
Fig. 7. Comparison of required service rates among centralized, perception-based centralized and perception-based distributed
Fig. 8. Comparison of required service rates among centralized, perception-based centralized and perception-based distributed
Fig. 9. Comparison of total throughput among centralized, perception-based centralized and perception-based distributed
Fig. 10. Comparison of total throughput among centralized, perception-based centralized and perception-based distributed
Fig. 11. Comparison of total throughput among centralized, perception-based centralized and perception-based distributed