HAL Id: hal-02821875
https://hal.inrae.fr/hal-02821875
Submitted on 6 Jun 2020
HAL is a multi-disciplinary open access
archive for the deposit and dissemination of sci-entific research documents, whether they are pub-lished or not. The documents may come from teaching and research institutions in France or
L’archive ouverte pluridisciplinaire HAL, est destinée au dépôt et à la diffusion de documents scientifiques de niveau recherche, publiés ou non, émanant des établissements d’enseignement et de recherche français ou étrangers, des laboratoires
A preliminary exploration of two approaches for
documenting ’mental models’ held by stakeholders in
the crocodile catchment, South africa
Harry Biggs, Derick Du Toit, Michel Etienne, Natalie Jones, Anne Leitch,
Tim Lynam, Sharon Pollard, Samantha Stone-Jovicich
To cite this version:
Harry Biggs, Derick Du Toit, Michel Etienne, Natalie Jones, Anne Leitch, et al.. A preliminary exploration of two approaches for documenting ’mental models’ held by stakeholders in the crocodile catchment, South africa. [Technical Report] KV 216/08, 2008. �hal-02821875�
A preliminary exploration of two
approaches for documenting
‘mental models’ held by
stakeholders in the Crocodile
A preliminary exploration of two approaches for
documenting ‘mental models’ held by stakeholders in the
Crocodile Catchment, South Africa
by Harry Biggs*1 Derick du Toit 2 Michel Etienne 3 Natalie Jones 4 Anne Leitch 5 Tim Lynam 5 Sharon Pollard 2 Samantha Stone-Jovicich 5
*authors listed alphabetically by surname
1
South African National Parks, Private Bag X402, Skukuza 1350, South Africa
2
Association for Water and Rural Development, Private Bag X483, Acornhoek, 1360, South Africa
3
INRA, 147 rue de l'Université 75338 Paris Cedex 07 France
4
Australian National University, Research School of Pacific and Asian Studies, Canberra 0200, Australia
5
CSIRO. Sustainable Ecosystems, Davies Laboratory, University Drive, Townsville, Queensland 4814, Australia.
Report to the Water Research Commission on a collaborative initiative funded in part by these agencies (listed alphabetically):
CSIRO
INRA (French National Institute for Agricultural Research) Resilience Alliance
South African National Parks
Water Research Commission: Workshop 39/2007
ISBN 978-1-77005-761-6 Report No KV 216/08
Acknowledgements
Thanks are given to Dr Steve Mitchell and Ms Una Wium from the Water Research Commission, and Dirk Roux and Nikki Funke from the CSIR who took a particular interest in this initiative and especially the public meetings associated with it; and to Michele Hofmeyr, Sarah Webb and Thomas Gyedu-Ababio of SANParks who assisted with interview scheduling and logistical arrangements. Thanks also are given to the Inkomati Catchment Management Agency (especially Sizile Ndlovu, Joseph Mabunda, Gugu Sandleni) who assisted with logistic s and venues for most of the interviews. Special thanks are extended to the almost one hundred people with an interest in water and related issues of the region and who participated in our interviews, discussion groups and dialogue sessions.
Thanks to Alexander Herr from CSIRO for his assistance with the interpretation of the consensus analysis results.
This research would not have been possible without funding and/ or support from the following organisations: CSIRO’s Complex Systems Science, INRA (French National Institute for Agricultural Research), Resilience Alliance, South African National Parks, the Water Research Commission (South Africa):Workshop39/2007.
DISCLAIMER
This report has not been reviewed by the Water Research Commission (WRC) nor has it approved for publication. The contents do not necessarily reflect the views
and policies of the WRC, nor does mention of trade names or commercial products constitute endorsement or recommendation for use.
Water Research Commission
Private Bag X03
Gezina
0031
Executive Summary
The international think tank, the Resilience Alliance in 2006 set up a workgroup to explore the effect that mental models held by different stakeholders and stakeholder groupings, might have on natural resource use and management, or in their more specific approach, on resilience of social-ecological systems. This study, conducted in South Africa, is intended to provide a relevant practical example on which to develop further understanding of mental models.
Mental models, put simply, are what people use to understand and interpret phenomena of everyday life. These models are frameworks of concepts and relationships that underpin how people understand, filter and process information and contribute to understanding, reasoning, prediction and action. These have been investigated across many fields and are of interest to natural resource management because of the need to understand stakeholders’ constructions (mental models) of how systems function. This provides the opportunity to present alternative options, assist building shared understanding amongst resource users and managers, and thereby support negotiation for change towards more sustainable resource management.
This report reflects an attempt to try to understanding issues of compliance with the water legislation by eliciting mental models which may underlie much of the intrinsic motivation of stakeholders to take particular collective actions, develop specific practices and ultimately behave in particular ways. Recent concern has been expressed that, in spite of world-acclaimed legislation such as the National Water Act 36 of 1998, the ecological condition of many South African rivers continues to deteriorate.
The Crocodile Catchment was chosen for this study as it is under the authority of the Inkomati Catchment Management Agency (ICMA), the first of 19 catchment management agencies to be established under the South African Water Act. It could also draw on the previous Kruger National Park Rivers Research Programme.
A multi-disciplinary team of researchers representing various biophysical and social sciences designed the process for testing the applicability and viability of two methods for eliciting and representing elements of mental models. These two methods, the Consensus Analysis method and the ARDI method, were tested with respect to their utility in identifying elements of mental models. Both methods were used to explore specific questions within the context of understanding whether differing views about the catchment would yield insight on non-compliance with environmental flows (the Ecological Reserve).
The Consensus Analysis method aims to understand the level of consensus among the different interviewees and stakeholder groups with respect to four key questions. The use of language as an indicator of understanding of content is central to the method’s depiction of the level of consensus within and between a particular group of stakeholders. In this method seventy six people were interviewed in two phases. The first phase interviews were with water users and managers across the catchments: the second phase focused on irrigators and ‘conservationists’ to see if these groups shared similar beliefs or knowledge about water use and management in the catchment. Challenges with this method included the logistics of conducting sufficient interviews across a broad geographic area in the time available. Although the Consensus Analysis method might provide a valuable orientation to
an additional analytical framework will be required to explore the nature and status of sustainable water resources management.
The ARDI method focuses on developing a schematic representation of individual or group understanding of key elements of the social ecological system. Ten individual mental models were elicited from water resource users and managers; the collective mental model process could not be completed in the time available. The ARDI assessment’s systems diagrams provide insight into sustainability through showing how stakeholders and resources interact. It also illuminates drivers of the system, as understood by different stakeholders and the way in which these stakeholders understand the system to function.
This research found that with respect to sustainability, the Reserve and compliance with the Reserve, both methods suggested that the Reserve is a concept that is not well understood: if people were familiar with the Reserve as a tool then more detailed understanding was often lacking or limited. In addition, both the CA and ARDI methods identified non-compliance as an important issue for stakeholders in the catchment. However additional work would be required to explore the actual nature and intent of the non compliance as this was beyond the scope of the current application of the two methods.
In many ways, CA could be seen as a screening technique to, for instance, define specific thematic areas that water management needs to address within the catchment. What is valuable is that both methods highlight the nature and extent to which stakeholders perceive problems relating to WRM in the catchment. This information is useful in engaging water managers and broader stakeholder groups in subsequent stages of collaborative work as it provides a basis from which to tackle problems.
This research found that with respect to the techniques for eliciting mental models, both methods accommodate high levels of representation and inclusivity and are therefore in accordance with participatory water resources management as required by the NWA. They both generate a sense of involvement and ‘buy-in’ in that they draw information and engagement from a broad spectrum of stakeholders. The demands of the methods for time and funds need to be carefully considered. Issues of resources and finances need to be factored into the broad application of the techniques so as to derive a clear picture of the costs and benefits.
As far as application of mental models in the South African catchment management context, clearly in the multiple-stakeholder arena called for by IWRM under the NWA it would be valuable to employ tools that set out to understand how, why and where differences in conceptual understanding, language use, meaning and practices might arise. It may be useful to identify a process that would contribute to the development of CMS and that built on the results of this work. We identified four processes that could contribute to the development of sustainable CMS, including
1. Stakeholder analysis to identify major stakeholder groups and power relationships using social network analysis. . This could be followed by Consensus Analysis of key questions and actions related to the social, economic and ecological sustainability of water use.
2. Participatory modelling to explore action, outcome relationships using ARDI-like techniques to identify pathways to sustainability and a broadly acceptable vision. 3. Monitoring and learning to support progress to goals through techniques such as:
Bayesian Belief Network (BBN) modelling to support ongoing monitoring and evaluation of key factors nad progress towards goals
Table of Contents
A PRELIMI ARY EXPLORATIO OF TWO APPROACHES FOR DOCUME TI G ‘ME TAL MODELS’ HELD BY STAKEHOLDERS I THE CROCODILE CATCHME T, SOUTH AFRICA ... I ACK OWLEDGEME TS... II EXECUTIVE SUMMARY... I TABLE OF CO TE TS...III LIST OF FIGURES...IV LIST OF TABLES...IV LIST OF ABBREVIATIONS...IV 1. BACKGROU D... 5 2. ME TAL MODELS ... 6
2.1. INTRODUCTION TO MENTAL MODELS... 6
2.2. DEFINITION OF MENTAL MODELS... 7
2.3. DOCUMENTING MENTAL MODELS... 9
2.4. UNDERSTANDING MENTAL MODELS IN A NATURAL RESOURCE MANAGEMENT SETTING... 10
3. CHOICE OF STUDY SITE: THE CROCODILE CATCHME T OF THE I KOMATI CATCHME T MA AGEME T AGE CY ... 10
4. THE RESEARCH PROCESS A D METHODS ... 13
4.1. METHOD 1: CONSENSUS ANALYSIS... 14
4.1.1. Phase 1 of the Consensus Analysis method ... 15
4.1.2. Phase 2 of the Consensus Analysis method ... 17
4.1.3. Data and results ... 18
4.1.4. Summary of Consensus Analysis results... 34
4.2. METHOD 2:THE ARDI METHOD... 35
4.2.1. The ARDI method in the context of the Crocodile River Catchment ... 37
4.2.2. ARDI method results ... 38
4.2.3. Group representation ... 44
5. EVALUATIO OF THE METHODOLOGIES AGAI ST THE OBJECTIVES ... 45
5.1. GENERAL COMMENTS ON THE TWO METHODS... 45
5.2. UTILITY OF THE METHODS FOR WATER RESOURCES MANAGEMENT... 46
5.2.1. On sustainability and the Reserve ... 47
5.2.2. On non-compliance with the law... 49
5.2.3. On feasibility, representativeness and inclusivity ... 50
5.3. POTENTIAL APPLICATIONS FOR IWRM IN SOUTH AFRICA... 51
List of Figures
List of Tables
List of Abbreviations
BHNR Basic Human Needs Reserve
CMA Catchment Management Agency
CMC Catchment Management Committee
CMF Catchment Management Forum
CMS Catchment Management Strategy
DWAF Department of Water Affairs and Forestry
ER Ecological Reserve
ICM Integrated Catchment Management
IWRM Integrated Water Resources Management NGO Non-Governmental Organisation
NWA National Water Act (No. 36 of 1998) NWRS National Water Resource Strategy RDM Resource Directed Measures
SDC Source Directed Controls
WMA Water Management Area WMI Water Management Institution WRC Water Research Commission WUA Water User Association
1. Background
Over the past few years concerns have been expressed that the ecological condition of many South African rivers continues to deteriorate in spite of world-acclaimed legislation, such as the National Water Act 36 of 1998 (NWA). As an example of reaction to this concern, there is, at the time of writing of this report, a pilot program funded by the Water Research Commission, “The Shared Rivers Initiative” (WRC K6 1711 ), looking mainly at water use, management and governance practices, in an effort to improve this situation. Despite a sound conceptual environment (for example as emerged from the Kruger National Park Rivers Research Programme, (Breen 1977) and supportive legislation, transformation at the level of water resources management practice is proceeding slower than expected. Observers now often refer to an “implementation lag” with varying degrees of empathy or frustration. The current focus of implementation agencies is on identifying and influencing factors likely to lead to more effective and timely implementation of the NWA, which is based inter alia, on the principles of sustainability. A cardinal consequence of the lack of implementation is poor compliance with the principles enshrined in the NWA. It was in this immediate context that the notion of ‘mental models’ came under consideration; could the lack of compliance with the NWA be understood in relation to the different conceptualisations or mental models of water use and water resource dynamics held by different stakeholder groups? A mental model refers to the way people construct an understanding of their world, enabling them to think about concepts and processes, to map their relationship to these, and to anticipate or plan their responses.
The research presented in this report was an attempt to explore the utility of understanding mental models as an aid to understanding non-compliance. Where practices (collective or individual) lead to less sustainable outcomes or a violation of the law, we need to understand how and where these practices emanate if we hope to achieve change. By understanding how stakeholders perceive the systems within which they live and function we may be in a better position to present alternative options and thereby negotiate change. Facilitated techniques may benefit from taking stakeholder mental models into account when seeking to build a shared understanding between the many parties involved in the co-operative governance of water. In many ways water resource management can be seen, especially in a mainly semi-arid country like South Africa, as a pertinent microcosm of resource management in general. As a result, there may be wide interest in trying to understand stakeholders’ conceptions (mental models) of how a system functions and how resources that are part of these systems can best be managed. If such techniques are found to be useful, then their application across several sectors of resource management might prove useful. To our knowledge, this is one of the first explicit attempts to document mental models, albeit provisionally and in an exploratory manner, in any natural resource field in southern Africa.
In 2006 a mental models working group was established within the Resilience Alliance (http://www.resalliance.org) to explore the contributions that the mental models of different stakeholders and stakeholder groupings made to natural resource dynamics and the resilience of social-ecological systems. One of the authors of this report, Harry Biggs, who had been involved in sustainable river management work in South Africa,
was invited to join this group, and at an initial meeting held in Australia, had suggested that study in South Africa might provide a relevant practical example on which to develop further understanding of mental models. The fact that water management practices associated with the NWA are currently being developed and implemented at the time of this study made this opportunity all the more attractive and relevant. Furthermore, the development of multiple stakeholder water management bodies in the form of the Catchment Management Agencies (CMAs) increased the potential relevance of understanding of stakeholder mental models and their consequences for water management particularly relevant.
Mental models have a wider theoretical and applied audience, for instance, amongst cognitive psychologists (Johnson-Laird 1983), organizational theorists (Walsh and Ungson 1991), business management theorists (Axelrod 1976, Senge 1990), human decision making in high reliability systems (Endsley 1995), system dynamics modelling (Doyle and Ford 1998) and knowledge management (Davison and Blackman 2005). As such, understanding of mental models is also likely to be applicable in areas far outside of the natural resource use arena which constitutes the context for this particular study. This report will examine the concept of mental models, describe why the Crocodile River was chosen as a study site, and give a brief overview of catchment attributes. After that there is a short general introduction to methods, followed by more detailed sections on the two main methods used, the results obtained and a brief interpretation. Finally there is an overall discussion of what we learnt, and a section on potential practical ways forward.
2. Mental models
2.1.
Introduction to mental models
Very simplistically mental models are the internal representations of the world that people use to understand and interpret phenomena of everyday life. These models remain poorly understood as is their relationship to human behaviour. They may be conceived of as frameworks of concepts and relationships that underpin how people filter, process and store information, including their conceptualisations of the world or some elements of the world. They contribute to human reasoning, interpolation, prediction and action (Dearborn and Simon 1958, Kearney and Kaplan 1997, Endsley 1995).
An individual holds their own mental models of the world that are believed to be informed by social processes and the mental models of others with whom they interact as well as the experiences of the individual. Members of institutions, organizations and groups may co-construct mental models of specific topics or issues which lead to the development of specific understanding and practices that may be unique to that particular institution or group (Carley 1997, Kraiger and Wentzel 1997, Vennix 1999). In fact for a member of a group to function within the group requires that there is at least some shared constructs that make up the mental models of the constituent members (Klimoski and Mohammed 1994).
Across the social science disciplines there have been many attempts to explain the link between how people perceive the world and how this relates to and translates into understanding and action (see Wood, 2000, for a recent review). As a result there are a number of terms and concepts that are similar to mental models in trying to explain how people construct and react to their world , examples being: frames (Perri 6 2005), schema (Barlett 1932, after Garro 2000) and phenomenography (Marton 1994).
The foundations for the concept of mental models was laid in 1942 by Kenneth Craik who proposed that thought parallels reality through symbols that form a small scale model and so enables the mind to evaluate various alternatives and to predict what may happen based on previous experience. From Craik’s introduction, the term mental model languished until 1983 when two books were published (Johnson-Laird 1983, Gentner 1983) that laid further theoretical foundation for the mental models concept. Since then the term mental models has expanded rapidly across many fields, including management (Senge 1990, Hill and Levenhagen 1995), team performance (Stout et al 1999), knowledge management (Davison and Blackman 1995), risk (Bostrom et al 1994, Morgan et al 2001, Zaksek and Arvai 2004) and so may be described differently in these various settings.
2.2.
Definition of mental models
In its simplest form, a mental model is considered to be an internal representation of the world that supports understanding, reasoning and prediction and that drives action. For the purpose of this analysis we conceived mental models to comprise human representations of objects, their relationships and dynamics as well as the attributes or characteristics of these and the person’s valence (cognitive and emotional) to the objects, relationships and dynamics (Figure 1).
Figure 1. Schematic representation of the components of mental models used to guide this analysis.
Objects
Relationship
s
Behaviours
Valence
(
Characteristics
)
The emergence of a mental model is informed by concepts, knowledge, information and experiences that are ultimately mediated by language, values and the social world. A mental model, whether articulated or not, facilitates the process of making meaning. If ‘new’ information presents a problem for meanings that a person holds, the person may simply reinforce their held meanings or reconstruct new meaning. This new meaning might result in a new or adapted mental model. Such adaptation of the mental model is more likely if the new information fits with the existing mental model (Kearney and Kaplan 1997). If adjustment is not possible then the information may be ignored or reinterpreted (Kearney and Kaplan 1997, Jamieson 2006). If people lack detailed knowledge of a specific phenomenon then they create meaning by applying concepts drawn from their understanding of other similar phenomena (Kempton 1997).
A mental model is never complete but represents only part of a complex situation (Vennix 1999) It may contain incorrect information and conflicting beliefs or it may hold several inconsistent models within the same domain (Read et al. 1994). Unless incorrect information is discredited and displaced, incorrect models may often persist – possibly even along side the more accurate ones (Kempton 1997, Gentner 2002).
When individuals function in a group, institution or organization they might share a mental model of a particular aspect of their reality. This means that they are part of the process of forming a collective mental model. Collective mental models can take various forms:
• A shared mental model is the extent to which a group of individuals share a similar representation of a phenomenon or situation and allows for multiple levels or sets of shared knowledge (Langan-Fox et al 2001).
• A team mental model refers to the collective understanding in a team and so refers to the overall degree of similarity between the mental models of individual team members (Klimoski and Mohammed 1994).
• A cultural mental model refers to the extent that people in a society share a culture which encapsulates the experiences of past generations and provides for the intergenerational transfer of unifying perceptions. It enables a member of that society to organize their experiences and be able to communicate with others about them and provides shared explanations for phenomena outside of the immediate experience of the members of the society in the form of religions, myths and dogmas (Denzau and North 1993).
The amount of ‘sharedness’ in shared mental models varies in several ways: the uniformity of sharing or the relationship between perceptions of the individual and the team; degree of sharing or how widely the perceptions must be shared; and the awareness of sharing of whether team members are aware of the shared perceptions (Carley 1997).
A high degree of overlap between mental models may increase the ability to communicate with others. In areas where collaboration, negotiation and interaction between different groups are required articulating mental models, may help to:
• broaden the definition and understanding of a problem through comparing the mental models of resource users and managers
• stimulate and facilitate communication and learning amongst resource users and managers.
We recognise however that overlap is not always beneficial; when seeking solutions to novel problems it may well be useful to have a diversity of mental models from which novel solutions may emerge.
2.3.
Documenting mental models
How easy, or not, it is to elicit and represent a mental model is the subject of some discussion in the literature. As a cognitive phenomenon, a mental model exists only in the mind and Doyle and Ford (1998) warn researchers about confusing elicited or mapped representations of a mental model with the mental model itself. Following the work of Argyris and Schon (1978), it is suggested by Carley (1997) that some researchers consider a mental model employs tacit knowledge or ‘model in use’ and what is obtained (for example, when prompted by a researcher) is an ‘elicited model’: others believe that a mental model is an emergent structure that only crystallizes as it is articulated by the individual. What ever form this cognition process takes, as researchers we are dealing with what is presented by the individual which is mediated by social processes.
Eliciting mental models generally involves one or more of three methods (Carley and Palmquist, 1992): content analysis, concept mapping, or procedural analysis with methods such as scenario development emerging more recently. These different methods can be used either singly or in combination and either with individuals or groups.
The most commonly used method is content analysis which takes the language expressed by an individual and uses it to create a ‘map’ of concepts and ideas. The individual is usually prompted through oral (open ended or semi-structured interviews) or written (questionnaires or examination of documents) tools or even a combination of both (e.g. Bostrom et al 1994). The mental models are then often represented through a cognitive map such as an influence diagram (e.g. Atman et al 1994, Morgan et al 2001). Development of these cognitive maps allows comparison and so can be used to compare the mental models of different individuals or groups and over time. Similarly concept mapping is a technique for visualising relationships among concepts that is attributed to the work of Novak (Novak and Canas 2008).
Another common method used to elicit mental models is procedural mapping which prompts a person to ‘think aloud’ as they work through a given task and describe implicit and explicit procedures (Carley and Palmquist 1992, Niewhohner et al 2004). This approach focuses on the sequence of task-related decisions and does not reveal knowledge around a topic and so may require a further probe into individuals’ understanding (e.g. Niewohner et al 2004).
Emerging methods for elicitation include the use of scenarios to elicit understanding of concepts. In using this method the researcher presents the subject with a detailed description of a phenomena and asks them to explain it in their own words, or to be more predictive and describe ‘what happens next’ (e.g. Stoll-Kleemann et al 2001, Sterman and Booth Sweeney 2007).
2.4.
Understanding mental models in a natural resource
management setting
Although the concept is often used in relation to natural resources management (NRM), research that addresses mental models and their relationships to human decision making, behaviour or learning are rare. Where research has been conducted it documents elements of mental models (Abel et al. 1998, Pahl-Wostl 2002, Hare and Pahl-Wostl, 2002) whilst speculating on the managerial or decision making importance (Kolkman et al. 2005).
Understandings of the mental models of different groups may be important where: • Conflicts exist or are emerging between stakeholder groups and understanding
among those groups of the conceptualisations of each group could be used to identify evidence to resolve the bases of the different conceptualisations;
• We seek to understand the complex relationships between people and ecosystems from a cognitive perspective;
• Society seeks to define desirable futures and plausible paths to achieve these; • We need to document the knowledge of specific groups in society;
• We seek to understand how specific processes give rise to or limit social learning. • A group seeks solutions to complex problems.
3. Choice of study site: the Crocodile Catchment of the
Inkomati Catchment Management Agency
Under the South African Water Act, 19 Water Management Areas (WMAs) have been established and the planned devolution of responsibility to 19 catchment management agencies has begun. The Inkomati Catchment Management Agency (ICMA) was the first one in the country to be declared and, at the time of this study in 2007, had been in existence for approximately one year. The original idea of choosing the Crocodile Catchment (see Figure 2) within the Inkomati WMA stemmed from the advanced deployment of the National Water Act described above, and also to the possibility of assimilating existing knowledge from the Kruger National Park (KNP) Rivers Research Programme into the research process.
The KNP programme had studied five major rivers crossing the Park: the Luvuvhu (a tributary of the Limpopo); the Olifants and its major tributary in the lowveld of South Africa, the Letaba; the Sabie; and the Crocodile. The last two rivers make up part of the Inkomati WMA. The most intensively studied river in the Kruger National Park Rivers Research Programme is the Sabie (O’Keeffe and Rogers 2003) and its major tributary the Sand. However, the Sabie is itself relatively pristine and free of the major
contentions in other rivers, while its Sand subcatchment is quite the opposite, but has been very well studied, particularly in the Save the Sand Programme (Pollard et al, 1998). The Olifants-Letaba-Luvuvhu systems have well-described problems and attributes of their own (O’Keeffe and Rogers 2003) but their Catchment Management Agencies are not established as for the Inkomati WMA. That left the clear choice of the Crocodile for this study: in this catchment the successful implementation of the National Water Act is likely to be challenged by issues of over allocation, poor compliance and weak long term planning for sustainability.
Figure 2: Map of the Crocodile River within the Inkomati Water Management Area As the first CMA to be established the Inkomatii CMA is being delegated and assigned new responsibilities and powers. This is an ongoing process of transformation, with the Department of Water Affairs and Forestry (the previous management authority) acting as interim transitional authority. This process is important in understanding how sampling for interviews and discussion groups took place which is described in section 4. The summary of the attributes of the Crocodile River, which forms the remainder of this section 3, is taken from Mphuti (unpublished data) who has recently collated a variety of descriptive sources.
The Crocodile River drains a catchment of about 10 400 km2, with a total main-stem length of approximately 320 km. It forms the southern boundary of Kruger National Park, and is the largest tributary of the Komati River. The catchment is characterised by varied topography and exceptional biodiversity. It has high mean annual precipitation (1600mm pa) in the mountainous western headwater zone, far lower in the lowveld but with high mean potential evaporation (1600mm), causing low flows in the dry season. The stream flow is further reduced by afforestation, which covers 177 455 ha in the upper catchment.
The gross surface water resource (Table 1) is derived mostly from run-of-river flows but is augmented by the Kwena Dam and other smaller dams, which supplement the run-of-river abstractions during periods of low flow. There is uncertainty surrounding the estimated impact of invasive alien plants due to some unknown factors such as how much area infested, the species of alien invasive plant, the location (riparian/non- riparian) and a lack of knowledge relating to how much water alien plant species actually use.
Table 1: Estimated water availability in the Crocodile sub-catchment for 2003 at 1:50 year assurance (DWAF 2004). Gross surface water resource is water recorded as surface runoff in river flows. Transfers ‘in’ refers to water transferred from the Lomati catchment.
Resource category Available/impact
(million m3/annum)
Gross surface water resource: 364
Subtract:
- Ecological Reserve 105
- Invasive alien plants 57
Net surface water resource 202
Ground water 8
Return flows 42
Total local yield 252
Transfer in 12
Grand Total 264
Table 2: Estimated local water requirements in the Crocodile sub-area for the year 2003 at a 1:50 year assurance (DWAF 2004). Transfer ‘out’ refers to water for Mozambique
User sector Water requirement/
Impact on yield (million m3/annum)
Irrigation 257
Forestry 42
Urban 35
Industrial and mining 23
Rural 7
Total requirements 364
Transfer out 49
Grand Total 413
The water demand in this catchment is high due to the irrigation (particularly sugarcane) and forestry activities. Heath and Claassen (1999) reported the following land uses (and hence associated water uses) in the catchment: the irrigated area spans 95 000 ha; afforested area covers 172 200 ha; dry land agriculture takes up a space of 290 000 ha and there are 45.9 people per square kilometre.
From Table 1 and 2 it is clear that the there exists a potential negative water balance in the catchment due to the high water demand exhibited by irrigation. The Crocodile River
Catchment has the highest negative water balance (-149 Mm3/a) in the Inkomati WMA.
It is estimated that this water balance will reach -169 Mm3/a by the year 2025. The current water balance in Crocodile River Catchment is currently met, but that will change when operating rules that require implementation of the Reserve and meeting the international obligations of water for Mozambique as reflected in treaties and agreements.
4. The research process and methods
A multi-disciplinary team of researchers representing various biophysical and social sciences designed the process for testing the applicability and viability of two methods for eliciting and representing elements of mental models, namely: (i) the Consensus Analysis Method (CA) and (ii) the ARDI Method. Although the methods are different they were both applied to specific questions within the context of understanding whether differing views about the catchment would yield insight on non-compliance with environmental flows (the Ecological Reserve). As there was no possibility of obtaining data on actual compliance with the provisions of the Water Act it was not possible to formally test the relationships between different views and compliance. The process was expected to facilitate the qualitative exploration and provisional evaluation of the potential of using these methods in understanding mental models of stakeholders in a complex and contested arena. The two methods were used to elicit and represent elements of mental models from a diversity of stakeholder groups. By articulating these elements of stakeholder mental models both methods sought to identify stakeholders’ shared and diverging viewpoints on environmental flows and non-compliance with the Ecological Reserve (the Ecological Reserve is the quantitative and qualitative articulation of an environmental flow regime for a specific river as required in terms of the NWA). The Consensus Analysis Method aimed to understand the level of consensus among the different interviewees and stakeholder groups with respect to four key questions (described in Section 4.1). The use of language as an indicator of understanding of content is central to the method’s depiction of the level of consensus within and between a particular group of stakeholders.
The ARDI method focuses on developing a schematic representation or concept map of individual or group understanding of four key elements (described later in Section 4.2) of the system under discussion (in this case the Crocodile River).
Before the testing of the two methods took place, the research team met with several key senior DWAF personnel in Pretoria. This was partly to brief them about the ideas of the team, but also to seek advice and their opinions of the potential of such work. (Note that at the completion of the fieldwork several of these officials attended the feedback sessions that took part in the Kruger National Park and Pretoria shortly after completion of the field work. We capture their inputs under the general discussion – Section 5 of this report.)
The selection of individuals for participation in either of the two methods was guided by the categories of representation on the Inkomati CMA, which include:
• Commercial agriculture
• Existing agriculture by historically disadvantaged individuals
• Potential agricultural water use by historically disadvantaged individuals • Stream flow reduction activity /forestry industry
• Tourism and recreation • Organised conservation
• Productive use of water by the poor
• Civil society - resource protection / sustainable development • Local Government - Integrated Planning
• Local Government - Water Services Authority
• Local Government - Traditional Leaders / Authorities • Mpumalanga Provincial Government
• Limpopo Provincial Government
• Independent non-executive - integrated water resources management
Representatives from all relevant (those operative/resident in the Crocodile River Catchment) water-user groups were invited by the team to participate in the research. Given the large number of representative groups on the CMA and the time available to the research team, there was an inevitable focusing on certain groups.
An eight member research team tested the two methods over a 10-day period. The two methods ran in parallel and engaged a total of 95 individuals: 76 took part in the Consensus Analysis process and 19 in the ARDI process Individuals from various stakeholder groups were invited to participate in one of the two methods (as determined by identity/representation and logistical arrangement). The representativeness and sample size of the sampling was constrained by a) the diversity of stakeholder groups who were located across a large geographic area; and b) the complications arising from running two different methods in parallel at the same time (see discussion in Section 5.1).
Each of the two methods and their results are described in the following sections. Thereafter we present a general discussion and evaluation of the methods.
4.1.
Method 1: Consensus Analysis
Consensus Analysis is a research technique developed in cognitive anthropology. It rests on the assumption that culture – comprised of systems of mental constructions (i.e. mental models1) or knowledge that individuals use to interpret and respond to the world of experience (Handwerker 1998) – is learned and consequently shared. This extent of sharing varies, and consensus analysis allows investigation of the content and distribution (or sharing) of words, concepts, information and knowledge among
1
Consensus analysis does not use the term ‘mental models’ but uses concepts that are similar including cultural or knowledge domains which are “organized set of words, concepts, or sentences, all at the same level of contrast, that jointly refer to a single conceptual sphere” (Weller and Romney, 1988).
individuals. Essentially the following questions form part of the analytical framework for Consensus Analysis:
• Is there a shared mental model?
• Of what does it comprise (issues, themes)?
• Is there significant disagreement? Are there competing understandings/visions? • If there is a shared mental model, how are different aspects of it interpreted and
used among different stakeholders?
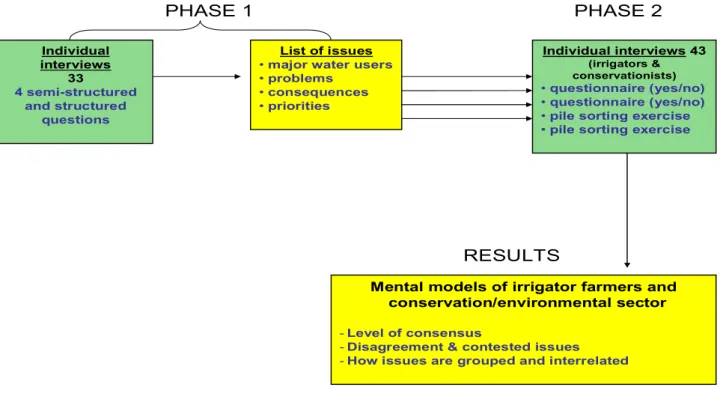
Consensus analysis typically involves two (or more) phases of fieldwork and data analysis. The phases we carried out for this work are summarised in Figure 3. The first phase generates the lists of issues with which an independent sample of interviewees works in gaining further specific insights in the second phase.
Figure 3. Phases and individual steps in the consensus analysis. The first phase generates a list of issues for each of the specific questions being addressed. Phase 2 takes as inputs these issues and using either questionnaires or pile sorts generates the data that is then analysed.
4.1.1. Phase 1 of the Consensus Analysis method
In the first phase, we conducted interviews with 33 individuals. These individuals were identified through purposive and ‘snowball’ sampling methods. They were affiliated with
List of issues • major water users • problems • consequences • priorities Individual interviews 33 4 semi-structured and structured questions PHASE 1
Mental models of irrigator farmers and conservation/environmental sector
- Level of consensus
- Disagreement & contested issues - How issues are grouped and interrelated
RESULTS Individual interviews 43 (irrigators & conservationists) • questionnaire (yes/no) • questionnaire (yes/no) • pile sorting exercise • pile sorting exercise
a diversity of organisations and social groups, including: DWAF regional, Inkomati CMA,
SANParks, Irrigation Boards, Mpumalanga Tourism and Parks Agency Working for Water
Project (DWAF), Global Forest Products Pty Ltd., consultants, and emergent farmers. The interview instrument consisted of 12 questions on water resource use and management in the Crocodile Catchment. The interviews were audio-recorded with the interviewee’s permission. For the consensus analysis work, we focused on four of these questions. Each question looked at different domain of knowledge regarding water use and management in the catchment:
• major users of water
• causes of problems with current flows • consequences of the river not flowing • priorities for future water use.
For the first domain of knowledge – water users – we used a freelisting technique (Weller and Romney 1988). Each of the 33 people interviewed were asked:
• Who are the major users of water in the Crocodile Catchment?
The remaining three sub-themes required a more open-ended technique, and we asked: • What is causing the problems with current flows in the Crocodile River?
• What are the consequences of the river not flowing? • What should be the priorities for future water-use?
Themes emerging from the interviewee responses were coded and for each question, we kept a separate running list of codes, creating new codes when new themes emerged. To eliminate conceptual redundancies, the same codes were used for similar themes or issues. This coding process allowed the answers given in narrative form to be listed in one word or a short phrase. Freelists were generated for all four questions. Next, these freelists were analysed with Anthropac software (Borgatti 1992). Freelisting makes two assumptions: (1) people tend to list things that they are most familiar with or believe are most important before they list things that are less familiar or less important, and (2) people who know a lot about a subject will list more things than people who know less (therefore, they will have longer freelists) (Quinlan 2005).
Analysis of freelists in Anthropac generates four pieces of information: • frequency (the number of separate items listed)
• response percentage (the percentage of interviewees who mentioned each item) • rank (the aggregate average rank for each item)
• salience (a measure based on the frequency and rank of each item; it indicates how much knowledge informants share and how important that knowledge is to them, (Smith 1993). “It is essentially a weighted average of the (inverse) rank of an item across multiple freelists, where each list is weighted by the number of items in the list” (Borgatti 1992).
4.1.2. Phase 2 of the Consensus Analysis method
Phase 2 of our work drew on the information generated from the analysis of the freelists collected in Phase 1. A total of 43 people who had not participated in the first phase were selected, also using purposive and ‘snowball’ sampling. We decided to focus on irrigators (16 interviewees) and ‘conservationists’ (27 interviewees) as we were interested in knowing if these very different groups shared beliefs or knowledge about water use and management in the Crocodile Catchment. The people we interviewed were members of Irrigation Boards/Water User Associations, the Department of Agriculture and Land Administration (including Directorate of Environmental Affairs), Ecolink (a local environmental NGO) and SANParks. Separate interviews were carried out with each person. They were asked to complete a yes/no questionnaire followed by two pile sorting exercises.
Questionnaire: The questionnaire consisted of two sections, one focused on ‘major water users’ and the other on ‘causes of problems with current flows’ as generated from Phase 1. Items that had been mentioned more than once were selected for the questionnaire (for results of the analysis of the freelists, see Tables 1 and 2. Interviewees were first asked to respond to the question ‘of the following list of water users in the Crocodile River Catchment, which are major water users?’ They had to check ‘yes’ if they thought a particular water user listed was a major user of water and ‘no’ if they thought otherwise. They repeated the exercise with the question ‘Do these things contribute to problems with current flows in the Crocodile River?’
Pile sorts: After the completion of the questionnaire, each interviewee was asked to participate in two pile sorting exercises, one focused on ‘consequences of the Crocodile not flowing’ and the other on ‘priorities for future water use’. For the pile sorting exercises, the top consequences (those mentioned at least twice) generated from the freelist analysis were written on separate index cards. A separate set of cards was generated for the priorities for future water use that were mentioned at least twice. Thus, two sets of cards were developed. For each set of cards, every card had an identification number written on the back of it. Each time, the cards were thoroughly shuffled before being presented to an interviewee to eliminate the possibility of bias. Interviewees were first asked to pile sort the ‘consequences of the Crocodile River not flowing’. They were given the stack of cards, each containing a single word or phrase, into groups or piles on the basis of similarity. They were instructed that there was no right or wrong way to sort the cards and that they could make as many piles as they wanted, but a minimum of two. After the pile sorting exercise was completed, interviewees were asked to explain what the consequences in each pile represented. We wrote this information down as well as the numbers on the back of each card for each pile that had been created. We repeated the exercise for the cards of priorities, but this time constrained them to exactly three piles: priorities that are highly important, of medium importance, and of low importance
Analysis of questionnaire and pile sort data: Using Anthropac, the results of the questionnaire and pile sorting exercises were converted to aggregate proximity matrices (a measure of how often particular items appeared together) and analysed with three
methods: (1) consensus analysis (a module in Anthropac), (2) non-metric multidimensional scaling (MDS), and (3) cluster analysis.
The consensus analysis module allows one to determine statistically whether there is sufficient agreement among the persons interviewed to suggest that they hold a shared vision, or mental model, regarding a particular issue. MDS and cluster analysis allows one to visualize (see, for example, Figure ) the degree to which people share words, concepts, information or knowledge. These analyses are not restricted to comparing peoples’ inputs; they can also be used to see the similarities and differences among the items pile sorted or in the questionnaire (e.g. major waters users, problems, consequences, priorities). In the map produced by MDS, people who are in closer agreement appear closer together; people who have different understanding, or mental models, on the issue appear farther apart. This also applies to items – the more similar in meaning (in the minds of those interviewed) two items are, the closer together they are on the MDS map, and vice versa. Cluster analysis (Johnson’s hierarchical clustering module in Anthropac) is another visual technique that is often used in combination with MDS. Instead of mapping people or items on a 2-dimensional (or 3-dimensional, if shown to reduce the stress score) map, cluster analysis produces a schematic diagram of clusters of people (or items) in accordance to their similarity. Cluster analysis is often used to interpret the groupings of people or items in the MDS map.
4.1.3. Data and results
Theme 1: Water users
Analysis of the freelists (Phase 1)
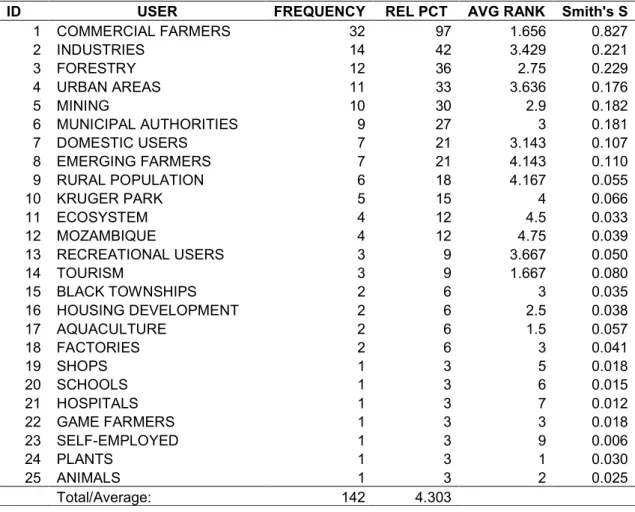
From the first round interviews with 34 people, a wide and diverse range of water users were identified. Table 3 provides a summary of interviewees’ perceptions of who are the major water users in the Crocodile Catchment. The information presented in the table was produced by Anthropac. It shows that interviewees listed 25 different water users which ranged from diverse social (human) groups to plants and animals.
The most frequently cited water user was ‘commercial farmers’, who were mentioned by 97 percent (i.e. 32) of the interviewees. Commercial farmers also were perceived as the most salient water users – i. e. interviewees listed them near the top of the list, perceiving them as the ‘most important’ water users or water users with which they were the most familiar.
Table 3. Results of analysis of freelists of “major users of water” showing frequency with which interviewees identified users, the relative percentage of interviewees who identified that user, the average ranking of that user and the and salience (Smith’s S) of the user. (N=34).
ID USER FREQUENCY REL PCT AVG RANK Smith's S
1 COMMERCIAL FARMERS 32 97 1.656 0.827 2 INDUSTRIES 14 42 3.429 0.221 3 FORESTRY 12 36 2.75 0.229 4 URBAN AREAS 11 33 3.636 0.176 5 MINING 10 30 2.9 0.182 6 MUNICIPAL AUTHORITIES 9 27 3 0.181 7 DOMESTIC USERS 7 21 3.143 0.107 8 EMERGING FARMERS 7 21 4.143 0.110 9 RURAL POPULATION 6 18 4.167 0.055 10 KRUGER PARK 5 15 4 0.066 11 ECOSYSTEM 4 12 4.5 0.033 12 MOZAMBIQUE 4 12 4.75 0.039 13 RECREATIONAL USERS 3 9 3.667 0.050 14 TOURISM 3 9 1.667 0.080 15 BLACK TOWNSHIPS 2 6 3 0.035 16 HOUSING DEVELOPMENT 2 6 2.5 0.038 17 AQUACULTURE 2 6 1.5 0.057 18 FACTORIES 2 6 3 0.041 19 SHOPS 1 3 5 0.018 20 SCHOOLS 1 3 6 0.015 21 HOSPITALS 1 3 7 0.012 22 GAME FARMERS 1 3 3 0.018 23 SELF-EMPLOYED 1 3 9 0.006 24 PLANTS 1 3 1 0.030 25 ANIMALS 1 3 2 0.025 Total/Average: 142 4.303
Analysis of the questionnaire (Phase 2)
The responses to the yes/no questionnaire on major water users filled out by 43 people (16 irrigators and 27 ‘conservationists’) were analysed in Anthropac with the three methods outlined above: (1) consensus analysis, (2) MDS (Figure 4), and (3) cluster analysis. Each of these methods enabled us to assess whether or not there was agreement among irrigators and conservationists, as a whole group and as separate groups, regarding who were the major water users in the Crocodile Catchment. The results of the three analyses indicate that it was not possible to draw any conclusive results regarding whether or not there was consensus (among irrigators and conservationists) regarding the major water users, perhaps because the sample was too
small.2 Conservationists and irrigators did not appear to have different conceptions of the major users (Figure 5).
Figure 4. Three dimension plot of the similarities among respondents with respect to their identification of major users of the Crocodile. Plot is the result of Multi-Dimensional-Scaling of similarities. Stress=0.1213.
Although there were similarities among users based on their similarity scores the patterns were not clear; urban and rural groups emerge as a cluster as do environment, international obligations and tourism. However the agricultural and mining / industry sectors were not grouped as closely as one might imagine.
2
The respondent reliability coefficients were below the 0.90 recommended threshold (0.789 for the group as a whole, 0.770 for conservationists, and -0.096 for irrigators) indicating that the results are not stable and would likely not be the same as those obtained in repeated sampling (Romney et al., 1986). This statistical problem may have arisen as a result of an insufficient number of interviews for the freelisting exercise (phase 1). Alternatively, distorted coding, which can occur particularly with complex concepts such as “causes of problems with current flows” and “priorities for future water use”, can also account for data analysis problems.
3
The stress score reflects the degree to which the MDS model represents the data. The lower the score the better the representation. Borgatti 1992 suggests scores of <0.1 are excellent and scores >0.2 are unacceptable.
Figure 5. Three dimension plot of the similarities among major users of the Crocodile as identified by respondents. Plot is the result of Multi-Dimensional-Scaling of similarities. Stress=0.082.
Theme 2: Problems with current flows
Analysis of the freelists (Phase 1)
A total of 33 factors responsible for the problems with the current flows in the Crocodile River were mentioned (Table 4). Of these, the most frequently mentioned was ‘illegal use of water’, mentioned by 32 percent (10 people) of the 43 people interviewed. This was closely followed by low rainfall (25 percent), forest plantations (22 percent), commercial agriculture (22 percent), and Kwena dam (19 percent). If the frequency of times Kwena dam was mentioned was combined with the frequency of mentions of dams in general (16 percent), then dams were mentioned the most frequently (35 percent). However, although dams were most frequently mentioned, they were not perceived as the most important or salient cause of problems with current flows.
Analysis of the questionnaire (Phase 2)
A consensus analysis, MDS, and clustering analysis of the yes/no responses to the question ‘what are the causes of the problems with current flows in the Crocodile River?’ revealed that irrigators and conservationists as groups were not in agreement (see Figure 6; stress score = 0.093) about the underlying factors causing the problems with
the current flows in the Crocodile River.4 There was also no discernable pattern in the similarities of causes (Figure 7).
Figure 6. Three dimension plot of the similarities among respondents with respect to their identification of the causes of problems with current flows in the Crocodile River. Plot is the result of Multi-Dimensional-Scaling of similarities. Stress=0.093.
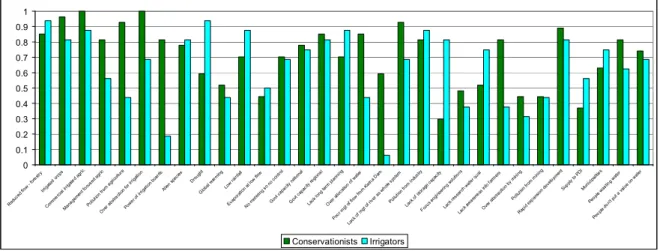
Irrigators and conservationists were in agreement in their identification of some causes but notably disagreed in the identification of others. Stark differences in the frequency with which conservationists and irrigators identified causes due to agriculture as being important were evident with conservationists more likely to see agriculture and irrigators as important problems than were irrigators (Figure 8). Irrigators identified supply side constraints (climate and storage capacity) with a greater frequency thank did conservationists. Conservationists identified management issues (poor management from the Kwina Dam, over allocation and management focused on agriculture) with a greater frequency than did irrigators.
4
The overall group had less than the 2.1:1 ratio between the first and second eigenvalues, and an average knowledge score (shared knowledge of factors causing the problems) of 0.436 or approximately 44% (respondent reliability =0.912). The results for irrigators were inconclusive because of the low respondent reliability coefficient (0.523). The reliability coefficient for conservationists was on the borderline (0.883). As a subgroup, conservationists had an average knowledge score below 0.50 (=0.461) and an almost as high average variability (0.448) suggesting, arguably, that there was no consensus among conservationists regarding the causes of the problems with current flows.
Figure 7. Three dimension plot of the similarities among causes of problems with current flows in the Crocodile River. Plot is the result of Multi-Dimensional-Scaling of similarities. Stress=0.
0 0.1 0.2 0.3 0.4 0.5 0.6 0.7 0.8 0.9 1 Red uced flow - for estr y Irriga ted crops Com merc ial i rrigate d agr ic Mana gem ent focus ed agr ic Pollution from agric ultur e Over abs tract ion for ir riga tion Pow er of ir rigat ion boar ds Alien spec ies Drough t Global war ming Low rainfal l Evapo ratio n at low flow No m eter ing so no cont rol Gov t cap acity nationa l Govt c apa city regi ona l Lac k lon g te rm p lanni ng Over allo cat ion of wat er Poo r m gt o f flow from Kw ina D am Lac k of m gt of r iver as whol e sy stem Pol lutio n from ind ustry Lack of s torag e capa city Focus eng ineer ing sol utions Lac k resea rch w ater qual Lac k awar enes s inf o far mer s Over abst raction by m ining Pol lution from mini ng Rapi d ex pan sion dev elopm ent Suppl y to PD I Muni cipal ities Peo ple w astin g w ater Peo ple don' t put a va lue on w ater Conservationists Irrigators
Figure 8. Frequency with which irrigators and conservationists identified each cause of current problems with Crocodile River flows as being important.
Table 4. Results of analysis of freelists: frequency and salience (Smith’s S) of ‘causes of the problems with current flows in the Crocodile River’. (N=34).
ID
CAUSE OF PROBLEMS
WITH FLOW FREQUENCY RESP PCT AVG RANK Smith's S
1 ILLEGAL USE 10 31 2.3 0.26 2 LOW RAINFALL 8 25 1.375 0.233 3 FORESTRY 7 22 2.143 0.137 4 COMMERCIAL AGRICULTURE 7 22 2.857 0.125 5 OVER ALLOCATION 7 22 3 0.146 6 KWINA DAM 6 19 2.167 0.153 7 DAMS 5 16 4.2 0.084 8 DEVELOPMENT 5 16 2.6 0.102 9 DROUGHT 5 16 2.4 0.12 10 URBAN AREAS 4 13 4 0.031 11 MANAGEMENT FOCUS 3 9 2 0.069 12 REGIONAL CAPACITY 3 9 5.333 0.039 13 GLOBAL WARMING 3 9 2.333 0.049 14 POLLUTION 3 9 3.667 0.051 15 NATIONAL CAPACITY 3 9 4.333 0.051 16 URBAN GROWTH 3 9 3.333 0.053 17 ALIEN SPECIES 2 6 1 0.063 18 INAPPROPRIATE CROPS 2 6 5.5 0.028 19 MINING POLLUTION 2 6 1 0.063 20 EVAPORATION 2 6 4.5 0.029 21 NO METERING 2 6 2.5 0.038 22 AGRIC POLLUTION 2 6 1.5 0.055 23 WASTAGE OF WATER 2 6 5 0.015 24 AWARENESS 2 6 3.5 0.018
25 LONG TERM PLANNING 2 6 2.5 0.050
26 RESEARCH 1 3 3 0.010 27 OVER ABSTRACTION 1 3 1 0.031 28 IRRIGATION BOARDS 1 3 4 0.021 29 WATER PRICING 1 3 8 0.007 30 ENGINEERING 1 3 6 0.009 31 INDUSTRIAL POLLUTION 1 3 2 0.021 32 GARDEN 1 3 6 0.009 33 PDI SUPPLY 1 3 5 0.006 Total/Average: 108 3.375
Theme 3: Consequences of the river not flowing
Analysis of the freelists (Phase I)
A total of 34 different negative impacts were mentioned in response to the question ‘what are the consequences of the Crocodile river not flowing?’ The consequences mentioned covered a broad range of ecological, social, and economic impacts. The impact on biodiversity was mentioned most frequently, by 30 percent of the people
interviewed (see Table 5). It was also perceived as the most salient or important of consequences. This was followed by impact on whole economy (24 percent); on animals (18 percent), and on Mozambicans (18 percent).
Table 5. Results of analysis of freelists: frequency and salience (Smith’s S) of ‘consequences of the Crocodile river not flowing?’ (N=34)
ID
CONSEQUENCES OF CROCODILE NOT
FLOWING FREQUENCY RESP PCT AVG RANK Smith's S
1 BIODIVERSITY 10 30 1.4 0.261 2 WHOLE ECONOMY 8 24 2.625 0.138 3 ANIMALS 6 18 2.333 0.128 4 MOZAMBICANS 6 18 2.167 0.101 5 TOURISM 5 15 3.8 0.075 6 DOMESTIC USERS 5 15 3 0.093 7 EVERYONE 5 15 4.4 0.050 8 ECOSYSTEM 5 15 1.8 0.120 9 FISH 4 12 1.75 0.091 10 DOWNSTREAM 4 12 1.25 0.106 11 COMMERCIAL FARMERS 4 12 4.25 0.060 12 RURAL POPULATION 4 12 3.25 0.061 13 PLANTS 4 12 2.5 0.068 14 LESS WATER 3 9 1 0.091 15 UNEMPLOYMENT 3 9 1.667 0.077 16 KRUGER PARK 3 9 4.333 0.047 17 LESS AGRICULTURE 3 9 2 0.073 18 INDUSTRIES 2 6 1 0.061 19 RIVER 2 6 2 0.040 20 SEDIMENTS 2 6 3.5 0.032 21 INTERNATIONAL 2 6 2.5 0.038 22 DEATH 2 6 1 0.061 23 SOCIAL INSTABILITY 2 6 2.5 0.038 24 WATER RESTRICTIONS 1 3 2 0.027 25 MIGRATION 1 3 3 0.015 26 GROUNDWATER 1 3 6 0.009 27 DAMS 1 3 1 0.030 28 MORALE 1 3 4 0.012 29 EROSION 1 3 3 0.015 30 COMMERCIAL FARMING 1 3 4 0.017 31 LOCAL GOV 1 3 5 0.013 32 PROVINCIAL GOV 1 3 6 0.009 33 INDUSTRY 1 3 7 0.004 34 SANPARKS 1 3 1 0.030 Total/Average: 105 3.182
Analysis of pile sorts (Phase 2)
The 43 people who did the pile sorts of the consequences if the Crocodile River stopped flowing generally agreed on (i.e. had high commonality in the measured elements of their mental models) the consequences of the lack of flow in the river. However the results of the consensus analysis indicated the consensus was not very strong. On average, individual people were in agreement with 65 percent5 of the elements of the common or group beliefs as to the consequences of flow in the Crocodile River stopping. The MDS map of the 43 people who participated in the pile sorting exercise of the consequences of the Crocodile River not flowing (Figure ) suggests reasonable agreement among irrigators and conservationists as to the consequences of the river not flowing. There was a group of irrigators and conservationists who shared, more or less, a mental model of the consequences (the cluster in the middle of the MDS map in Figure 9).
Figure 9. Three dimensional plot of the similarities among conservationists and irrigators as to their perceptions of the consequences of the Crocodile River not flowing. Plot is the result of Multi-Dimensional-Scaling of similarities. Stress=0.132.
The consequences of the Crocodile not flowing were also clearly separable into social, economic and ecological categories (Figure 10).
5
We also ran MDS and cluster analysis on conservationists and irrigators separately. We found that there was a weak agreement, or mental model, among conservationists (Figure 2, stress score = 0.128).6 Most of the conservationists interviewed generally agreed with each other with the exception of two individuals (indicated by numbers 24 and 27 in the MDS map, Figure 217) who had different perspectives from the rest of the group regarding what would happen if the river stopped flowing. Irrigators also seemed to be in consensus regarding the consequences (Figure 32, stress score = 0.122)
Figure 10. Three dimensional plot of the similarities among consequences of the Crocodile River not flowing. Plot is the result of Multi-Dimensional-Scaling of similarities. Stress=0.061.
6
Respondent reliability coefficient = 0.935; average knowledge score = 0.594 and average variability = 0.395. The ratio of first to second Eigen values of 2.9:1 indicates that there is “weak agreement” (Caulkins 2004).
7
.
Figure 21. Two-dimensional Multidimensional scaling (MDS) representation of conservationists according to similarity of pile sorting consequences if the Crocodile River stops flowing.
We also wanted to know if people had pile sorted the consequences into similar piles.
¡Error! No se encuentra el origen de la referencia.2 shows the MDS representation
of the pile sorts of consequences in two dimensions (stress score = 0.100). The consequences circled are those that were found to be grouped together in the cluster analysis (Figure 5). Looking at the horizontal (or x-axis) of the MDS map from left to right, it appears that the consequences clustered on the left side are ecological impacts and, on the right side, socio-economic impacts are grouped together. The vertical or y-axis suggests that the cluster of socio-economic consequences is further broken down into social impacts (top right hand corner) to more economic impacts (bottom left hand corner). There also appears to be a distinction between international social impacts and those that will occur at the catchment level.
Two items – ‘less water to us’ and ‘everyone impacted’ – did not group well within the social category. Compared to the other consequences which were very specific, both of these are very broad and potentially vague terms, which may have been open to different interpretations during the pile sorting exercise. Comments from interviewees after the pile sorting exercise about their reasons for piling consequences indicates that people break consequences into these types of categories.
Similar findings were found for irrigators and conservationists separately.8 In other words, both groups generally pile sorted consequences into ecological and subcategories
8
of socio-economic impacts. The only difference between the two was that irrigators ended to not see ‘negative impacts on tourism’ as an economic impact but as separate.
Figure 32. Multidimensional scaling (MDS) representation of irrigators according to similarity of pile sorting consequences if the Crocodile River stops flowing