Inequality and Riots - Experimental Evidence
30
0
0
Texte intégral
(2) CIRANO Le CIRANO est un organisme sans but lucratif constitué en vertu de la Loi des compagnies du Québec. Le financement de son infrastructure et de ses activités de recherche provient des cotisations de ses organisations-membres, d’une subvention d’infrastructure du Ministère du Développement économique et régional et de la Recherche, de même que des subventions et mandats obtenus par ses équipes de recherche. CIRANO is a private non-profit organization incorporated under the Québec Companies Act. Its infrastructure and research activities are funded through fees paid by member organizations, an infrastructure grant from the Ministère du Développement économique et régional et de la Recherche, and grants and research mandates obtained by its research teams. Les partenaires du CIRANO Partenaire majeur Ministère du Développement économique, de l’Innovation et de l’Exportation Partenaires corporatifs Banque de développement du Canada Banque du Canada Banque Laurentienne du Canada Banque Nationale du Canada Banque Royale du Canada Banque Scotia Bell Canada BMO Groupe financier Caisse de dépôt et placement du Québec Fédération des caisses Desjardins du Québec Financière Sun Life, Québec Gaz Métro Hydro-Québec Industrie Canada Investissements PSP Ministère des Finances du Québec Power Corporation du Canada Raymond Chabot Grant Thornton Rio Tinto State Street Global Advisors Transat A.T. Ville de Montréal Partenaires universitaires École Polytechnique de Montréal HEC Montréal McGill University Université Concordia Université de Montréal Université de Sherbrooke Université du Québec Université du Québec à Montréal Université Laval Le CIRANO collabore avec de nombreux centres et chaires de recherche universitaires dont on peut consulter la liste sur son site web. Les cahiers de la série scientifique (CS) visent à rendre accessibles des résultats de recherche effectuée au CIRANO afin de susciter échanges et commentaires. Ces cahiers sont écrits dans le style des publications scientifiques. Les idées et les opinions émises sont sous l’unique responsabilité des auteurs et ne représentent pas nécessairement les positions du CIRANO ou de ses partenaires. This paper presents research carried out at CIRANO and aims at encouraging discussion and comment. The observations and viewpoints expressed are the sole responsibility of the authors. They do not necessarily represent positions of CIRANO or its partners.. ISSN 1198-8177. Partenaire financier.
(3) Inequality and Riots – Experimental Evidence * Klaus Abbink†, David Masclet‡, Daniel Mirza§. Résumé / Abstract Nous étudions dans cet article la relation entre inégalité et conflits inter-groupes. L’approche mobilisée est l’économie expérimentale. Le jeu expérimental est un jeu en deux étapes. Dans une première étape, les participants jouent un « rent seeking » proportionnel afin de se partager un prix. Les inégalités sont modélisées de sorte que certains agents (les joueurs de type A, favorisés) reçoivent davantage du prix pour un même montant investi que d’autres joueurs (les joueurs de type D, défavorisés). En deuxième étape, les joueurs de chaque type peuvent se coordonner afin de réduire le gain des membres de l’autre groupe. Nous observons que les conflits diminuent avec le degré d’inégalité entre les groupes. Ces résultats semblent s’expliquer par des préférences compétitives fortes et des effets de résignation. Mots clés : Design d’expérience, économie expérimentale, inégalités sociales, conflits.. We study the relationship between inequality and inter-groups conflicts (riots), focussing on social inequality. Disadvantaged societal groups experience discrimination and thus have limited access to some social and labour resources like education or employment. First, we experimentally investigate whether social inequality is a driving force of inter-group conflicts. Second, we investigate the factors that make preferences for riot translate into actions. Riots require coordination. Our experiment consists of a two-stage game. First, subjects play a proportional rent-seeking game to share a prize. Social inequality is modelled exogenously by attributing to some subjects (the advantaged group) a larger share of the price than other subjects (the disadvantaged group) for the same amount of effort. In a second stage players can coordinate with the other members of their group to reduce (“burn”) the other group members’ payoff. Treatments differ in the degree of social inequality set between the two groups. We observe frequent social conflicts, where, as expected, disadvantaged groups riot more than advantaged groups. Surprisingly, the frequency of riots decreases with the degree of inequality. A control treatment allows us to identify resignation as the driving force behind this phenomenon. Keywords: Design of experiments, Experimental economics, Social Inequality, Conflicts. Codes JEL : D72, C91. *. We wish to thank Elven for programming the experiment. We are grateful to seminar participants in Caen, Paris, Pasadena and Prague for helpful comments and suggestions. Financial support from the Agence Nationale de Recherche (ANR) through the project “GTCI Guerre, terrorisme et commerce international” is gratefully acknowledged. † CREED, Universiteit van Amsterdam, Faculteit Economie en Bedrijfskunde (FEB); Roetersstraat 11 , 1018 WB Amsterdam, The Netherlands; Tel: +31 20 525 4229. Email: [email protected]. ‡ CREM (CNRS – Université de Rennes 1), 7, place Hoche, 35065 Rennes, France. Tel : +33 223 23 33 18. Email: [email protected]. § Université François Rabelais de Tours, 50, avenue Jean Portalis, 37000 Tours, France. Tel: +33 2 47 36 10 76. Email: [email protected]..
(4) Introduction When a wave of violence swept through the suburbs of French cities in 2004, the nation was desperate for answers. How could it happen that, in a civilised and highly developed society youths all over the country indulged in raw violence? And why did it happen then? Many observers pointed at long-standing problems in the suburbs, which are mainly populated by second generation immigrants from northern Africa. These youths faced a bleak future with no perspective of integration into the regular job market. Tensions arising from discrimination and inequality then erupted into violence and widespread rioting. The link between inequality and violent rebellion is almost a universal assumption, from ancient philosophers to modern economists and political scientists.1 In the words of Gurr (1970), “the intuition behind this positive relationship is that “both poverty (“absolute deprivation” theory) and high levels of inequalities (“relative deprivation”) would lead the disadvantaged people, when they have nothing to lose, to express their emotion and achieve redistributive demands when it is possible by resorting to civil violence”. While these theories seem immediately plausible, they do not explain spontaneous outbreaks of revolt alone. In the French example, it is widely accepted that the youths in suburban ghettos are socially and economically disadvantaged. Yet this has been so for decades and the situation has not noticeably deteriorated prior to the riots. So if inequalities caused the riots, why has it been quiet for so long? How could the unrest suddenly emerge out of the blue? To answer these questions one has to look at the strategic environment. While many disadvantaged people may have a preference for unrest, turning this urge into action is another matter. A single rioter will not gain much satisfaction from his endeavour. In all likelihood he will be arrested and that is the end of the game. Only if the rioters reach a critical mass, they stand a chance against the authorities. The crucial factor lies in the beliefs that a rioter has about the actions of like-minded individuals. When a frustrated youth believes that sufficiently many other frustrated youths will turn to the streets, then it becomes the best response for him to join. If, however, he believes that most others will stay at home, then he better stays calm himself. These decisions have to be made almost simultaneously; sluggish build-ups would leave the opposition time to react. In game-theoretic language, the riot game has two extreme equilibria: One in which nobody riots and one in which all potential rioters do. With this strategic situation in mind, it becomes clear that if there is a relationship between inequality and riots, it must work in an indirect way: Not only must disadvantaged individuals develop a level of frustration that makes them want to take destructive action, but also they must form a believe that sufficiently many others will take action at the same time. Due to the two extreme equilibria of this game it is not surprising anymore that, although. 1. See Cramer (2005) for the lineage of this idea from Aristotle and Plato through Montaigne and de Tocqueville to today‟s academic debate..
(5) frustration may build up slowly over years, outbreak of violence happens extremely fast and seemingly out of nowhere.2 Preferences may change slowly, but beliefs about others‟ behaviour can flip almost instantly. The two-equilibria structure of the riot game makes it extremely difficult to assess causes of violent unrest empirically. There is a natural element of unpredictability as to when and where precisely the beliefs of potential rioters will flip over and trigger the riot equilibrium.3 Further, with this strategic environment in mind, it is no longer clear that more inequality will necessarily lead to a higher propensity for riots to break out. As Collier and Hoeffler (1996) argue, a “greater inequality significantly reduces the risk and duration of war”. The reason is that a high degree of inequality may induce more resources necessary for repression for the advantaged group possesses. In other words, strongly disadvantaged people may want more badly to rebel, but find it harder to do. This may in turn make it harder for the beliefs about other people‟s behaviour to flip towards the rebellious equilibrium. While the idea of a relationship between inequality and conflict is appealing, conclusive empirical proof of its existence has been elusive. Indeed there is no clear relationship in the data between inequality and violent conflicts. Some have found positive relationships between income inequality and political violence (Muller and Seligson, 1987; Midlarsky, 1988; Brockett, 1992; Binswanger, Deininger and Feder, 1993 and Schock,1996). Others have found no such relationship (Weede, 1981; Collier, Hoeffler and Soderbom, 2004). This is partly because it is hard to clearly disentangle economic inequality as a reason for conflict from other factors such as cultural, ethnic or religious differences or political contexts. Moreover, efforts to test this assumption have frequently been made by “working backward”, starting with cases where civil violence occurred and investigating factors that seem to have contributed to the outcome. This neglects cases where similar factors were present but violence did not occur. These are, of course, hard to identify as they often just look like normality. In this paper we analyse the relationship between inequality and riots in a novel way. We first set up a game theoretic model of a situation with two groups of individuals. One of the groups is disadvantaged and has less ability to gain a share of the total income. In a second stage individuals can revolt against the income distribution. We find two extreme equilibria for each group: one in which nobody riots and one in which all of the members‟ coordinate to riot. The structure of the game with multiple equilibria at the second stage makes the game. 2. The trigger for the French riots was the accidental electrocution of two immigrant youths. It was claimed that these teenagers died while they were chased by the police, a charge the authorities denied. Tragic as this case was, it would usually not be sufficient as a cause of a rebellion of that scale. However, it certainly served as a coordination device. 3. The unpredictability is further exacerbated by the strategic interaction between rioters and the authorities. If it were known in advance when and where unrest would break out, the police could take pre-emptive action. This interaction is not the focus of our study, thus we do not model it here. See Abbink and Pezzini (2005) for experimental data on the relationship between repression and revolt.. 1.
(6) theoretic prediction indeterminate, leaving it to empirical analysis to identify links between inequality and rioting. We provide such empirical data by conducting a controlled laboratory experiment using our game theoretic model. Evidence based on experimental analysis has the advantage of a controlled environment (e.g. the political, social and religious context), defining a priori the reference group, rather than having to infer it from survey data, and of avoiding any possible role for contextual effects. Finally, in contrast to survey studies, our analysis relies on actual and costly decisions instead of subjective reported behaviour . Two sets of questions are addressed in this paper: First, under what conditions, if any, will inequality lead the disadvantaged group to “burn” resources of the advantaged group through conflict?4 Our study mainly focuses on the role of distributional concerns assuming that people care about the distribution of payoffs and that individuals may accept to sacrifice a part of their money to reduce differences in payoffs between themselves and others (Loewenstein, Thompson, and Bazerman, 1989; Fehr and Schmidt, 1999; Bolton and Ockenfels, 2000; Falk, Fehr and Fischbacher, 2005). In this paper we investigate the relationship between inequality and conflicts in a situation that prevent agents from using conflicts as a means to obtain a better relative situation in terms of social inequality and/or to punish bad intentions. In other words, initial inequality is exogenously determined and riot cannot affect the current inequality level between the haves and the have-nots.5 Subjects have no strategic gains (expectation of higher income in the future) from using conflicts. Second, we investigate to what extent preferences for riot translate into actions.6 In fact like all collective actions, civil conflicts and riot require coordination. Several variables affecting the strength of conflict organisations, such as leadership, coalitions, solidarity, and other factors may play also an important role in conflict. Since these effects are typically interconnected, it is hard to isolate a single one, in the field. In our experiment, we can overcome this difficulty by changing only the variable in question, keeping everything else equal. In particular, we model a coordination game in which the homogenous group members have to choose simultaneously to “burn” the payoffs of the members of the other group. A decision to burn taken by each member is always costly but the cost incurred varies negatively with the number of members who riot. A riot is successful if the number of rioters exceeds a 4. Three main motives could explain why people would rebel against inequality. First, conflicts may illustrate the desire to obtain a better absolute and/or relative situation and thus ensure a higher income in the future (strategic motive). A second motive is related to negative emotions, such as anger that may be induced by inequality. It relies on the idea that people may perceive inequality as intentional and would react to unfair intentions by sacrificing a part of their payoffs in order to punish others, even when there are no reputation gains from doing so (Rabin (1993); Charness and Rabin (2002); Bowles and Gintis (2004); Falk and Fischbacher (2006)). Third, individuals with distributional concerns who suffer from disadvantageous inequality may be willing to coordinate in order to reduce earnings inequality, if the cost they bear is smaller than the impact of sanctions on the target's payoff (Fehr and Schmidt (1999); Bolton and Ockenfels (2000); Falk, Fehr and Fischbacher (2005)). Hence, as economic inequality increases, the probability of conflict should increase. 5 Note that for realistic purposes initial exogenous inequality may be reinforced by subjects‟ actions, i.e. by their own investment decisions in the rent seeking game. This situation is quite realistic. Imagine for example a situation where agents receive initial endowments in terms of capacity and have to decide to invest in education to compete to gain resources, e.g. access to good jobs. 6 For an empirical analysis of the preferences for revolt using survey data see MacCulloch and Pezzini (2007).. 2.
(7) critical threshold. In the opposite, a riot does not occur and potential rioters incur a maximal cost for this action. Other factors like those mentioned above are deliberately excluded. In this paper, we focus on rebellious actions carried out solely to do harm to the other group. Arguably, rioters like the frustrated youths in France neither had much immediate benefit to expect from their deeds, nor could they seriously hope to overturn the government and take power. Thus the situation is different from classic revolutionary action, which is driven by the aim to reach a political goal. Orthodox economic theory has long denied humans the desire to harm others without own benefit, but recent behavioural findings suggest that such a tendency does exist.7 Zizzo and Oswald (2001) design a game where subjects can reduce (burn) other subject‟s money at own costs. Despite the cost of burning money decisions, the majority of subjects choose to destroy some part of others‟ money. Subjects do so mainly to reduce inequalities: Most burners burnt richer subjects more than poorer ones. Abbink and Sadrieh (2008) go one step further and remove even this motive from their game. In their experiment, two players can simultaneously destroy each other‟s endowment, but have no conventional reason to do so. In a first treatment called full information, players are informed about their partner's decision. In a second treatment, players cannot exactly identify the partner's action because a part of endowment can also be randomly destructed by Nature. The authors observe that up to 40% of subjects are willing to burn money, in particular in the second treatment where agents can hide their action and assume impunity. 8 Our study brings several important innovations to these previous experiments. First, we focus here on collective money burning decisions rather than individual burning decisions. Riots constitute good examples of such collective money burning decisions. Second, we investigate in more detail to what extent an increase in inequality may have a negative impact on the propensity for rioting. The issue of destructive riots has, to our knowledge, not been previously studied experimentally. Even the more general experimental literature on political conflict is surprisingly sparse. A few experiments on political systems focus on the emergence of regimes in a model in which citizens can devote their efforts to production or appropriation (Durham, Hirshleifer, and Smith (1998), Carter and Anderton (2001), Duffy and Kim (2004), Lacomba, Lagos, Reuben, and van Winden (2008)). Others (Abbink and Pezzini (2005), Cason and Mui (2006)) study revolting behaviour in a dictatorship, or examine independence 7. Even behavioural economists traditionally focus on situations in which humans are nicer than orthodox theory suggests, i.e. altruistic, fairness-driven, or reciprocal. The dark side of economic behaviour is only sparsely studied. 8. Our study is also related to previous literature on costly punishment. Indeed several experiments inspired by Fehr and Gächter's (2000) have shown that individuals do not hesitate to punish free-riders in a public good game even if it is costly (Anderson and Putterman (2006), Carpenter (2007), Carpenter, Matthews and Ong'ong'a (2004), Egas and Riedl, (2005), Fehr and Gächter (2002), Masclet, Noussair, Tucker and Villeval (2003), Nikiforakis and Normann (2008), Nikiforakis, Normann and Wallace (2008), Bochet, Page, and Putterman (2006), Masclet and Villeval (2008)).. 3.
(8) conflicts (Abbink and Brandts (2009)). With the conflict model we use our study is also related to the literature on rent-seeking games (Millner and Pratt (1989), Potters, de Vries, and van Winden (1998), Weimann, Yang, and Vogt (2000), Anderson and Stafford (2003), Herrmann and Orzen (2008), Abbink, Brandts, Herrmann, and Orzen (2009)). To anticipate our results, we first find that, despite the cost of rioting, a substantial number of players choose to destroy the other group's money. These decisions to burn money strongly depend on expectations about decisions of others that are generally based on previous experience. Furthermore as one might expect, when disadvantaged and advantaged groups clash the disadvantaged initiate significantly more conflicts than the advantaged groups. Surprisingly however, we find that rioting decreases with stronger inequality. Two behavioural explanations suggest themselves for this counterintuitive result. First, in the repeated play disadvantaged individuals may fear counterattacks from the better-endowed opponents. Second, they may resign and accommodate with their unfavourable situation. We run a control treatment with strangers matching, which makes direct counterattacks impossible and thus removes the dynamic aspect from the environment. Nevertheless, the frequency of riots remains virtually unchanged. Thus, we can ascribe the effect to resignation on the side of the disadvantaged individuals. The remainder is organised as follows. In section 2, we describe our game. Section 3 presents our experimental design. Section 4 provides theoretical predictions. In section 5, the experimental results are presented and discussed. A last section concludes and presents a discussion of our main results.. 2. The game We model the riot game as a game in two stages. Players are divided into two groups called group A and group D. The first stage consists of a proportional rent-seeking game in which both players A and players D compete (by purchasing tickets) to share a prize P. This stage models the competition to gain resources, e.g. access to education and good jobs. The share of the prize received by each participant equals the proportion of her tickets relative to those of the entire group (including all players A and players D). This stage also endogenously induces the inequality of income we want to model. Group D, the disadvantaged group, has a much harder time to gain its share of the cake, as their lottery tickets have a much lower winning power than those bought by individuals of group A. This is modelled by varying the costs ci per ticket, which is higher for individuals of group D. Denoting by xi the number of tickets individual i buys, the individual‟s share si of the prize is then. 4.
(9) xi c si n i . xj. c j 1. j. With the rent-seeking game in the first stage we wanted to capture two important features of the real-life competition for jobs and income. First, we wished to induce inequality of chances rather than induce income inequality directly. All members of society are involved in a competition in which they can gain resources. Members of the disadvantaged groups also can gain, though their chances are worse than those of the advantaged group. At the second stage of the game the two groups can engage in destructive rioting. This is modelled as a coordination game in which the members of the group can simultaneously choose to take action in order to reduce the payoffs of the members of the other group. If the number of group members who choose to riot reaches or exceeds a critical threshold m, then each member of the other groups receives a payoff reduction. The own incentives to riot follow the structure of a mass coordination game. If fewer than m group members riot, then rioters bear a higher cost than non-rioters, a feature that captures sanctions from the authorities. If m or more group members riot, then it actually pays off to join the riot, which reflects the ostracism that inactive group members receive from their fellow group members. Note that a “successful” riot entails no material benefit to the rioters; it is still paretodominated by the peaceful outcome. The exact payoffs are given in section 3.. 3. The experimental design 3.1. The parameterisation of the game At the beginning of the experiment, each participant is randomly assigned a role of player A (Advantaged) or player D (Disadvantaged). They keep this role during the entire experiment. Further, 3 A-type and 3 D-type players are randomly matched to form a group of 6. Each player keeps her role during the entire experiment. There are six treatments in the experiment, all of which have a first and a second stage of interaction in common. Our main research question involves the relationship between inequality and riot. Thus, we vary the level of inequality across the three treatments of our experiment. As a control treatment we conduct sessions with a symmetrical setup (called sym treatment), in which both groups are identical. The cost parameter for both groups is therefore ci=1. We then run two experimental treatments in which we vary the cost parameter ci, making it increasingly harder for the disadvantaged group to compete. We have sessions with ci = 4 and ci = 8 in the asymmetric treatments (called asym4 and asym8 treatments, respectively). The cost parameter for the advantaged group is always ci = 1. In all experiment the prize to be won was set to P = 576.. 5.
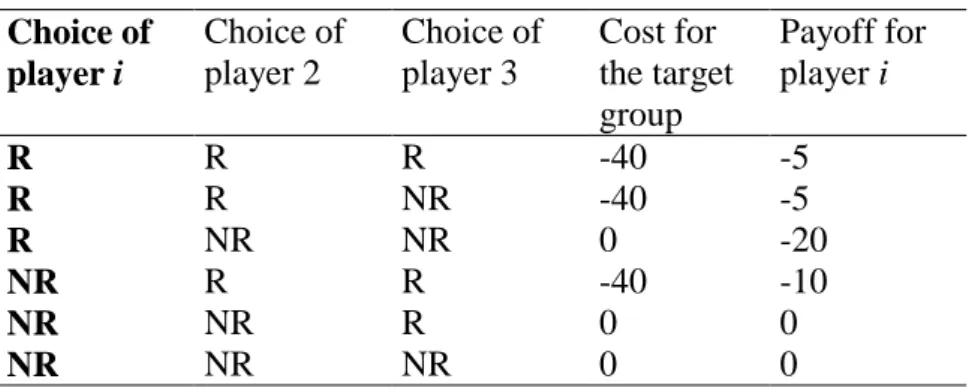
(10) At the first stage of the game players can invest any amount between 0 and 80 tokens. By restricting the strategy space we made sure that the equilibrium predictions are the same for the asymmetric treatments. The interior equilibrium lies outside the feasible range a corner solution applies. Advantaged players choose the maximum feasible investment, disadvantaged players choose zero (see next section). In the first experiment all sessions were run using a partner protocol; i.e. the composition of the groups remains the same throughout the experiment. In a second experiment, which we set up to separate two competing explanations for the results we obtained, we use a stranger protocol in which the groups are randomly rematched in every round. Precisely memberships are fixed within each 3-players group but each disadvantaged group is paired with a different advantaged group in every round. This treatment will be described in section 5. In the second stage of the experiment subjects decide whether or not to burn money of the other group. A riot is successful if at least two of the three group members participate. The payoff are chosen in a way that it is always preferable for an individual player to swim with the tide, i.e. to riot if the other group members riot and to abstain if the others do. The cost of being the only rioter is chosen to be greater than the cost of being the only absentee. Thus, we assume that the consequences of being caught (e.g. fines or arrest) are more severe than those of abstaining from a successful riot, which are mainly loss of face before an individual‟s peers. The following table shows the payoffs for the combinations of choices in the second stage subgame. These payoffs are simply added to the earnings obtained in the first stage of the game.. Table 1. Second stage actions and payoffs Choice of player i. Choice of player 2. Choice of player 3. R R R NR NR NR. R R NR R NR NR. R NR NR R R NR. Cost for the target group -40 -40 0 -40 0 0. Payoff for player i -5 -5 -20 -10 0 0. Notes : a) R=Riot action and NR= No Riot action b) the table reads as follows: line 2, if player i chooses to Riot (R ), player 2 chooses to Riot too (R) while player 3 does not riot (NR), a majority is willing to riot. Riot takes place and the cost of the other group is reduced by -40. Player i incurres a minimal cost of -5.. 6.
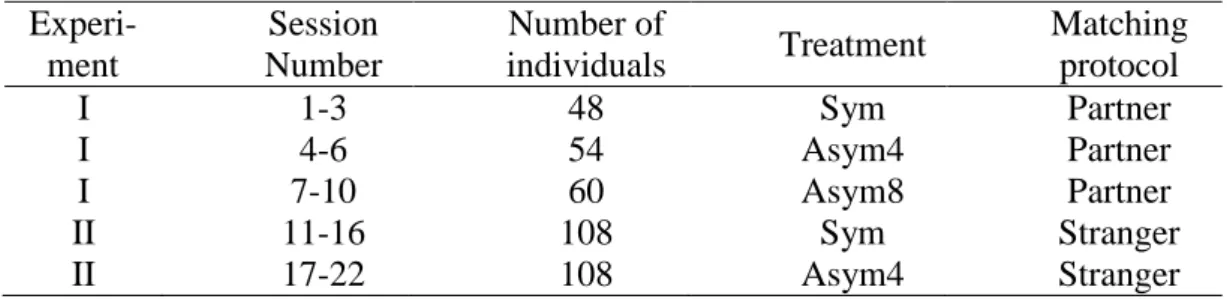
(11) 3.2. The conduct of the experiment The experiment consisted of 23 sessions of 20 periods each. Experimental sessions were conducted at the University of Rennes I, France. 378 subjects were recruited from undergraduate classes in business, art, science and economics. None of the subjects had previously participated in a similar experiment and none of them participated in more than one session. The experiment was computerised using the Ztree software. Some information about the sessions is given in table 2. In the first column, experiment I comprises of the original data, experiment II the new sessions added to test hypotheses to explain the data. The next three columns indicate the session number, the number of subjects that took part in the session and the treatment in use in the session. The matching protocol column indicates whether a partner or a stranger matching was in effect during the 20 periods. At the beginning of the experiment, players are assigned to groups of size six that consists of 3 A-type and 3 D-type players. Subjects were not told who of the other participants were in the same group, but they knew that the composition of the groups did not change. The subjects were visually separated from one another in order to ensure that they could not influence each other‟s behaviour other than via their decisions in the game. Table 2. Characteristics of the First Experiment Experiment I I I II II. Session Number 1-3 4-6 7-10 11-16 17-22. Number of individuals 48 54 60 108 108. Treatment Sym Asym4 Asym8 Sym Asym4. Matching protocol Partner Partner Partner Stranger Stranger. Each session began with an introductory talk. A research assistant read aloud the written instructions (reproduced in appendix for the asym4 treatment). The language used in the instructions was neutral, i.e. we avoided references to the riot context. By this we wanted to focus participants on the incentives given in the game, and avoid that possibly strong opinions on the French experience could guide their choices.9 The total earnings of a subject from participating in this experiment were equal to the sum of all the profits he made during the experiment. On average, a session lasted about an hour and 20 minutes including initial instructions and payment of subjects. At the end of the experiment, subjects were paid their total earnings anonymously in cash, at a conversion rate of one euro for 328 talers. Subjects earned on average €12. At the time of the experiment, the exchange rate to other major currencies was approximately US-$1.20, £0.70, ¥140 and RMB10.5 for one euro. 9. Evidence for the effects of instruction framing has been very mixed so far (Baldry, 1986; Alm, McClelland, and Schulze,1992; Burnham, McCabe, and Smith,2000; Abbink and Henning-Schmidt, 2006; Abbink and Brandts, 2009).. 7.
(12) 4. Game theoretic predictions The two-stage game can be solved by backward induction. It is easy to see that the second stage game, as mentioned earlier, has four pure strategy equilibria, two for each group. In one equilibrium nobody riots, in the other one everybody. This is independent from the decisions made in the other group, as all players decide simultaneously. Thus, every combination of one equilibrium in one group with an equilibrium in the other group is an equilibrium of the second stage game. For the first stage equilibrium we first look at the rent-seeking game in isolation. Identifying the equilibrium of the first stage, and subsequently the subgame perfect equilibrium of the whole game, is technically more involved. The symmetric case is straightforward: The equilibrium is the solution of the standard rent-seeking game (the fact that players receive shares rather than winning probabilities does not change equilibrium predictions). The equilibrium investment can is given by xi* x * . (n 1) P. ( n) 2. Where n stands for the total number of players by group (i.e. 6 players in our experiment). This yields an equilibrium investment of 80, which is the maximum amount allowed.10 In the asymmetric cases the heterogeneity of the players from the different groups needs to be taken into account. We derive the first order conditions for the optimal investment, given the investment of the other players, as. ci ( p 1) P.ci (n 1) x 1 j c j j c j * i. c (n 1) ci (n 1) 1 i P c n c n. with c . c. j. n. In the asymmetric treatments this would imply equilibrium investments of 128 and 86.9 for the advantaged players, and –64 and –51.4 for the disadvantaged players, for ci = 4 and ci = 8 respectively. Since these investments lie outside the feasible range of 0 to 80 we have an identical corner equilibrium for all three asymmetric treatments. The advantaged players. 10. Previous rent-seeking experiments have shown investments that are systematically above equilibrium levels. This possibility is excluded through our imposed restriction of the strategy space. In this study we are not interested in the behavioural properties of the rent-seeking game, but we rather use the game as a device to induce inequality of opportunities to study their effect on behaviour at the second stage. For that, it is actually desirable if subjects predictably reach the upper bound of the range, as it improves the comparability of observations.. 8.
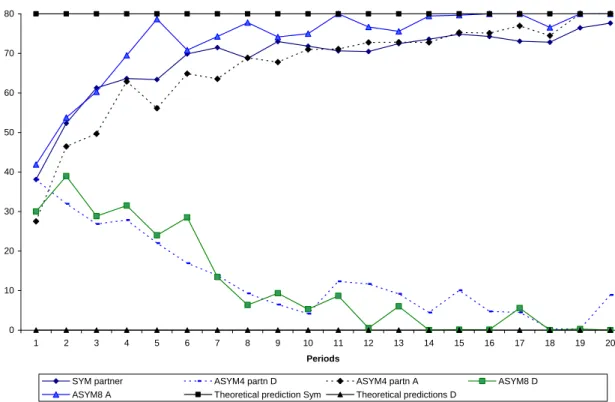
(13) invest the maximum allowed, the disadvantaged invest nothing. So only the advantaged players receive a share of the prize (an amount of 192) in equilibrium. Note that although the equilibrium prediction is identical, the treatments may behaviourally very well differ. The game as a whole has multiple equilibria. If, for example, the disadvantaged group selects the riot equilibrium in response to the first stage equilibrium, but the no-riot equilibrium for some neighbouring first stage outcome, then the advantaged players would choose different investments at the first stage. However, the one in which all players choose the first-stage best responses is very persistent. In particular, the disadvantaged group cannot use equilibrium selection as a threat to secure a positive share of the pie by forcing the advantaged players to invest less. This is because the equilibrium in which the three advantaged players choose (80,80,80) for all second stage response patterns except those that are characterised by: “Riot against (80,80,80) but do not riot against (80,80,y)”, where y < 80. If such an equilibrium response pattern is selected, then it can be a best response for an individual to deviate from a choice of 80 and invest y instead. The individual‟s unilateral deviation then avoids the riot and this can lead to a higher profit for the individual. However, the smallest number y that can be used as a threat is 38, even lower values make it preferable for the individual to stick to an investment of 80 despite the riot. Against an investment of the advantaged group of (80,80,38), however, a disadvantaged player‟s best response is still to invest zero. Note that the threat must be chosen in a way that only one player is forced to reduce his investment, otherwise an advantaged group investment of (80,80,80) remains a subgame perfect equilibrium pattern. In such a case an individual reduction of the investment would not avoid the riot but only reduce the deviator‟s payoff.11. 5. Experimental results We follow our research agenda and first present the data from the original setup with partners matching. Sessions with a strangers protocol were added later to test two competing hypotheses against one another. We will introduce them in section 5.2.2. 5.1. Average level of effort and first stage profit in the rent seeking game The first stage of the game was designed to implement inequality between the groups. The rent-seeking game is designed such that, in equilibrium, advantaged players would invest the maximum allowed of 80 and disadvantaged players the minimum of zero. In the symmetric treatment all players are predicted to invest the maximum of 80. Note that we chose a set-up in which we expected that this would be the outcome likely to occur in the experiment, and therefore cut off the strategy space. Figure 1 shows that, at least over time, this expectation. 11. These deliberations turned out to be empirically irrelevant, as in the experiment the focal equilibrium investment was reached very quickly (see next section).. 9.
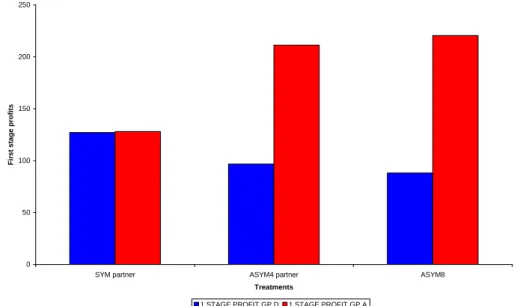
(14) was correct. The figure illustrates the average individual effort in the rent seeking game by period, and shows that investments quickly converge to the predicted outcome. Turning next to first-stage profits, Figure 2 shows the average first-stage payoff by group for each treatment. The first stage payoffs for advantaged groups under a partner matching protocol are 211.28 and 214.98 for the asym4 and asym8 treatments, respectively. Payoffs are significantly lower for disadvantaged groups, 96.73 and 90.62 for the asym4 and asym8 respectively. A Wilcoxon test comparing first stage payoffs between groups, maintaining the conservative assumption that each group‟s activity over the session is a unit of observation, indicates no significant difference between first-stage payoffs for groups A and D in the sym treatment (z =-0.70, p=0.488; two tailed). In contrast a similar test shows that advantaged groups receive higher payoffs than the disadvantaged groups in the asym4 treatment (z=2.66,p<0.01; two tailed).12 Similar results are found for the asym8 treatment (z=2.803,p<0.001; two tailed).. Figure 1. Number of tickets bought in each treatment over time 80. 70. Average number of tickets. 60. 50. 40. 30. 20. 10. 0 1. 2. 3. 4. 5. 6. 7. 8. 9. 10. 11. 12. 13. 14. 15. 16. 17. 18. 19. 20. Periods SYM partner ASYM8 A. ASYM4 partn D Theoretical prediction Sym. ASYM4 partn A Theoretical predictions D. ASYM8 D. Thus, we indeed observe strong inequality between advantaged and disadvantaged players in the asymmetric treatments. Figure 2 also provides further information about the extent of inequality across treatments. It shows that inequality rises when the cost parameter increases. A Mann-Whitney test shows that first stage payoffs for the disadvantaged groups are highest 12. In all statistical tests reported in this paper, the unit of observation is the group for the partner treatments and sessions in the stranger treatments.. 10.
(15) in the sym treatment, followed in turn by the asym4 treatment (z=-3.464, p<0.01; two-tailed) and the asym8 treatment (z=-3.55, p<0.001; two tailed). Our data also show that payoffs for the disadvantaged groups are higher in the asym4 treatment than in the asym8 treatment (z=2.205;p<0.05; two tailed). In contrast, first stage payoffs for the advantaged groups increase with the extent of inequality. Payoffs for the advantaged groups are significantly higher in the asym4 treatment than in the sym treatment (z=3.464; p<0.01; two tailed). Similarly payoffs for the advantaged are also higher in the asym8 than in the asym4 treatment (z=1.6; p<0.1; two tailed). These results are robust to the choice of the non parametric test. Thus these results show that inequality increases when the cost parameter rises.13 Figure 2. Average first stage profit in each treatment. 250. First stage profits. 200. 150. 100. 50. 0 SYM partner. ASYM4 partner. ASYM8. Treatments 1 STAGE PROFIT GP D. 1 STAGE PROFIT GP A. Hence, social inequality, given through differences in the investment costs, creates incentives for the advantaged to invest the maximum amount possible and forces by the same token the disadvantaged not to invest at all. By doing so, social inequality drives the inequality of payoffs (i.e. income inequality) between the two groups.. 5.2. Determinants of conflicts 5.2.1. Inequality and conflicts After having satisfied ourselves that our first stage procedure has indeed induced the predicted levels of inequality to a large extent, we now turn to our main research question: What is the link between inequality and the emergence of conflicts? As mentioned earlier, we would expect that (1) disadvantaged players riot more than advantaged players, and that (2) 13. Note that, at equilibrium, one should observe no differences across treatments asym4 and asym8 since theoretical predictions are identical. In contrast, we find that, the treatments substantially differ behaviourally.. 11.
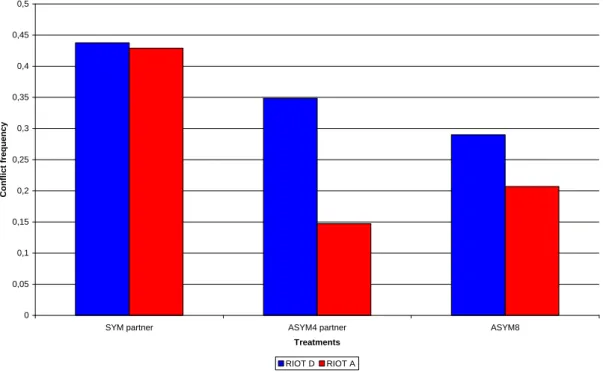
(16) we observe the more riots the greater the inequality becomes. Figure 3 indicates the conflict frequency in the sym, asym4 and asym8 treatments. It shows that the first hypothesis is strongly supported. This is stated precisely in result 1. Result 1: Disadvantaged groups significantly riot more than the advantaged groups in the asymmetric treatments. Support for result 1: Figures 4a- 4c illustrate the time path of the average share of conflicts (including both riots and counter riots) by period respectively for advantaged and disadvantaged groups in each treatment. The figures generally do not exhibit a pronounced time trend. Only in the asym4 treatment we can detect a slight downward trend in the first half of the experiment, which appears to be stopped later on. Thus, rioting is unlikely to be explained by initial confusion by subjects. In asymmetric treatments the advantaged players riot much less than the disadvantaged players. The difference is significant at p=0.06 (twotailed) according to the Wilcoxon test applied to the difference in average frequency of riot between groups in the single independent observations. A similar test for the sym treatment indicates no significant difference between groups A and D, (z =0.560; p>0.1; two-tailed). Figure 3. Conflict frequency in the sym and asym4 treatments. 0,5. 0,45. 0,4. Conflict frequency. 0,35. 0,3. 0,25. 0,2. 0,15. 0,1. 0,05. 0 SYM partner. ASYM4 partner. ASYM8. Treatments RIOT D. RIOT A. With respect to our second hypothesis, figure 3 and figures 4a to 4c show a surprising result that the overall conflict frequency decreases sharply with the relative disadvantage of the own position. In fact, most clashes are observed in the symmetric treatments, in which there is no disadvantage at all. When there is inequality the overall conflict rates drops strongly. This finding is stated in result 2.. 12.
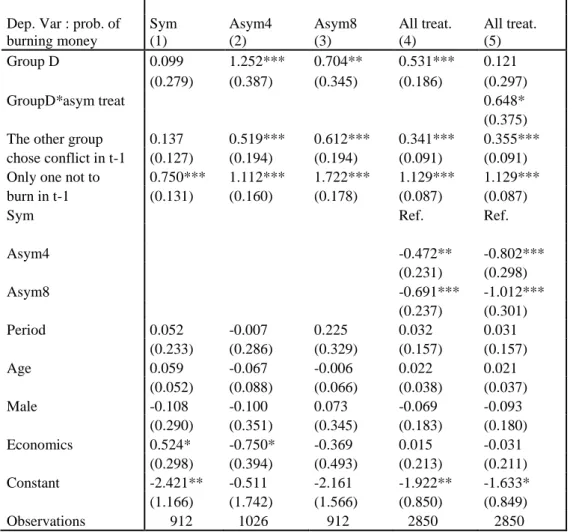
(17) Result 2: Conflict frequency declines sharply with the extent of inequality. Support for result 2. To further explore how burning decisions are affected by inequality, we estimated random effects probit models to account for the panel dimension of our data. Results are reported in table 3. The dependent variable takes the value 1 if individual i chooses to burn money in second stage of period t, and 0 otherwise. The independent variables include several dummy variables that are expected to be relevant. The “group D” variable takes the value 1 if the individual belongs to the disadvantaged and 0 otherwise. The dummy variable “the other group chose conflict in t-1” indicates whether the other group decided to burn money in the previous period. This variable aims to capture the part of conflict that would reflect potential revenge effects. The variable “only one not to burn in t-1” takes the value 1 if the individual chose not to burn in t-1 while the two others group members decided to burn and 0 otherwise. This variable seeks to capture the coordination dimension of the conflict decision. A trend variable was also included in the estimates. Finally several demographic variables were also included. These control variables include age, gender and a binary variable indicating whether the participant is student with prior in economics. Column 1 reports estimates from the baseline treatment i.e. the symmetric treatment. The models are estimated for asym4 and asym8 treatments in columns (2) and (3), respectively. Columns (4) and (5) report estimates on the pooled data. The dummy variables “asym4” and “asym8” were included in specifications (4) and (5) to control for the evolution of conflict decision when inequality increases. These variables are interpreted in relation to the omitted variable that corresponds to the symmetric treatment. The estimates summarized in Table 3 confirm our previous findings. The first model shows that being in group D does not influence the probability of conflict in the symmetric treatment (of course, the assignment to group A or D is arbitrary in this case). In contrast, the coefficient on this variable is positive and significant in both asymmetric treatments, thus disadvantaged individuals are more likely to initiate conflict than advantaged ones in a direct encounter. The coefficient associated to the variable “the other group chose conflict in t-1” is also positive and significant at the 1% level for all asymmetric treatments. This result indicates that a part of money burning decisions could be explained by willingness to take revenge. Table 3 also provides information about co-ordination that is necessary for conflict. Indeed being the only one not to burn in t-1 has a positive and significant influence on money burning decision in the current period. This variable reveals the two-equilibria structure of the riot game. Precisely it captures the fact that if player i believes from his previous experiences that the others will riot, then it becomes the best response for him to join in order to avoid peer pressure. Finally table 3 indicates that neither the trend variable nor the demographic variables are significant. 13.
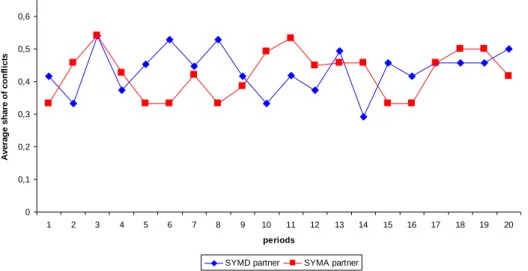
(18) Figure 4a. Average rate of conflict in the sym treatment over time (partner sessions). Average share of conflicts. 0,6. 0,5. 0,4. 0,3. 0,2. 0,1. 0 1. 2. 3. 4. 5. 6. 7. 8. 9. 10. 11. 12. 13. 14. 15. 16. 17. 18. 19. 20. periods SYMD partner. SYMA partner. Figure 4b. Average rate of conflict in the aym4 treatment over time (partner sessions). Average share of conflicts. 0,6. 0,5. 0,4. 0,3. 0,2. 0,1. 0 1. 2. 3. 4. 5. 6. 7. 8. 9. 10. 11. 12. 13. 14. 15. 16. 17. 18. 19. Periods ASYM4D partner. ASYM4A partner. Figure 4c. Average rate of conflict in the aym8 treatment over time. Average share of conflicts. 0,6. 0,5. 0,4. 0,3. 0,2. 0,1. 0 1. 2. 3. 4. 5. 6. 7. 8. 9. 10. 11. 12. 13. Period ASYM8D. ASYM8A. 14. 14. 15. 16. 17. 18. 19. 20. 20.
(19) Specifications (4) and (5) provide further evidence of the decline of conflict when inequality level increases. The dummy variable “asym4” captures a negative and significant coefficient at the 5% percent level. The coefficient on the “asym8” variable is also negative and significant at the 1% level. With respect to the symmetric treatment, these results indicate that the conflict frequency decreases significantly with the extent of inequality. Finally the interaction variable “group D*asym in specification (5) shows that being in group D increases the probability of burning money, but just in the asymmetric treatments.. Table 3. Determinants of burning decisions in partner sessions (Random Effects Probit) Dep. Var : prob. of burning money Group D. Sym (1) 0.099 (0.279). Asym4 (2) 1.252*** (0.387). Asym8 (3) 0.704** (0.345). All treat. (4) 0.531*** (0.186). 0.137 (0.127) 0.750*** (0.131). 0.519*** (0.194) 1.112*** (0.160). 0.612*** (0.194) 1.722*** (0.178). 0.341*** (0.091) 1.129*** (0.087) Ref.. All treat. (5) 0.121 (0.297) 0.648* (0.375) 0.355*** (0.091) 1.129*** (0.087) Ref.. -0.472** (0.231) -0.691*** (0.237) 0.032 (0.157) 0.022 (0.038) -0.069 (0.183) 0.015 (0.213) -1.922** (0.850) 2850. -0.802*** (0.298) -1.012*** (0.301) 0.031 (0.157) 0.021 (0.037) -0.093 (0.180) -0.031 (0.211) -1.633* (0.849) 2850. GroupD*asym treat The other group chose conflict in t-1 Only one not to burn in t-1 Sym Asym4 Asym8 Period Age Male Economics Constant Observations. 0.052 (0.233) 0.059 (0.052) -0.108 (0.290) 0.524* (0.298) -2.421** (1.166) 912. -0.007 (0.286) -0.067 (0.088) -0.100 (0.351) -0.750* (0.394) -0.511 (1.742) 1026. 0.225 (0.329) -0.006 (0.066) 0.073 (0.345) -0.369 (0.493) -2.161 (1.566) 912. Notes: Entries in columns (1) to (5) are probit coefficients. Standard errors in parentheses; * significant at 10%; ** significant at 5%; *** significant at 1%.. Table 4 reports the corresponding marginal effects of the random effect probit models presented above in table 3. The marginal effect 0.229 for group D in the asym4 treatment (see column 2) shows that individuals who belong to group D have a 22.9 percentage points higher probability of burning money than others. It amounts to 8 percentage points in the asym8 treatment. Being the only one not to burn money in t-1 increases the probability of burning. 15.
(20) money in the current period by almost 25 percentage points in the asym4 treatment and 33.7 percentage points in the asym8 treatment. The fact that the “the other group chose conflict in t-1” increases the probability of conflict by almost 10 percentage points in both treatments. Finally, column (5) indicates that individuals in the asym4 treatment have a 16.5 percentage point lower probability of burning money than persons who play the symmetric treatment. It amounts to 19.4 percentage points for individuals playing the asym8 treatment.. Table 4. Marginal effects on Pr(Conflict). Group D. Marginal effects dy/dx Sym Asym4 (table 3 col.1) (table 3 col.2) Asym8 All treat. (table 3 col.3) (table 3 col.4) 0.037 0.229*** 0.080** 0.123*** (0.105) (0.081) (0.044) (0.043). GroupD*asym treat The other group Chose conflict in t-1 Only one not to burn in t-1 Asym4. 0.051 (0.048) 0.268*** (0.046). 0.108** (0.051) 0.242*** (0.058). 0.091** (0.041) 0.337*** (0.069). 0.019 (0.088) 0.022 (0.019) -0.040 (0.109) 0.191* (0.104). -0.001 (0.050) -0.011 (0.015) -0.017 (0.060) -0.162 (0.101). 0.029 (0.050) -0.000 (0.007) 0.008 (0.038) -0.051 (0.083). Asym8 Period Age Male Economics. 0.084*** (0.025) 0.286*** (0.032) -0.101** (0.046) -0.140*** (0.043) 0.007 (0.032) 0.005 (0.008) -0.016 (0.042) 0.003 (0.049). All treat. (table 3 col. 5) 0.028 (0.068) 0.166* (0.105) 0.088*** (0.025) 0.287*** (0.032) -0.165*** (0.056) -0.194*** (0.050) 0.007 (0.037) 0.004 (0.008) -0.021 (0.042) -0.007 (0.049). Notes: Entries in columns (1) to (2) are marginal effects. Standard errors in parentheses; * significant at 10%; ** significant at 5%; *** significant at 1%.. 5.2.2. Why does inequality reduce conflict? The observation that inequality reduces overall conflict frequency was not predicted before the experiment, thus with the existing data we can only conjecture why it is the case. Two ex-post explanations are plausible. The first one refers to the dynamics of the repeated game. Disadvantaged players may fear counterstrikes by the advantaged players in later rounds and thus refrain from rioting. Note that advantaged players have more resources at their disposal and can afford losing some of them in a costly conflict more easily. The second hypothesis, in the spirit of Nagel (1976), suggests that strongly disadvantaged players may. 16.
(21) realise that they are in a hopeless position and accommodate with it. Lower conflict rates from disadvantaged groups are then due to resignation. We test these two hypotheses by designing new experiments that allows separating them. We conduct two treatments using the sym and the asym4 set-up, but with a stranger instead of a partner protocol. At the outset of each session the eighteen participants are divided into two sets of players, nine advantaged and nine disadvantaged players. These sets of nine remained unchanged, such that each participant kept the same role throughout the experiment. In every round the sets of nine players are then randomly divided into three groups of three players, and each group of the set of advantaged players is then matched with one group of disadvantaged players. With this setting the opportunity to counterattack is thus removed from the game. Thus, if the first hypothesis is correct, we should expect riots among disadvantaged players to become more frequent, as the fear of a counterstrike is taken away. Figures 5a and 5b illustrate the time path of the average share of conflicts over time in each treatment. These figures indicate that the disadvantaged groups riot significantly more than the advantaged groups in the asym4 treatment under stranger matching (z =-2.201, p<0.05, two-tailed test).14 In contrast, no significant difference is found across groups in the sym stranger treatment (z=-0.734,p=0.463; two tailed).. Figure 5a. Average rate of conflict in the sym treatments over time (stranger protocol). Average share of conflicts. 0,6. 0,5. 0,4. 0,3. 0,2. 0,1. 0 1. 2. 3. 4. 5. 6. 7. 8. 9. 10. 11. 12. 13. 14. 15. 16. 17. 18. 19. 20. Period SYM A stranger. 14. SYM D stranger. In statistical tests reported here, the unit of observation is the session for the stranger treatments.. 17.
(22) Figure 5b. Average rate of conflict in the asym4 treatments over time (stranger protocol). Average share of conflicts. 0,6. 0,5. 0,4. 0,3. 0,2. 0,1. 0 1. 2. 3. 4. 5. 6. 7. 8. 9. 10. 11. 12. 13. 14. 15. 16. 17. 18. 19. 20. Periods ASYM4D stranger. ASYM4A stranger. Figure 6 shows the average conflict rates in the stranger treatment, compared with the corresponding rates from the original data. The figure shows very similar conflict rates for the two matching protocols. A nonparametric Mann-Whitney test indicates that riot frequencies are virtually identical for the symmetric treatment (z=-0.646, p>.1) and for the advantaged players of the asymmetric treatment (z=0.944, p>1). For the disadvantaged groups in the asymmetric treatment we observe even a slight drop in riot rates from the original data, which is in the opposite direction from the expected effect. This difference, however, is not significant (z=0.354; p>.1). The new treatments clearly refute fear of counterattack as a substantial driver of the effect of inequality, and provide support for the resignation hypothesis. Figure 6. conflict frequency (partners and strangers matching) 1. partners. partners. strangers. strangers. 0,8. 0,6. 0,4. 0,43. 0,43 0,35 0,31. 0,2. 0,14. 0,14. 0 SYM P. SYM S. ASYM 4 A P. ASYM 4 D P. 18. ASYM 4 A S,. ASYM 4 D S.
(23) 5.2.3. Further support for the resignation hypothesis In the new experiment, which was designed to test the two explanations against one another, we added a post-experimental questionnaire that contained an individual decision task to identify the presence of resignation in general. We conjecture, in line with findings by Zizzo and Oswald (2001) that subjects may be willing to invest money in order to reduce their disadvantage. However, we hypothesise that they would be less inclined to do so if the disadvantage is severe. In this case, we expect that they rather save the money and accommodate with the inequality. To test this, we confronted the subjects with two choice tasks of the following kind. “You receive 50 points while the other player receives x points. You have the opportunity to reduce the other player ‟s payoff by 50 points. It will cost you 10 points. Do you want to reduce the other player‟s payoff?” For x we used the values 100 (scenario 1) and 200 (scenario 2). Thus, in the first scenario a subject could get the other player‟s payoff close to the own one by burning money (40:50 points), while in scenario 2 the relative inequality would, though reduced, still be massive (40:150 points). Each subject was asked both questions to enable us to do within-subject analysis, but the questions were presented in random order to control for sequence effects. The questions were fully incentivised. In total, 29.1% of subjects burned money in scenario 1. In scenario 2, this figure drops to 18.4%. A Wilcoxon sign rank test shows that this difference is significant (p<0.01, one-sided). Two thirds of the subjects who burn money in scenario 1 do not burn in scenario 2. Finally, only 9% of players choose to reduce the other player„s payoff in both scenarios. These results strongly support the idea that individuals tend to resign when inequality becomes too high.. 5. Conclusions We study the relationship between inequality and inter-group conflict in a controlled laboratory setting. Our experiment consists of a two-stage game. In a first stage, subjects play a proportional rent seeking game to share a prize. The share of the prize depends both on their effort and on the effort of the other players. In our experiment, social inequality arises exogenously by attributing to some subjects (the advantaged group) a bigger part of the prize than other subjects (the disadvantaged group). In a second stage, after being informed on the first stage payoff of each group member, they can coordinate with the other members of their group to reduce (“burn”) other group members‟ payoff. The treatments differ in the degree of inequality between the two groups. Three main results are found in this study. First, we find that despite the cost of rioting, a substantial number of players choose to destroy other group's money, in particular when they belong to the disadvantaged group. They do so although it entails no material benefit to themselves. Second our data also confirm that money burning decisions are strongly conditioned by on beliefs about decisions of others and that such beliefs are based on the issues of the coordination game observed in previous periods. Third, 19.
(24) and more surprisingly, our results also indicate that the level of conflicts significantly declines with the extent of inequality. There are a number of explanations of this phenomenon A first potential explanation relies on the idea that disadvantaged players may fear revenge by the advantaged players that may be exacerbated when inequality increases because advantaged players have more resources at their disposal for repression. A second explanation was based on the idea of resignation advanced by Nagel (1976) according to which the "tendency to compare" would decrease with the extent of economic inequality. Our data clearly refute the first hypothesis and provide support for the resignation hypothesis. The negative relationship between inequality and conflict provides support for a hypothesis put forward in the empirical literature on conflict. Inequality may influence negatively the probability of conflict because the disadvantaged receive fewer and fewer resources necessary for collective action when inequality increases (Parvin, 1973; Collier and Hoeffler). In the same vein, our results could be interpreted in terms of relative cost of rioting. Precisely, the cost of rioting increases for the disadvantaged because they get fewer resources to riot while the absolute cost of rioting remains unchanged. These above interpretations can be related to previous studies that showed that money burning decisions and in particular punishment decisions obey the law of demand and are influenced by its cost (Anderson and Putterman (2006); Zizzo (2003); Egas and Riedl (2005); Nikiforakis, Normann and Wallace (2005)). Although these considerations may be part of the story, we do not believe that this explanation is the main force behind our results. In particular, such interpretations are inconsistent with our results from the post-experimental questionnaire in which endowments were fixed. As such, an interpretation of our results in terms of resignation is the most consistent with all of our experimental findings. Our result that we find most conflict in symmetric treatments is also in line with empirical results on the relationship between polarisation and conflict. A society is most strongly polarised if it is dominated by two equally strong opposing groups. Empirical research (Mitchell (1968), Reynal Querol (2002), Montalvo and Reynal Querol (2005)) indicates that this constellation is most conducive to civil conflict. Our symmetric treatment captures such a constellation, and indeed we find the highest frequency of rioting there. This corroborates the empirical findings with data from a controlled environment. For more conclusive evidence, of course, much more experimental research in a variety of conflict-prone environments is needed. Our setting, which models destructive rioting without a political goal, differs substantially from the civil war scenarios studied in the empirical literature. The policy implications of our results are straightforward. Our data do not provide much support for reducing the likelihood of unrest by reducing inequalities, e.g. through generous benefits. On the contrary, such policies would not necessary reduce the probability of riots. Of course, this is not per se a call against measures to help disadvantaged groups. Our research question looks at only one issue – the likelihood of rebellion – but there are many reasons why one may find inequality undesirable. Our findings do not take anything away from these. 20.
(25) arguments. However, our results do suggest that if the goal is to tackle the threat of unrest, other measures should be taken. One such policy could be to overcome strong group divisions within the society. In our symmetric case, for instance, all players were identical, but our design exogenously imposed a division into two groups. This manipulation alone was sufficient to induce a strong occurrence of conflict. It may be a difficult task to create a sense of unity and common identity within a multicultural society, but our data suggest that it could be worth trying. Of course our results are not the final word on the matter. To keep the experimental model simple we had to leave out many important features of real-life conflicts. For instance, our experiment was conducted under anonymous laboratory conditions, in order to establish the most controlled conditions. In real life communication and propaganda can be expected to affect the likelihood of unrest. Further, not all outbreaks of riots are spontaneous. Leaders are often important for the ability of groups to coordinate their actions. One might also speculate that the influence of communication and leadership on conflict is critical particularly in larger groups, as involved in many real-life conflicts. Studying all these features is beyond the scope of the present study, but we believe our results pave the way for a promising future research agenda.. 21.
(26) References Abbink, K., and J. Brandts (2009): “Political Autonomy and Independence: Theory and Experimental Evidence”, Working paper, University of Amsterdam. Abbink, K., J. Brandts, B. Herrmann, and H. Orzen (2009): „Inter-Group Conflict and Intra-Group Punishment in an Experimental Contest Game”. American Economic Review, forthcoming. Abbink and H. Henning-Schmidt, (2006) “Neutral versus loaded instructions in a bribery experiment”, Experimental Economics 9, pp. 103–121. Abbink K. and A. Sadrieh (2008) "The pleasure of being nasty". Working paper, University of Amsterdam. Abbink K. and S. Pezzini, (2005) "Determinants of Revolt: Evidence from Survey and Laboratory Data," Discussion Papers, Centre for Decision Research and Experimental Economics, School of Economics, University of Nottingham. Alm, J., G. H. McLelland, and W. D. Schulze (1992): Why do people pay taxes? Journal of Public Economics, 48, 21-38. Anderson, C.M. and Putterman, L., (2006). "Do Non-Strategic Sanctions Obey the Law of Demand? The Demand for Punishment in the Voluntary Contribution Mechanism." Games and Economic Behavior, 54(1), 1-24. Baldry J.C. (1986): Tax Evasion Is Not a Gamble – A Report on Two Experiments. Economics Letters, 22, 333335. Binswanger, H., K. Deininger and G. Feder. (1993). “Power, distortions, revolt and reform in agricultural land relations.” In J. Behrman and T.N. Srinivasan (eds.), Handbook of Development Economics, Vol. 3. Elsevier Science B.V., Amsterdam. Bochet, O.; Page T. and Putterman, L., (2006). "Communication and Punishment in Voluntary Contribution Experiments." Journal of Economic Behavior and Organization. 60: 11-26 Bolton, G E. and Ockenfels, A, (2000). "ERC: A Theory of Equity, Reciprocity, and Competition." American Economic Review, vol 90,pp 166-93. Bowles, Samuel and Herbert Gintis (2004). "The Evolution of Strong Reciprocity : cooperation in heterogeneous populations” Theoretical Population Biology, 65;17-28 (with H.Gintis) Brockett, C.D. (1992). “Measuring political violence and land inequality in Central America.” American Political Science Review, Vol. 86, No. 1, pp. 169–176. Burnham T., K. MCCabe, and V. L. Smith (2000): Friend- or Foe: Intentionality Priming in an Extensive Form Trust Game. Journal of Economic Behavior and Organization, 43, 57-74 Carpenter, J.P., (2007). " The demand for punishment" Journal of Economic Behavior & Organization. 62 522– 542 Carpenter, J.P.; Matthews, P. and Ong'ong'a, O., (2004). "Why Punish? Social Reciprocity and the Enforcement of Pro-Social Norms." Journal of Evolutionnary Economics, 14. Charness G. and M. Rabin (2002). "Understanding Social Preferences with Simple Tests" Quarterly Journal of Economics, 117(3), 817-869. Collier, P. and A. Hoeffler, (1996). "On Economic Causes of Civil War". Mimeo, Centre for the Study of African Economies, Oxford. Collier, P., A. Hoeffler and M. Soderbom,, (2004). "On the Duration of Civil War", Journal of Peace Research. 41. 253-73. Cramer, C. (2005). "Inequality and Conflict -- A Review of an Age-Old Concern." United Nations Research Institute for Social Development, Programme Paper 11. Duffy J and M Kim (2004), “Anarchy in the Laboratory (and the Role of the State),” Journal of Economic Behavior and Organization, forthcoming. Durham Y, J Hirshleifer and V Smith (1998), “Do the Rich get Richer and the Poor Poorer? Experimental tests of a Model of Power,” American Economic Review, 88, 970-983. Egas, M., and Riedl, A., (2005). "The Economics of Altruistic Punishment and the Demise of Cooperation." IZA Discussion Paper No.1646. Falk, Armin; Fehr, Ernst and Fischbacher, Urs, (2005). "Driving Forces Behind Informal Sanctions." Econometrica, 73 (6), 2017-2030. Falk, Armin and Fischbacher, Urs (2006), "A Theory of Reciprocity", Games and Economic Behavior, 2006, 54 (2), 293-315 Fehr, E. and Schmidt, K. M., (1999). "A Theory of Fairness, Competition and Cooperation." Quarterly Journal of Economics, vol. 114, pp. 817-68. Fehr, E. and Gächter, S., (2002). "Altruistic Punishment in Humans." Nature, 415(10), 137-40.. 22.
(27) ____, (2000). "Cooperation and Punishment in Public Goods Experiments." American Economic Review, 90(4), 980-94. Gurr, T. 1970. Why Men Rebel. Princeton University Press, Princeton, NJ. Lacomba, J.A., F.M. Lagos, E. Reuben, and F. van Winden (2008): "After the war: An experimental study on post-conflict behaviour," Working paper, University of Amsterdam. Loewenstein, G.F., Thompson, L., and Bazerman, M.H. (1989). "Social Utility and Decision Making in Interpersonal Contexts". Journal of Personality and Social Psychology, vol. 57, pp. 426-441. MacCulloch, R. and S. Pezzini (2007) "Money, religion and revolution," Economics of Governance, 8(1), 1-16. Masclet, D.; Noussair, C.; Tucker, S. and Villeval, M.C., (2003). "Monetary and Non-Monetary Punishment in the Voluntary Contributions Mechanism." American Economic Review, 93(1), 366-80. Masclet D. and M.C. Villeval (2008) "Punishment and Inequality : a Public Good experiment" , Social Choice and Welfare , vol 31 no3 pp475−502 Midlarsky, M. I., (1988) “Rulers and the Ruled: Patterned Inequality and the Onset of Mass Political Violence”, American Political Science Review, vol 82, pp. 491-509.46 Millner EL and MD Prat (1989), “An Experimental Investigation of Efficient Rent-seeking,” Public Choice, 62, 139-151. Mitchell, E.J. (1968). “Inequality and insurgency: A statistical study of South Vietnam.” World Politics, Vol. 20, pp. 421–453. Montalvo, JG, and M Reynal Querol (2005): "Ethnic polarization, potential conflict, and civil war," American Economic Review, 95(3), 796-816. Muller, E.N. and M.A. Seligson. (1987). “Inequality and insurgency.” American Political Science Review, Vol. 81, No. 2, pp. 425–452. Nagel J. H 1976, "Erratum," World Politics 28 Nikoforakis, N., and Normann, H.-T. (2008) "A Comparative Statics Analysis of Punishment in Public Goods Experiments", Experimental Economics, 11 , pp 358-369. Nikoforakis, N., Normann, H.-T., Wallace, B. (2008). "Asymmetric Punishments in Public-Good Experiments.", Royal Holloway, University of London, mimeo Parvin, M. 1973. “Economic determinants of political unrest: An econometric approach.” Journal of Conflict Resolution, Vol. 17, pp. 271–296. Potters J, CG de Vries and F van Winden (1998), “An Experimental Examination of Rational Rent-seeking,” European Journal of Political Economy, 14, 783-800. Rabin, Matthew, (1993). "Incorporating Fairness into Game Theory and Economics." American Economic Review, 83, 1281-1302. Reynal Querol, M (2002): "Ethnicity, political systems, and civil war," Journal of Conflict Resolution, 46(1), 2954. Schock, K., (1996) “A Conjectural Model of Political Conflict: The Impact of Political Opportunities on the Relationship Between Economic Inequality and Violent Political Conflict”,Journal of Conflict Resolution, vol. 40, pp. 98-133. Weede, E., (1981) “Income Inequality, Average Income, and Domestic Violence”, Journal of Conflict Resolution, vol. 25, pp. 639-654. Weimann J, CL Yang und C Vogt (2000): “An experiment on sequential rent-seeking”, Journal of Economic Behavior and Organization, 41, 405-426. Zizzo, D.J., Oswald, A.J., (2001). "Are people willing to pay to reduce others‟ incomes?" Annales d’Economie et de Statistique 63/64, 39–65. Zizzo, D.J. (2003). "Money burning and rank egalitarianism with random dictators" Economics Letters 81, 263– 266. 23.
(28) Instructions (asym4 treatment) General instructions You are now taking part in an economic experiment of decision making. The instructions are simple. If you read the following instructions carefully, you can, depending on your decisions and the decisions of others, earn a considerable amount of money. It is therefore very important that you read these instructions with care. The instructions we have distributed to you are solely for your private information. It is prohibited to communicate with the other participants during the experiment. Should you have any questions please ask us. If you violate this rule, we shall have to exclude you from the experiment and from all payments Each participant receives a lump sum payment of 3 euro at the beginning of the experiment. At the end of the experiment your entire earnings from the experiment will be immediately paid to you in cash. During the experiment your entire earnings will be calculated in points. At the end of the experiment the total amount of points you have earned will be converted to euro at the following rate :. 328 points = 1 euro. At the beginning of the experiment, you will be assigned a role of player A or player B. You will keep your role during the entire experience. The participants will be then assigned to a group of six which is composed of three players of type A and three players of type B. You will therefore be in interaction with 4 other participants. If you are player A, then you are matched with three players B and two player A, and reversely. The composition of the groups remains unchanged during the experience. The experiment is divided into twenty periods. The instructions for each period are given in the detailed instructions.. Detailed instructions Each period consists of two stages. First stage In this stage, you and the 5 other participants in your group will have to share a monetary prize of 576 points. The share of the 576 points you receive depends on your decision and the decisions of the five other participants in your group. You can affect your share of the prize by purchasing tickets. Your share of the prize in your group also depends on the number of tickets purchased by the three other participants in your group. More precisely, the prize is divided among the participants in amounts to the number of tickets they purchase. However, for the same number of tickets bought, players A will receive 4 times more amount of the prize than players B. Prior to your decision about how many tickets you wish to purchase, you will be able to observe the number of tickets the other participants purchase. At the beginning of first stage of each period, each participant will get an endowment of 100 points. You can keep as much of this 100 points as you like, or you can use some of it to purchase tickets. Note that you cannot buy more than 80 tickets. Each ticket will cost you 1 point. In your group, each participant‟s share, or proportion, of the 576 prize will be given by the number of tickets they purchased divided by the total number of tickets purchased in their four participant group. Your earning in this decision will be the part of you endowment of 100 point which you do not spend on tickets, plus the share of the 576 prize you receive. To summarize, your earnings for this first stage at each period will be calculated :. 24.
Figure
+6


Documents relatifs
telephone and other existing information networks in the nation’s information infrastructure, the NREN can serve as a working test-bed for new technologies, applications,
(1) Individual perceptions of members’ own abilities and group norms interact in the emergence of group emotional awareness and (2) group emotion regulation can
Allows the PDP-ll program to gener.ate PDS-l display code directly in core, with the PDS-l handling the display refresh control.. Control
Nocturnal monitoring of home non- invasive ventilation: the contribution of simple tools such as pulse oximetry, capnography, built-in ventilator software and autonomic markers
Zürcher et al.. whether we can be manipulated and still be free and re- sponsible. In the case mentioned above, responsibility seems suspicious to us because we suspect that there
Creating a Database Application Problem You need to create a database application that contains a data entry form to manage a master list of customers and their details... Solution
information on this control register, please obtain the Cirrus Logic revision “M” errata from your Motorola Computer Group sales representative.. This condition will be corrected in
Afin de répondre à leurs besoins et de vous démarquer de vos concurrents, il est nécessaire de vous tenir informé des plus grandes tendances dans l’industrie des vêtements
