CONTRIBUTION DES LIENS RACINAIRES AUX COMPOSANTES GÉNÉTIQUES ET PHYSIOLOGIQUES DE LA STRUCTURE CLONALE DU
PEUPLIER FAUX-TREMBLE (POPULUS TREMULOIDES MICHX):
THÈSE PRÉSENTÉE
COMME EXIGENCE PARTIELLE
DU DOCTORAT EN SCIENCES DE L ' ENVIRONNEMENT
PAR
HAN A JELÎNKOV
A
Mise en garde
La bibliothèque du Cégep de l’Témiscamingue et de l’Université du Québec en Abitibi-Témiscamingue a obtenu l’autorisation de l’auteur de ce document afin de diffuser, dans un but non lucratif, une copie de son œuvre dans Depositum, site d’archives numériques, gratuit et accessible à tous.
L’auteur conserve néanmoins ses droits de propriété intellectuelle, dont son droit d’auteur, sur cette œuvre. Il est donc interdit de reproduire ou de publier en totalité ou en partie ce document sans l’autorisation de l’auteur.
Warning
The library of the Cégep de l’Témiscamingue and the Université du Québec en Abitibi-Témiscamingue obtained the permission of the author to use a copy of this document for non-profit purposes in order to put it in the open archives Depositum, which is free and accessible to all.
The author retains ownership of the copyright on this document. Neither the whole document, nor substantial extracts from it, may be printed or otherwise reproduced without the author's permission.
the help ofnumerous people surrounding me at UQAT in Rouyn-Noranda and Amos, at UQAM in Montreal and at the research station in Duparquet.
Namely 1 would like to thank to Francine Tremblay, my director, who gave me the trust to do this work and did not lose it even over a long time and distance. 1 would like to greatly appreciate the way she directed my work with a lot of liberalism, independence, and understanding.
1 would also like to thank to Annie DesRochers, my co-director, who guided me throughout this work. Her straight to point ideas helped greatly to improve the resulting manuscripts.
1 am greatful to M. Baret who accompanied me for long hours in the study fields in the boreal forest. Thank you to him 1 could finish the work even when facing the frightening beauty of the wildemess far in the northwest of Quebec.
1 would also like to thank to E. Whitfield, L. Blackburn, and Ch. Pack who helped me to explore the fascinating world hidden deep in the ground and C. Krause for introducing me to the realm of dendrochronological analyses.
My gratitude also goes to K. Naydenov and his wife for their not only professional but also personal presence in the laboratory of population genetics.
1 would also like to express my appreciation to P. Wildova, my friend and former colleague, who helped me to make my way through the preparation of the real time expression assays.
1 am also grateful to my parents for continuous support, and in particular to my mother who patiently baby-sat my little baby boy for countless hours so 1 could work on this text.
And finally, it is difficult to express in words my gratitude to Christopher who actually brought me to this part of the world and made me discover its colorful society, culture, language, and nature. He was always there ready to share the good and difficult moments with me.
Moreover, this work would not be possible without the support of the Centre for Forest Research, National Science and Engineering Research Council, Industrial Chair in Sustainable Forest Management, Fonds de recherche sur la nature et les technologies, and the govemment of Que bec.
CONTENTS
LIST OF FIGURES. 0 0 0 0 0 0 0 0 0 0 0 0 0 0 0 0 0 0 0 0 0 0 0 0 0 0 0 0 0 0 0 0 0 0 0 0 0 0 0 0 0 0 0 0 0 0 0 0 0 0 0 0 0 0 0 0 0 0 0 0 0 0 0 0 0 0 0 0 0 0 0 0 Vl
LIST OF TABLES ... viii
LIST OF ABBREVIATIONS, SYMBOLS , AND ACRONYMS... ... ... ... x
RÉSUMÉ ... xii
ABSTRACT ... xiii
INTRODUCTION... . . . .. 1
STATE OF THE ARTS... 1
Trembling aspen (Populus tremuloides Michx.)... ... 1
Clone identification... 2
Genotype conservation and aspen root system... . .... . ... . .... 3
Physiological integration... . .... . ... . ... . .... . ... 4
Plant defenses against herbivores and herbivore-simulated wounding... 5
Defense signaling in a clonai plant species ... 6
METHODS... . ... . .... . ... 7
OBJECTIVES AND EXPERIMENTAL APPROACH... . .... . ... . . 8
CHAPTERI THE USE OF DIGITAL MORPHOMETRICS AND SPRING PHENOLOGY FOR CLONE RECOGNITION IN TREMBLING ASPEN (POPULUS TREMULOIDES MICHX.) AND ITS COMPARISON TO MICRO SATELLITE MARKERS ... 11
1.1 RÉSUMÉ ... 12
1.2 ABSTRACT ... 13
1.3 INTRODUCTION... . . ... . 14
1.4 MATHERIALS AND METHODS ... . ... . .... . .... . ... . .... . ... 16
1.4.1 Study Sites ... 16
1.4.2 Microsatellite Characteristics... .. 16
1.4.3 Leaf Shape Description . . . .. . . 17
1.4.4 Leaf Shape Analysis ... . .... . ... . .... . ... ... ... . 17
1.4.5 Phenological and Bark Charact eristics ... . .... . ... . .... . ... ... 19
1.5.1 Microsatellite Characteristics ... . .... . .... . ... . .... . ... 19
1.5.2 LeafShape Characteristics ... . ... . .... . ... . .... . ... 19
1.5.3 Phenological and Bark Characteristics ... 27
1.6 DISCUSSION... . . . 30
1.7 CONCLUSION ... 33
1.8 ACKNOWLEDGEMENTS... . ... . .... . ... . .... . ... . .. 33
1.9 LITERA TURE CITED ... 33
CHAPTER II MOLECU LAR AND DENDROCHRONOLOGICAL ANALYSIS OF NATURAL ROOT GRAFTING IN TREMBLING ASPEN (SALICACEAE)... ... ... 38
2.1 RÉSUMÉ ... 39
2.2 ABSTRACT ... 40
2.3 INTRODUCTION ... 41
2.4 MATERIALS AND METHODS .... . .... . ... . .... . .... . ... . .... . .... . ... 43
2.4.1 Study Are a ... . . . 43
2.4. 2 Excavation and Sampling ... . . .. . 44
2.4. 3 Dendrochronological Analysis ... . . . 45
2.4.4 Clone Identification... . .... . ... . .... . ... . .... . ... . ... 45
2.5 RE SU LTS... . .... . ... . .... . ... . .... . ... . .... . ... 46
2.5.1 Clone Identification ... . .... . ... . .... . ... . .... . ... . ... 46
2. 5.2 Natural Root Grafting ... .. 47
2.5. 3 Living Roots on Dead St umps (LRDS) ... 48
2.5.4 Clonai Integration... . ... . .... . ... . .... . ... . .... . ... 51
2.6 DISCUSSION ... . . . 53
2.7 ACKNOWLEDGEMENTS ... 57
2.8 LITERA TURE CITED ... 57
CHAPTER III HERBIVORE-SIMULA TED INDUCTION OF DEFENSES IN CLON AL NETWORKS OF TREMBLING ASPEN (POPULUS TREMULOIDES) ... .. 62
3.1. RÉSU MÉ ... ... 63
3.3 INTRODUCTION... . ... . .... . .... . ... . .... . .... . ... 65
3.4 MATERIALS AND ME THODS.... . .... . ... . .... . .... . ... . .... . .... . ... 68
3. 4.1 Plant material. . . 6 8 3.4.2 Stress treatment simulating insect herbivory . . . .. 69
3.4.3 Selection of target genes and normalization standards... 69
3.4.4 Primer and TaqMan probe design ... . .... . ... . .... . ... 70
3.4.5 Quantitative real-time PCR assay... 71
3.4.6 Data analysis and statistics... 72
3.5 RESU LTS... . ... . .... . ... . .... . ... . .... . ... .. 72 3.5.1 Expression of KTI ... 72 3.5.2 Expression of DFR... 73 3.6 DISCUSSION... 78 3.7 CONCLU SION... . .... . ... . .... . ... . .... . ... 81 3.8 ACKN OWLEDGEMENTS... . ... . .... . ... . .... . ... . .. 82
3.9 LITERA TURE CITED ... .. 82
GEN ERAL CONCLUS ION ... . . . .. . . . ... . . .. 90
Clone Ident ification ... . . 90
Natural Root Grafting and Clone Survival... . .... . ... . .... . ... 90
Ecological significance ofnatural root grafting ... . .... . ... . .... . . .. 92
Ant i-herbivore defenses ... . . 94
LIST OF FIGURES
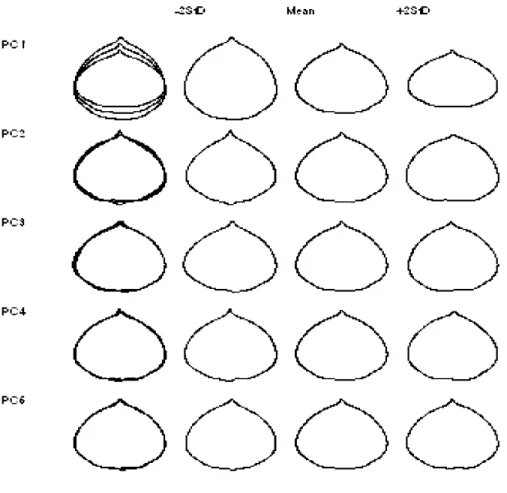
1.1 Figure 1.1 Contour reconstruction by inverse Fourier transformation showing the effect of the first five principal component scores calculated from 80 harmonies. Second, third, and fourth column depict the cases when the scores take -2 standard deviations, mean, and +2 standard deviations. The three contours are overlaid in the first 20 column.
1.2 Mean leaf shapes of the 12 multi-ramet aspen clones identified by the microsatellite markers. Clones are marked by the letters; A), B), and C) show mean leaf shapes of clones from sites M, K, and W,
respectively. 23
1.3 Scatter-plots of within-ramet means of the first and second principal component based on nEFDs for 80 harmonies. Clones from site K are marked with signs filled in black or grey. Single-ramet clones were
excluded. 23
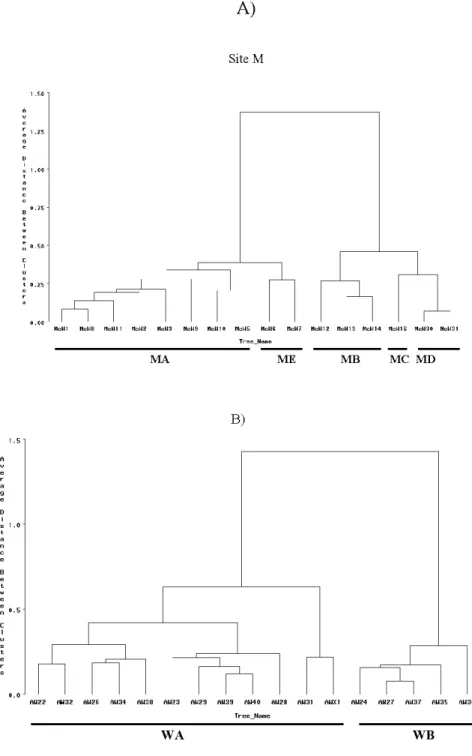
1.4 Cluster analysis dendrograms derived from a matrix of mean Euclidian distances based on PCs calculated from nEFDs for 80 harmonies. Only ramets from multi-ramet clones were included.
Outliers are marked by arrows. 25
1.5 Scheme of sites K and W showing the leaf out times and clones defined by microsatellite markers . The microsatellite-defined clones are marked by letters, sigle ramet clones are marked by empty circles. Fullline, dotted, and dashed circles mark the leaf out time: part A) full line 15 May, dotted 24 May, dashed after 24 May, B) fullline -before 19 May, dotted - 19 May, dashed - 23 May; Black arrows
show root connections among ramets. 29
2.1 Genotype A) and t ype of connections B) of living roots on dead
stumps (LRDS) to corresponding living ramets. 50
2.2 Schemas and photographs of root systems and donal integration in sites W and K. Living ramets are numbered, clones are distinguished by different letters, and living roots on dead stumps (LRDS) are marked by
t
preceding donal identification. Parental roots and grafts are depicted by dotted and full lines, respectively. Dashed lines show roots connecting two individuals that could not be dated because of3.1 Temporal pattern of Kunitz trypsin inhibitors (KT!s) relative expression in Populus tremuloides after simulated herbivory. Time-course of transcript abundance was followed over 5 time points in systemic leaves of stressed and untreated plants sharing the same root and in controls. Gene expression was related within the same plant to
time O. 75
3.2 Temporal pattern of dihydroflavonol reductase (DFR) relative expression in Populus tremuloides after simulated herbivory. Time-course of transcript abundance was followed over 5 time points in systemic leaves of stressed and untreated plants sharing the same root and in controls. Gene expression was related within the same plant to
LIST OF TABLES
1.1 Eigenvalues and contributions of principal components calculated from normalized elliptic Fourier descriptors based on 20, 40, and
80 harmonies. 22
1.2 Summary of canonical variates analyses of aspen leaf shape based on principal components of elliptic Fourier coefficients. Groups were successively defined as clones and ramets and individual leaves were used as replicates. All Wilks' lambdas were significant (P<0.05). Partitioning of the total variation based on
Wilks'. 26
1.3 Test of the discriminatory power of the EFDs. Ramets defined by leaf averages of CV s were reassigned into clones identified by molecular markers. Clone discriminant variables were calculated from nEFDs for 20, 40, and 80 harmonies. Single-ramet clones
were excluded from the analysis. 27
1.4 Number of clones identified by microsatellite markers and number of morphotypes defined by spnng phenology and bark
characteristics. 28
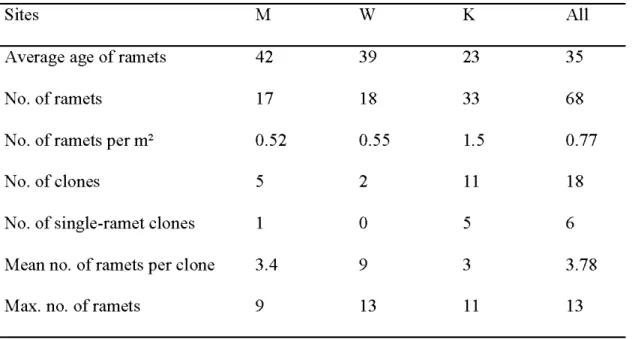
2.1 Site and clone characteristics. 47
2.2 Summary of graft incidence, location, and dating of root age when
grafting completed (the first common ring formation). 49 2.3 Integration type of aspen ramets into the communal root system. 51 3.1 Gene-specifie pnmers and probes used for the real-time
amplification of Kunitz trypsin inhibitors (KTJs) and dihydroflavonol reductase (DFR) genes, two markers of poplar defense, and actin (A CT) and translation initiation factor SA (TIF)
used as endogenous standards for transcript abundance
normalization. 71
3.2 Temporal pattern of KT! relative expresswn m control (C), stressed (S) and untreated (UT) plants of Populus tremuloides after simulated herbivory; *expression of KT! gene significantly different (P < 0.05) from time 0, **expression of KT! gene
3.3 Temporal pattern of DFR relative expression in control (C), stressed (S) and untreated (UT) plants of Populus tremuloides
after simulated herbivory; *expression of DFR gene significantly different (P < 0.05) from time 0, **expression of DFR gene
ACT BLAST Ct CVA CVs DFR EFDs ESTs fand g h ISR KPis l LPI LRDS mRNA NCBI nEFDs PC
LIST OF ABBREVIATIONS, SYMBOLS, AND ACRONYMS
act in
Basic Local Alignment Search Tool
threshold cycle values Canonical variates analyses canonical variates
dihydroflavonol reductase elliptic Fourier descriptors expressed sequence tags
allelic frequencies of alleles f and g number of heterozygote loci
induced systemic resistance Kunitz protease inhibitors number of loci
leaf plastochron index living roots on dead stumps messenger ribonucleic acid
National Center for Biotechnology Information normalized elliptic Fourier descriptors
PCA principal component analysis PCR polymerase chain reaction
Pgen probability that consecutively sampled trees that actually belong
to different clones would, by chance, have a similar genotype
R raw fluorescence data
Rn raw fluorescence normalized to ROX reference dye
TIF translation initiation factor
À Wilks' lambda
1 - Àclones among clone component
RÉSUMÉ
Dans cette thèse, nous avons examiné une nouvelle approche pour l'identification des clones de tremble. Nous avons utilisé les liens racinaires clonaux pour l'exploration de leurs fonctions potentielles dans le maintien de la diversité clonale et de la communication entre les tiges interconnectées. En particulier, nous avons examiné les hypothèses suivantes: (1) les clones de tremble peuvent être identifiés sur la base de la morphométrie digitale des feuilles; (2) les liens racinaires clonaux facilitent le maintien de la diversité clonale en intégrant différents génotypes par les greffes racinaires; et (3) les liens racinaires permettent la propagation et déclenchement des mécanismes de défense contre une attaque d'herbivore entre les individus interconnectés avant l'arrivée des insectes. Pour vérifier ces hypothèses, nous avons excavés les systèmes racinaires de trois stations de tremble purs où les clones ont été identifiés à 1 'aide de marqueurs moléculaires (microsatellites), morphologiques (forme de feuille, couleur et type de 1' écorce) et phénologiques (apparition des feuilles). Les feuilles ont été récoltées et scannées. Les résultats ont été analysés à l'aide des descripteurs Fourier elliptiques normalisés (nEFDs). Les analyses dendrochronologiques ont été utilisées pour reconstruire le développement du système racinaire et le greffage racinaire. L'expression temporelle des mécanismes de défense induits (inhibiteurs de la trypsine de type Kunitz et dihydroflavonol réductase) a été suivie par une PCR quantitative en temps réel. Nous avons montré que l'évaluation quantitative de la forme des feuilles est difficilement applicable à l'identification des clones dans des peuplements naturels de peupliers caractérisés par la présence d'un grand nombre de clones et de génotypes uniques. Les systèmes racinaires excavés ne contenaient pas de génotypes uniques et qui n'étaient pas présent dans les tiges des arbres vivants. Néanmoins, l'interconnectivité substantielle à l'intérieur des clones ainsi qu'entre les clones, due à la présence de nombreuses greffes, conduit à la formation de vastes réseaux racinaires génétiquement diversifiés. Nous avons constaté que ces systèmes racinaires n'entraînent pas automatiquement l'induction des mécanismes de défenses, tels qu'ils sont exprimés dans les plantes directement exposées aux attaquesd'insectes phytophages. Il semble plutôt que d'autres moyens de communication, comme les composés volatils, puissent servir de voies de transmission des signaux entre les individus interconnectés.
Mots clés: Populus tremuloides, identification clonale, effet de l'environnement, morphométrie, ramet, diversité foliaire, phénologie printanière, indicateurs microsatellites, intégration clonale, dendrochronologie, diversité, greffe racinaire, système racinaire, attaque herbivore, expression génétique, communication entre plantes, défenses induites.
ABSTRACT
In this thesis, we investigated a novel approach of aspen clone recognition and used the delineated donal root networks for exploration oftheir possible functions in diversity maintenance and communication among network members. In particular, we hypothesized that: (1) aspen clones could be delineated based on digital morphometrics of leaf shape; (2) donal root networks could facilitate diversity maintenance by integration of different genotypes through natural root grafts; and (3) donal root networks could serve as an early-waming system triggering antiherbivore defenses in network members even before arrivai of pests. In order to verify these hypotheses, we uncovered root systems of three pure as pen stands where clones had been identified with the help of molecular (microsatellite loci), morphological (leaf shape, bark colour and type) and phenological (timing of leaf flush) characteristics. Scanned leaves were analyzed using normalized elliptic Fourier descriptors (nEFDs). Dendrochronological analyses were employed to reconstruct the root system development with respect to natural root grafting. Temporal expression of induced defensive traits (Kunitz trypsin inhibitors and dihydroflavonol reductase) was followed by quantitative real-time PCR. We showed that despite quantitative evaluation of the complex leaf shape, this approach to clone identification is hardly feasible in natural aspen stands with high number of clones and many singletons. The uncovered root networks did not include unique genotypes that would not occur among stems. Nevertheless, substantial interconnectivity both within as well as between clones due to frequent grafting resulted in formation of large genetically diverse root networks. We found that these root systems did not automatically lead to induction of defensive traits that are expressed in plants directly under simulated herbivory. Rather, it seemed that other communication means such as air borne volatiles could serve as signal transmission pathways among network members.
Key words: Populus tremuloides, clone identification, leaf flush, environmental effect, morphometrics, ramet, foliar diversity, spring phenology, microsatellite markers, donal integration, dendrochronology, diversity, natural root grafting, root system, herbivory, gene expression, interplant communication, induced defenses
ecosystems, numerous aspects of its biology have been thoroughly explored. Considerably less attention has been paid to aspen root system. In this thesis, we studied aspen clones and their underlying root networks. A few studies showed that natural root grafting occurs in aspen (Barnes, 1966; Shepperd, 1993; Desrochers and Lieffers, 2001). But can grafts be found even among roots of different clones? Could roots of dead stumps surviving due to grafting to living trees have unique genotypes that are not present among the living trees? And could, thus, aspen root systems represent a "genotype bank" that helps maintain high levels of donal diversity despite the prevailing vegetative reproduction? Does aspen trees or even clones function as discrete physiologie units or rather as a part of a larger physiological entity? And in particular, can aspen root systems be use as networks for sharing information among network members? Moreover, we tried to facilitate clone recognition by exploring a new method for clone identification and addressed the following questions: Is it possible to identify aspen clones solely based on the shape of leaves provided we evaluate the complex shape? Is there enough foliar variation among clones growing in close proximity? Is the leaf shape invariant enough within a single tree? Are other traditionally used traits such as timing of spring leaf flush reliable for clone identification?
STATE OF THE ARTS
Trembling aspen (Populus tremuloides Michx.)
Trembling aspen (Populus tremuloides Michx.), a member of the Salicaceae family, is a deciduous tree species widely distributed over the Northern Hemisphere
(Bradshaw et al., 2000). As pen stands play an important role in maintaining ecosystem biodiversity by providing nutrition and habitat for a number of species (Griffis-Kyle and Beier, 2003).
Aspens are dioecious, pollinated, and produce large numbers of wind-dispersed seeds. Successful seed germination requires favorable moisture conditions, absence of competition, and availability of exposed mineral soil. However, these conditions allowing new seedling recruitment rarely occur at the same time (Romme
et al., 2005). Sorne even suggested that massive colonization of vast areas through
seedling establishment has not occurred in North America since the end of the last glacial period 10 000 years ago (Kemperman, 1976). Vegetative propagation from root suckering, thus, remains the prevailing mode of reproduction making aspen a donal tree species.
Rapid aspen regeneration occurs after either man-made or natural disturbances such as fires, outbreaks of insects, or gaps created by fallen trees (Bergeron, 2000). Release of apical dominance following the tree removal allows sucker initiation from the shallow lateral roots that were left in the ground after the disturbance (Frey et al., 2003). Vegetative reproduction of aspen leads to the formation of a clone or genet that can be composed of several trees termed ramets (Scrosati, 2002).
Clone identification
Identification of clones can be done based on similarities in phenotype or genotype among individuals. Ideal phenotypic or genotypic criteria used for clone identification should exhibit a large variation among clones and be highly consistent within clones. As not a single phenotypic feature was sufficient to provide enough variation, a combination of a few was traditionally used (Bames, 1966; Bames, 1969; Kemperman, 1976; Barnes and Han, 1993). Ideal criteria should be also insensitive to
environmental factors. Sorne morphological characteristics were traditionally assessed only categorically and such characterization has nowadays been abandoned as being too subjective. Value of other morphological traits was questioned for being influenced by environmental factors (Pers son and Gustavsson, 200 1; Rumpunen and
Bartish, 2002; Lopez-de-Heredia et al., 2004). Recently, molecular markers have become the method of choice in most population studies (Wyman et al. , 2003; Namroud et al., 2005; Suvanto and Latva-Karjanmaa, 2005; Mock et al., 2008; De Woody et al., 2009; Jelinkova et al., 2009; Liesebach et al., 2010).
Nonetheless, morphological trait assessment had several advantages over the use of molecular markers. It was mainly the rapidity and ease of use directly in the field without the need of any laboratory analyses. Development of new methods for evaluation of various biological shapes in animais and plants brought also new possibilities for clone delineation (McLellan and Endler, 1998; Jensen et al., 2002; Neto et al., 2006; Viscosi and Fortini, 2011; Cope et al., 2012). A new method ofleaf shape analysis was explored in the first chapter.
Genotype conservation and aspen root system
Clonai diversity in species with limited sexual reproduction tends to diminish over time (Balloux et al., 2003). Despite the limited recruitment of seedlings, aspen remains one of most diver se tree species letting stranded those who tried to find a decline of clonai richness during succession (Erickson and Hamrick, 2003; Pluess and Stocklin, 2004; Namroud et al., 2005). In the second chapter, we sought an additional mechanism of diversity maintenance in aspen clonai root network.
Shallow root systems of aspens comprise the principal and thin lateral roots. They are mainly the lateral roots that initiate new suckers . Aspen trees that have regenerated from the root suckers remain connected to the original parental roots
even after reaching maturity (Des Rochers and Lieffers, 2001 ). Besicles, aspen root systems often include surviving roots of dead stumps grafted to roots of living stems (DesRochers and Lieffers, 2001 ). It is not known wh ether the se grafts occur only between roots of the same genotype or whether they could be also established between trees of different clones. Montalvo and his colleagues (Montalvo et al., 1997) found that sorne interconnected trees of another donal tree species, Quercus chrysolepis, differed in genotypes. Moreover, many aspen clones are often intermingled at the same site (Wyman et al., 2003; Namroud et al., 2005; Suvanto and Latva-Karjanmaa, 2005). These findings suggest that different genets of an aspen stand might be linked by their root systems and could include roots of unique genotypes that are not present among the stems. We explored this "genotype bank" hypothesis in the second chapter.
Physiological integration
The above described formation of physical root connections which allow exchange of substances among interconnected trees is known as physiological integration. The root connections are not only physical but also physiological allowing for the exchange ofwater, nutrients, and carbohydrates. Nonetheless, little is known about sharing of hormones, pathogens and non-nutritional molecules. It has been suggested that these connections may represent highways for long-distance transport of signais (Stuefer et al., 2004). Viewed from this angle, the physiological integration might have far-reaching physiological and ecological implications. Clonai root networks could be, for instance, used as a mean of communication of defense signais among the inter-connected individuals.
Plant defenses against herbivores and herbivore-simulated wounding
Trees have efficient defense mechanisms (Philippe and Bohlmann, 2007; Duplessis et al., 2009; Ralph, 2009; Barton and Koricheva, 2010) that can be divided into two types; constitutive defense mechanisms are permanently at work even in absence of potential threats (Robison and Raffa, 1997; Philippe and Bohlmann, 2007; Brilli et al., 2009), whereas, inducible defenses occur only after pathogen or herbivore attack triggering off the defense responses (Metraux et al., 2002; Philippe and Bohlmann, 2007; Germain and Seguin, 2011 ). Sorne defense mechanisms effect herbivores directly by producing toxins or other substances that change the tissue quality (Lindroth, 2001; Osier and Lindroth, 2001; Bailey et al., 2007; Donaldson and Lindroth, 2008). Other defense mechanisms may tackle the herbivores in an indirect way by releasing gaseous chemicals called volatiles that attract the natural enemies of the herbivores (Parry et al., 2003; Arimura et al., 2004; Brilli et al., 2009).
The induced defense mechanisms can be either confined to the damaged site or spread to rem ote unaffected parts of the plant. This phenomenon is referred to as induced systemic resistance (ISR; Metraux et al., 2002). After recognition of an initial stimulus (herbivory) by the plant, a signal transduction pathway is switched on resulting in activation of defense mechanisms. These defense mechanisms principally involve expression of new genes (Haruta et al., 2001a; Haruta et al., 2001b; Peters and Constabel, 2002; Arimura et al., 2004; Christopher et al., 2004; Wang and Constabel, 2004; Ralph et al., 2006; Tsai et al., 2006; Philippe et al., 2009; Philippe et al., 2010).
Among hundreds of systemically wound-induced genes, there are chitinases, peroxidase, lipoxygenase, and cysteine proteinase, which have direct roles in herbivore defenses, and numerous others, which have a variety of other functions in metabolism, signal transduction, and other cellular processes (Metraux et al., 2002).
Mechanical wounding has been used in many studies as a simple imitation ofthe real herbivory (Constabel et al., 2000; Haruta et al., 2001a; Christopher et al., 2004; Dervinis et al., 2010). At the level of gene expression, both the artificial and real herbivory led to the production of qualitatively similar response, nonetheless these two responses differ quantitatively (Major and Constabel, 2006). Ultimate proofs of defense mechanism activation were brought by studies using real insect feeding that demonstrated that defense induction affected insect behavior (food choice tests) or development and survival of insect larvae (Osier, 2000; Osier and Lindroth, 2001; Dervinis et al., 20 10).
In trembling aspen, three trypsin inhibitors were found to be involved in induced protein-base defenses against insect herbivores (Haruta et al., 2001a). Trypsin inhibitors are one of protease inhibitors which intervene with the proteolytic activity of enzymes in herbivore guts leading to loss of essential amino acids, and consequently, to an inhibition of insect growth (Dicke and Hilker, 2003). Other well-characterized, both constitutive and inducible, anti-herbivore defense systems of trembling aspens are based on production of phytochemicals such as condensed tannins and phenolic glycosides (Haruta et al. , 2001b; Peters and Constabel, 2002; Peters and Constabel, 2003). Condensed tannins are polyphenolic compounds, typically found in woody plants, which reduce efficiency in nutrient absorption in insect midgets.
Defense signaling in a clonai plant species
Herbivory feeding (or herb ivory simulation by wounding) initiates production of defense induction signais at the site of the damage. These signais then spread throughout the plant body and trigger off the systemic defense mechanisms (Metraux et al., 2002). The nature of these signais is not well understood, nonetheless sorne
factors influencing their movement are known. For instance, it is clear that signal transmission is limited by plant vascular architecture (Jones et al., 1993). The vascular architecture of trembling as pen is ortosticious, which me ans that a selected leaf alongside the stem is directly connected to the eighth leaf growing upward or downward from the selected one. These leaves share direct vascular connection, and, thus, signal transmission among these leaves is not limited by vascular connectivity. Moreover, it has been demonstrated that the movement of the defense induction signais is influenced by the source and sink relationship within the plant body (Arnold et al., 2004; Arnold and Schultz, 2002). As fast growing young leaves at the top of stems represent the strongest sinks for assimilates, strong systemic defense induction was detected particularly in these leaves. However, herbivory feeding modifies the flow of assimilates through the plant body partially diverting carbohydrates to roots (Babst et al., 2005; Babst et al., 2008).
Provided that sorne herbivore damage occurred in a stand of a clonai plant species like aspens, the defense induction signal might be transmitted from the tree under attack to intact trees through their integrated root system (Stuefer et al., 2004). Thus, the trees that have not been damaged so far might activate their defense mechanisms before the arrivai of the herbivores. Such defense signaling was experimentally tested in the third chapter.
METHODS
With the aid of forestry maps established for the region in the archive of Nordbord Company, we found three pure aspen stands of sucker origin aged 20 - 45 years and having a high density of stems. One study plot of approximately 30 m2
trees within these plots were genotyped usmg a set of microsatellite markers (Dayanandan et al., 1998; Rahman et al., 2000; Wyman et al., 2003; Namroud et al,
2005a, 2005b). In the first chapter, aspen trees within these plots were characterized
with respect to spring phenology ( appearance of the first full y expanded leaves) and bark features. Eight intact leaves from every tree were collected for an analysis of leaf shape. The leaf shape was assessed quantitatively using elliptic Fourier descriptors. In the second chapter, the three plots were excavated and the uncovered root systems were mapped. The roots forming grafts and the living roots on dead stumps were genotyped using the set of microsatellites. Cross-sectional disks of all principal roots, root grafts, and stems were taken. Dendrochronological analysis was used to distinguish the root types (new and mother roots) and date the formation of root grafts. In the third chapter, we conducted a green house experiment. We cultivated root cuttings of a single genotype originating from the mixed boreal forest of northwestem Quebec under the conditions promoting root suckering. Root suckers were used to follow the expression of two induced antiherbivore defense traits, Kunitz trypsin inhibitor and dihydroflavonol reductase. Their expression was followed after a wound treatment simulating insect herbivory in systemic (unwounded) leaves of wounded and untreated suckers and in controls.
OBJECTIVES AND EXPERIMENTAL APPROACH
The general aim of this thesis was to investigate a novel approach of aspen clonai identification and to explore possible functions of aspen clonai networks in diversity maintenance and inter-ramet communication. To meet the objectives, we employed an automated image processing of leaf shape, molecular and dendrochronological approach for studying aspen root systems, and quantitative real-time PCR to follow gene expression in interconnected aspen ramets. The second and
third chapters of this the sis have be en published as re se arch papers in peer-reviewed joumals. The first chapter is now being evaluated by anonymous reviewers.
Chapter 1: H Jelînkova, F Tremblay, A DesRochers. The use of digitalmorphometrics and spring phenology for clone recognition in trembling aspen (Populus tremuloides Michx.) and its comparison to microsatellite markers. Submitted.
In this chapter, we investigated a novel method for clone identification using complex evaluation of leaf shape, bark characteristics, and spring phenology. H. Jelinkova did sampling in the study sites, genotyping using microsatellites in the laboratory, analysis of leaf shape from data acquisition to statistical analysis, and wrote the manuscript. Dr. Tremblay and Dr. Des Rochers set the framework of the research and experimental approach and edited the manuscript.
Chapter 2: H Jelinkova, F Tremblay, A DesRochers (2009). Molecular and dendrochronological analysis of natural root grafting in Populus
tremuloides (Salicaceae) . American Journal ofBotany 96: 1500-1505.
In this chapter, we explored a possible mechanism of clonai diversity maintenance through genotype conservation in aspen root system. H Jelînkova participated in site excavation, mappmg and sampling, conducted the molecular and dendrochronological analyses, and wrote the manuscript. Dr. Tremblay and Dr. DesRochers set the framework of the research and experimental approach, contributed to the hypothesis definition, and edited the manuscript.
Chapter 3: H Jelînkova, F Tremblay, A DesRochers (2012). Herbivore-simulated induction of defenses in clonai networks of trembling as pen (Populus
tremuloides). Tree Physiology 32 : 1348-1356.
In this chapter, we explored defense responses to herbivory simulation in interconnected aspen ramet. H Jelînkova conducted the stress treatment, sampling,
real-time PCR assays in the laboratory, analyzed the data and wrote the manuscript. Dr. Tremblay and Dr. DesRochers set the framework of the research and experimental approach and edited the manuscript.
CHAPTERI
THE USE OF DIGITAL MORPHOMETRICS AND SPRING PHENOLOGY FOR CLONE RECOGNITION IN TREMBLING ASPEN (POP UL US
TREMULOIDESMICHX.) AND ITS COMPARISON TO
1.1 RÉSUMÉ
Les clones de tremble ont traditionnellement été identifiés sur la base des similarités des caractères phénotypiques, y compris la forme des feuilles. Cela nécessitait plusieurs visites des stations, de nombreuses mesures et évaluations visuelles subjectives. Dans cette étude, nous avons examiné une nouvelle approche pour l'identification des clones en utilisant respectivement la morphométrie digitale de la forme des feuilles, les caractéristiques de 1 'écorce et la phénologie printanière. Les clones de tremble ont été délimités selon leur caractéristiques moléculaires (marqueurs microsatellites), morphologiques (forme des feuilles, couleur et type d'écorce) et phénologiques (temps de débourrement). Les feuilles ont été scannées et les images analysées en utilisant les descripteurs Fourier normalisés (nEFDs) et l'analyse en composantes principales. Le pouvoir discriminant des nEFDs a été testé par l'analyse canonique des variables (CVA). Nous avons identifié 18 clones parmi les 60 tiges analysées sur les trois stations. L'analyse de regroupement des variables de la forme des feuilles a permis d'unifier des types foliaires similaires dans deux sites qui correspondaient aux clones définis par les marqueurs microsatellites. Toutefois plusieurs ramets de la troisièm e station n'ont pas été identifiés correctement. Le test de reclassem ent indique que la forme des feuilles contient des fonctions suivant lesquelles les clones t rès similaires peuvent être différenciés avec des faibles taux d'erreur. Cependant, comme il n'était pas possible de fixer un seuil pour les distances maximales à l 'intérieur des clones, l'application de cette approche d' identification dans les peuplements naturels de peupliers avec un nombre élevé de clones multi-ramets et beaucoup de génotypes uniques est irréalisable. Parmi les critères examinés, la phénologie printanière semble le caract ère le m oins fiable pour la reconnaissance des clones. Les causes possibles du débourrement hétérogène parmi les ramets du m ême génotype sont discutées
1.2 ABSTRACT
Aspen clones were traditionally identified based on similarities in several phenotypic traits including leaf shape. This required several visits of the stands, laborious measurements and subjective visual assessments. In this study, we investigated a novel approach to clone identification using digital morphometrics of leaf shape complemented with bark characteristics and spring phenology. Aspen clones were delineated based on molecular (microsatellite loci), morphological (leaf shape, bark colour and type) and phenological (timing of leaf out) characteristics. Leaves were scanned and images were analyzed using normalized elliptic Fourier descriptors (nEFDs) and principal component analysis. Discriminatory power of nEFDs was tested by canonical variates analysis (CVA).We identified 18 clones among 60 aspen trees in the three sites. Cluster analysis of the leaf shape variables grouped together similar foliar types that in two out of the three sites reflected the clones defined by a set of microsatellite markers. Many ramets from the third site were clustered erroneously into incorrect clones. The reclassification test indicated that leaf shape contains features according to which very similar clones can be differentiated with low error rates. However, because it was not possible to set a threshold for maximum distances within clones, application of this approach of clone identification in natural aspen stands with a high number of multi-ramet clones and many singletons is unfeasible. We judged spring phenology as the least reliable trait for clone recognition and suggested possible causes of heterogeneous leaf flushing among ramets ofthe same genotype.
1.3 INTRODUCTION
N atural populations of as pen exhibit a donal growth as an admixture of clones of several ramets and singletons (Scrosati, 2002). Identification of clones was traditionally based on the morphological characteristics such as floral, foliar, stem, and bark traits, growth form, and susceptibility to diseases or injuries (Bames, 1966; Bames, 1969; Bames andand Han, 1993). A putative large aspen clone consisting of 47 000 ramets was identified in this way by Kemperman and Bames (1976). However, when molecular markers were used, many distinct genotypes were found in and around the "pando" clone (Mock et al., 2008). Morphological characterization for donal identification was quickly abandoned mainly for two reasons: Firstly, evaluation of sorne phenotypic traits such as leaf shape appeared too subjective to be reliable. Secondly, many phenotypic traits are likely to be influenced by environmental factors (Pers son and Gustavsson, 200 1; Rumpunen and Bartish, 2002; Lopez-de-Heredia et al. , 2004). Renee, after the discovery of molecular markers, morphological identification of intermingling clones in aspen stands was quickly replaced by an almost exclusive use of a set of microsatellites (Wyman et al., 2003; Namroud et al., 2005; Suvanto and Latva-Karjanmaa, 2005; Mock et al., 2008; De Woody et al., 2009; Jelinkova et al., 2009; Liesebach et al., 2010).
N onetheless, recent advances in morphometrics, in particular automated image processing, brought new possibilities for genotype recognition that could help overcome the above mentioned disadvantages of morphological traits assessment. For instance, there is an array of new methods for analyses of biological shapes (McLellan and Endler, 1998; Jensen et al., 2002a; Neto et al., 2006 ; Viscosi and Fortini, 2011; Cope et al., 2012). They have been primarily developed for the needs of taxonomists to give an objective, quantitative shape evaluation. Among a number of descriptor suits that have been proposed, elliptic Fourier descriptors (EFDs) have proved especially useful in a variety of contexts in several plant species (Mancuso,
1999; lwata et al., 2002a; Rumpunen and Bartish, 2002; Yoshioka et al., 2004; Neto
et al., 2006; Menesatti et al., 2008; Torres et al., 2008; Viscosi and Fortini, 2011).
Elliptic Fourier descriptors (EFDs) can delineate any type of shape with a closed two-dimensional contour and are sensitive to both subtle and complex changes in a specimen's outline (Kuhl, 1982; McLellan and Endler, 1998). They have been shown to be more efficient in assigning plant material to correct clones (Persson and Gustavsson, 2001; Rumpunen and Bartish, 2002; Cope et al., 2012). Availability of software packages such as LAMINA or SHAPE makes the leaf shape assessment easy, fast, and inexpensive (Iwata and Ukai, 2002; Bylesjo et al., 2008). Renee, unlike molecular markers, leaf shape could be used as an inexpensive marker for early clone identification in situ during a single field visit.
Besicles the need for an objective evaluation, clone identification also requires a selection of phenotypic characteristics that exhibit low sensitivity to environmental effects. Development of leaf shape and size is a highly complex process under the control of many genes which is further modulated by hormonal and environmental factors (Wu et al., 1997; Wu, 2000). Although leaf size can be conditioned by environmental factors (such as light exposure or water availability) leaf shape is usually less affected; Iwata et al. (2002b) tested genotype x environment interactions in a field trial of citrus and showed that the genotype was the main source of variation in leaf shape, but not in size. A study of European aspen (Populus tremula) also indicated that the genotype influence was smaller for size than for shape related traits (Lopez-de-Heredia et al., 2004). Moreover, leaf shape can be described by symmetrical and asymmetrical features. It has been shown that symmetrical features are highly heritable while the asymmetrical ones are consequences of environmental effects. The two types can be devided and analyzed separately (Iwata et al., 2002; Iwata and Ukai, 2002).
Studies employing both molecular and morphological markers are rare in forest tree species (Cannon and Manos, 2001; Jensen et al., 2002b; Penaloza-Ramirez et al., 2010) and ingenus Populus in particular (Lopez-de-Heredia et al., 2004; Suvanto and Latva-Karjanmaa, 2005; Lexer et al., 2009). In the present study we investigated a method for clone recognition that could be used in a variety of contexts of ecological research, in studies of genotype-phenotype correlation, or in selection and identification of breeding material. The tested method employed image analysis of leaf shape complemented with bark characteristics and spring phenology. We compare our results with clones identified with a commonly used set of microsatellite markers. To our knowledge, there is neither previous study applying digital morphometric to aspen nor study comparing morphological and microsatellite markers.
1.4 MATERIALS AND METHODS
1.4.1 Study Sites
Aspen clones were delineated based on molecular (microsatellite loci), morphological (leaf shape, bark color and type) and phenological (timing of leaf out) characteristics in three natural stands in the southem boreal forest in northwest Quebec, Canada. The three sites (K, M, W) consisted of pure even-aged trembling aspen forest that regenerated after clear cuts in 1983, 1968, and 1964, respectively. The area stretches from 48° 11' N to 48°30' N of latitudes and from 78°45' W to 79°23' W of longitudes. A plot of 30 m2 encompassing 33, 17, and 18 aspen trees,
respectively was established at each site.
1.4.2 Microsatellite Characteristics
Bark sample was taken from every stem within the plots for DNA extraction. DNA was extracted from cambial tissue with the help ofthe GenElute Plant Genomic
DNA Miniprep Kit (Sigma-Aldrich Canada Ltd, Oakville, Canada) according to the manufacturer's protocol. Amplification of seven microsatellite loci (Dayanandan et al., 1998; Rahman et al., 2000) was clone using dye-labeled oligonucleotide primers and Taq polymerase (Gibco, Invitrogen™ Life Technologies, Burlington, Canada). For more details on the protocol see Jelinkova et al. (Jelinkova et al., 2009). In order to determine the resolution power of the set of microsatellites used, the round robin method was employed (for more details, see chapter 2.2.4 page 60).
1.4.3 Leaf Shape Description
Leaves were collected from the mid-position in the crowns and from the same position on the branch (the oldest fully expanded leaf). Eight healthy leaves with perfectly preserved contours were taken from every tree. Petioles were removed and the blades were pressed. The image analysis was conducted with the software package SHAPE v1.2 (Iwata and Ukai, 2002) using elliptic Fourier coefficients (Kuhl, 1982). Precision of contour description increases with increasing number of harmonies (trigonometrie fun etions describing the shape). As clonai differences in leaf shape can be minor, in particular when attempting to differentiate clones growing in close proximity, a series of elliptic Fourier transformations employing 20, 40, and 80 harmonies were used in this study. The elliptic Fourier descriptors (EFDs) were manually normalized to be invariant in size, thus the size component of the variation was excluded from the analysis (Kuhl and Giardina, 1982). Moreover, only components describing the symmetrical features of the leaf shape were analyzed.
1.4.4 Leaf Shape Analysis
In order to summarize the information contained in normalized EFDs (nEFDs) and to reduce the number of variables describing every leaf, principal component analysis (PCA) was performed based on a variance-covariance matrix of nEFDs in SHAPE v l.2 (Iwata and Ukai, 2002). The variation in leaf shape accounted for by
every principal component score (PC) was visualized by letting the score be equal to the mean plus and minus two times the standard deviation and the remaining components be zero. A following inverse Fourier transformation allowed reconstruction of the mean shape and its variation described by every PC (FUR UTA
et al., 1995). Separate PCAs and subsequent inverse Fourier transformations also
allowed for reconstruction of mean leaf shapes of clones defined by microsatellite markers.
Principal components were used as input variables for a cluster analysis using the unweighted pair-group method of averages (UPGMA) to generate dendrograms. Averages of the principal component scores were calculated from 8 leaves of every tree prior to the clustering ( clustering was, hence, based on an average leaf shape of every ramet).
Canonical variates analyses (CV A) were used to partition morphometric diversity into within- and between- clone and tree components. CV A provides a measure, Wilks' lambda (À), that gives a proportion of the total diversity that is due to within-group variation. Within-group replicates were 424 leaves and the groups were successively defined as 12 clones and 54 ramets obtaining Àclone and /..ramet, respectively. 1 - À-clones expresses between clone components and À-clones ~ Àramet between ramet components. Analyses were clone separately for PCs calculated from nEFDs based on 20, 40, and 80 harmonies.
To test the discriminatory power of the EFDs, a classification test reassigning ramets defined by leaf averages of canonical variates (CVs) into clones identified by molecular markers was also executed. As 8 leaves were available for every tree, four leaves were used as reference samples and four as test samples. Clones represented by only one ramet were excluded from this analysis as grouping of single trees is not feasible. Clustering, tree reconstruction, CV A, and reclassification tests were clone
with commands CLUSTER, TREE, CANDISC, and DISCRIM in SAS v9.1 (SAS Institute, Cary, NC).
1.4.5 Phenological and Bark Characteristics
The plots were visited once every five days during the period of leaf flushing and dates were taken when the first fully expanded leaves appeared. Every trunk was assessed visually for the color of the bark. Bark texture was evaluated as either smooth or rough.
1.5RESULTS
1.5.1lVI:icrosatellite Characteristics
The seven microsatellite markers distinguished 18 clones among 60 aspen trees in the three sites. Six clones were represented by only one ramet. Average clonai size was 3.8 ramets and the largest clone comprised 13 ramets. The resolution power of the used set of microsatellites was high. Probability of misclassification of two different clones as one was lower than 0,01 in all clones in all sites.
1.5.2 Leaf Shape Characteristics
PCA of nEFDs identified several independent features of leaf shape variation (Fig.1.1 ). An increased number of harmonies resulted in a higher number of PCs (Table 1.1 ). Nevertheless, the cumulative contribution of the first two components accounted for over 93% of the total variance. Gaining additional PCs when employing 80 harmonies led to an increase of the total variance contained within the PCs by only 4.1%. Corresponding PCs (calculated from 20, 40, and 80 harmonies) had similar contributions to the total explained variance and seemed to reflect similar characteristics of leaf shape variation wh en the reconstructed contours were evaluated visually (Fig. 1.1 shows contour reconstruction of the first 5 PC scores for 80
hannonics only). PCA six first axes left out 2.7% of the diversity conveyed by nEFDs.
Figure 1.1 Contour reconstruction by inverse Fourier transformation showing the effect of the first five principal component scores calculated from 80 harmonies.
Second, third, and fourth column depict the cases when the scores take -2 standard deviations, mean, and +2 standard deviations. The three contours are overlaid in the
first column. P C 1 P C 2 P C 3 P C 4 P C 6 ....2S O + 2S O
oooo
0 0 0 0
0 0 0 0
0 0 0 0
0 0 0 0
Leaf shapes reconstructed by inverse Fourier transformations indicated that the first PC was a good measure of the length to width ratio (Fig.1.1 ). It accounted for over 80% of the total variation of the original coefficients (Table 1.1 ). The second component was associated with the shape of apex that varied from pointed to flat and accounted for over 6% of the total variation. It also expressed the shape of blade base
that diverged between flat and domed. The remaining components comprising less than 3% of variation each were ascribed to other types of variation which were more difficult to explain.
Means and standard deviations of PCs based on nEFDs for 80 harmonies were calculated for the 12 multi-ramet aspen clones identified by microsatellite markers in three sites. The mean leaf shape of every clone was then drawn using the inverse Fourier transformations of these values (Fig. 1.2). Scatter plots of the within-ramet means of the first two PCs indicate variation both within and between clones and suggest possible grouping of individuals into groups (Fig. 1.3). Information contained within all PC scores is summarized by cluster analysis dendrograms in Figure 1.4.
The morphological variation described by nEFDs for 20, 40, and 80 harmonies was further subjected to the canonical variates analyses (CV As). All Wilks' lambdas (À) were significant at P=0.05 (Table 1.2). By using a higher number of harmonies and, hence, improving the precision of extracted leaf contours, a growing part ofthe total morphological variation was attributed to the between clone component while the foliar diversity between ramets within clones and among leaves of individual ramets had a tendency to diminish. For 80 harmonies, less than 1% of variation was found within individual trees (Table 1.2).
CV As created linear discrimination functions that combined all input features used and presented them as new canonical variables. Microsatellite-defined clones were used as groups and mean ramet shapes (reference samples calculated from four leaves of every tree) as replicates. Clone discriminant functions were validated by reclassifying all ramets (test samples represented by means calculated from four other leaves of every ramet) to their most probable clones (Table 1.3). Eighty-seven, 93, and 96% of all aspen ramets from multi-ramet clones were correctly reassigned when using clone discriminant variables calculated from nEFDs for 20, 40, and 80
hannonics, respectively. Percentages of correctly reassigned ramets were high for most genets with the exception of KF and KI that could not be discriminated according to leaf morphology.
Table 1.1 Eigenvalues and contributions of principal components calculated from normalized elliptic Fourier descriptors based on 20, 40, and 80 harmonies.
Eigenvalue [10 ] Proportion [%] Cumulative[%]
Nb. of harmonies Nb. of harmonies Nb. ofharmonies
PC 20 40 80 20 40 80 20 40 80 72.0 67.0 68.0 86.7 84.8 84.9 86.7 84.8 84.9 2 5.4 5.6 5.8 6.6 7.1 7.3 93.2 92.0 92.3 3 2 .1 1. 8 2.7 2.2 94.7 94.5 4 1.1 1.1 1.4 1.4 96.02 95 .9 5 0.58 0.7 96.6 6 0.53 0.7 97.3
Figure 1.2 Mean leaf shapes of the 12 multi-ramet aspen clones identi:fied by the microsatellite markers, single ramets clones are not included in this figure. Clones are
marked by the letters; A), B), and C) show mean leaf shapes of clones from sites M, K, and W, respectively. A - ~-~·, ... / ... ~-- -. ··", ./ "'/ '\ MB ~' ( MD :' '··._.-' "'/ ... .... ...___.,.-"·· . - -~,..,. ' ... , ,/-""'····"···~ ... · .. ' / / ·, , ( K A ": / .,
\
\ ' KB \c
K Dc
KE ) B) 1 1 /'
~ / ,..,: ' / ' ' ... /- - · / ,, ' · -... - ·-'" . ... ' •' / 'Figure 1.3 Scatter-plots ofwithin-ramet means ofthe first and second principal component based on nEFDs for 80 harmonies.
SiteW 0,04 0,03 0,02 "' u
..
0,01 -0,15 -0 ,10 -0,05 0, 0 c OD5 0,10 0,15 0 0 0 -0,01 0 c -0,02 PCI jo WA•IMll
.... u ... -0,1 5 -0 ,15 ô ô ô -0,1 0 x -0 ,10
..
SiteM 0.03 0~2 0,02 ""' 0,01 0,01 -0,05 0, 0 0 ,05 -0,01 -0.01 -0,02 -0,02 -0.03 PCl 1 t> MA o M3 • M: o MD • M: 1 -O,Ct<i Site K 0 .06 0 ,04 . 0 .02•
*'
0 , 0 -0 ,02 -0 ,04 -0 ,06 P Cl x•
0,10 0,1 5 0 ,10•
•
•
1• KA <> KB o KC o KD 6 KE x KF • KI + KG .o KJ KK • KH 1 0,20 0, 15Figure 1.4 Cluster analysis dendrograms derived from a matrix of mean Euclidian distances based on PCs calculated from nEFDs for 80 harmonies. Outliers are marked by arrows. Clones defined by microsatellite markers are underlined. A) site M, B) site
W, C) site K. D ' 1.5 s 1.0 t e n 0.5 0.0 1 . !>0 : 1.25
.
• ! 1 .00.
0 . 75 ,. 0 .5() t O .i!~ 0 .00 A) Site Mnll l
lllcW l Ncl<8 lllcUII J!lciJii! lllcU3 Nct.IS lllcU l Oo MciJS: lllc Uiô McU7 lllc iJ1 2 ncU 13 fllci.JI4 l>tclollE; fllcU3 0 Nc i.J31
Tr ee_N,..,.,
---
MAB)
ME
---
MB-
MC M D-A&I2Z f"U32 AW2E ~W34 AW38 Al.l2!3 Al429 AN 39 f'IW40 ftW28 AW31 AWXI AW24 All2 7 Al437 AW35 ,.,_1.130
Tree_Name
2 C) 0 trees 27 34 44 51 42 55 39 40 43 47 58 49 57 62 48 28 33 65 63 35 59 52 37 60 61 36 45
---clones D C 1 F D G F H F B K A E A E D Jl
t t
t t
Table 1.2 Summary of canonical variates analyses of aspen leaf shape based on principal components of elliptic Fourier coefficients. Groups were successively defined as clones and ramets and individualleaves were used as replicates . All Wilks'
lambdas were significant (P<0.05). Partitioning ofthe total variation based on Wilks' À[%]
Site No. of between clones within clones between ramets within ramets
hrm. within sites (Act one) within clones (\Ramet)
K 20 88 .10 11. 90 7.65 4.25 40 95 .91 4.09 2.93 1.1 6 80 98 .54 1.46 1.30 0 .1 6 M 20 93 .21 6.79 5.02 1.77 40 94.67 5.33 4.09 1.24 80 97.17 2.83 2.53 0 .30 w 20 81.68 18.32 13.11 5 .21 40 81.08 18.92 15.51 3.4 1 80 86.54 13.46 12.54 0 .92
Table 1.3 Test of the discriminatory power of the EFDs. Ramets defined by leaf averages of CV s were reassigned into clones identified by molecular markers. Clone
discriminant variables were calculated from nEFDs for 20, 40, and 80 harmonies. Single-ramet clones were excluded from the analysis. This method of discrimination required prior knowledge of the clones and was not used as a main method for clone
identification.
...,
Hrm. :MA :tvfB :tviD :ME WA WB KA KB KD KE KF KI
0 Ë ,--.._ ~ '-" trJ 20 0 0 0 100 8 0 0 33 33 0 0 100 13 '=1 0 ..., 40 0 0 0 0 0 0 0 33 0 0 0 100 6 ..., ~ (1) ,--.._ ~ '-" 80 0 0 0 0 0 0 0 0 0 0 0 100 4
~ 20 WA, :ME WB :MA KF
"'
(") 53" KI "'"'
~ 40 WB KF (1) p.."'
"' 80 KF1.5.3 Phenological and Bark Characteristics
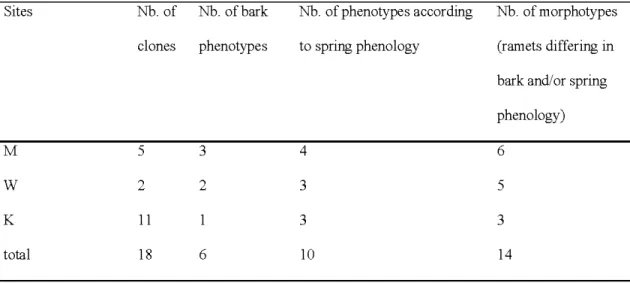
Based on bark color and texture, three, two, and one phenotypes were distinguished at sites M, W, and K, respectively (Table 1.4). Two morphologically similar clones at site M appeared genetically different when using a set of microsatellites. At site W, bark morphotypes matched the microsatellite-delineated clones. Ramets of all clones in site K were uniform in bark col or and type.
According to the timing of spring leaf flush, trees in sites M, W, and K were grouped into four, three, and three phenotypes, respectively (Table 1.4, Fig. 1.5). If bark and phenological characteristics were used together for clone identification, six, five, and three putative clones would have been distinguished. Groups defined by phenological features were not concordant with clones identified by microsatellite
markers. When comparing genetic identity and spring phenology, not all the ramets from microsatellite-defined clones produced leaves at the same time (Fig. 1. 5). Seven out of 12 multi-ramet clones identified by molecular markers were heterogeneous in the timing of leaf flushing. Almost one fourth of ramets from these clones flushed at different times. Figure 1. 5 show maps of sites W and K depicting leaf flush times and clones as defined by microsatellite markers. The picture also includes root maps (Jelinkova et al., 2009) showing that sorne differentially flushing ramets had root connections to other ramets of the same or different clones.
Table 1.4 Number of clones identified by microsatellite markers and number of morphotypes defined by spring phenology and bark characteristics.
Sites Nb. of Nb. ofbark Nb. of phenotypes according Nb. of morphotypes
clones phen otypes to spring phenology (ramets differing in
bark and/or spring
phenology)
M 5 3 4 6
w
2 2 3 5K 11 3 3
Figure 1. 5 Scheme of sites K and W showing the leaf out times and clones defined by microsatellite markers . The microsatellite-defined clones are marked by letters, single ramet clones are marked by empty circles. Fullline, dotted, and dashed circles mark the leaf out time: part A) fullline- 15 May, dotted- 24 May, dashed - after 24
May, B) fullline- before 19 May, dotted- 19 May, dashed- 23 May; Black arrows show root connections among ramets.
...
..
..
l··· .
..,.,J.. B .: ~ A: ... ....
·
...
fA}...
·
...
fA?...
,-,
,~,···~··
E •• A • ~....:
...
~.
,..-., : D } '-
1 ····"···...
fA~••....•
··
A),-;,
,_,
Q
1.6 DISCUSSION
Trembling aspen is noted for marked variations in leaf shape. Differences in leaf morphology were reported between populations across North America (Bames, 1966; Bames, 1969; Gom and Rood, 1999). Here, we demonstrated that even at a very fine scale, among trees growing in close proximity, quite a remarkable variation in leaf shape could be observed (Figs. 1.2 and 1.3). Most variation was contained by the first component expressing the blade width to length ratio and distance from the insertion point to the blade maximum width (Table 1.1, Fig. 1.1 ). These measures were traditionally included in morphometrics (Bames, 1966; Bames, 1969; Bames and Han, 1993; Suvanto and Latva-Karjanmaa, 2005) and were, thus, likely to capture a large proportion of the total variation. Other characteristics such as the shape of apex and base contained within the second component were traditionally assessed only cat egorically.
The automated quantitative leaf shape evaluation allowed us to make a quick assessment of 480 leaves from 60 trees in 3 sites. The cluster analysis grouped similar foliar types which in sites M and W corresponded to the clones defined by microsatellites (Fig. 1.4). Foliar morphology worked poorly in site K. We suppose that the lack of discriminatory power in this site was most likely caused by the juvenile character of the trees. This aspen stand was 23 years old and even though sorne trees produced catkins in the spring of the assessment, the trees were probably immature in sorne phenotypic traits. This was also supported by the fact the no difference in the bark type and color could be distinguished at this site (Table 1.4).
Even though the ramets from all the clones in the two mature sites were clustered correctly, in accordance with the microsatelite-defined clones, it was not possible to set a maximum value for distances within clones as a threshold for clone separation. For instance, according to the largest clone WA (Fig. 1.4B), this
maximum distance could be set to 0.6. However, under this precondition, clones MA and ME and MB, MC, MD would not be differenciated (Fig. 1.4A). On the other hand, setting this distance lower would divide the large clones W A and MA into a few other clones. This was a consequence of a varying range of leaf shape variability among clones and small distances separating the clones.
While less than 1% of leaf shape variation was located within ramets, over 12% of variation was observed among ramets at site W (Table 1.2). This indicated that there was either little within tree variation or it could be efficiently reduced by selection of leaves of the same age and from the same position in the crown. Small within plant component of leaf shape variation was also reported in other donal species by Rumpunen and Bartish (2002) in the genus Chaenomeles (Rosaceae) and
Persson and Gustavsson (2001) in lingonberry (Vaccinium vitis-idaea L). Their
observations indicated that leaf shape variation was little effected by environmental factors. Thus, little variation would be expected to be found among identical individuals. This should be particularly true when separating symmetrical and asymmetrical features of leaf shape variation as in this study since the asymmetrical component is more likely to be a consequence of environmental effects (lwata et al.,
2002b). Nonetheless, despite the exclusion of asymmetrical features from our analysis, the result showed that the among ramet proportion of leaf shape variation was not negligible. To finally clarify the genetic x environmental relationship, direct field trials would be needed.
When using EFDs, one has to decide how many harmonies should be used. Employing too few could result in low precision of contour extraction while using too many may le ad to introduction of random errors. Generally, from 10 to 40 harmonies were sufficient for most purposes of leaf shape analysis, however, up to 100 harmonies have also been used (McLellan and Endler, 1998; Mancuso, 1999; Persson and Gustavsson, 2001; Rumpunen and Bartish, 2002; Menesatti et al., 2008). We