Université de Montréal
Département de sciences biologiques, Faculté des Arts et des Sciences
Ce mémoire intitulé
Différenciation biotique de la flore des tourbières ombrotrophes du sud du Québec : une étude historique de 1982 à 2017
Présenté par
Nicolas Pinceloup
A été évalué par un jury composé des personnes suivantes
Alain Cuerrier Président-rapporteur Stéphanie Pellerin Directrice de recherche Monique Poulin Codirectrice Jacques Brodeur Membre du jury
i
Résumé
Ce mémoire vise à déterminer si les tourbières ombrotrophes des basses-terres du Saint-Laurent, qui sont isolées au sein d’une matrice paysagère fortement perturbée, ont subi une perte de diversité floristique au cours des trois dernières décennies. Pour répondre à cet objectif, une étude historique a été réalisée, et ce, en comparant des inventaires anciens et récents. Plus précisément, 76 parcelles d’inventaires échantillonnées en 1982 et réparties dans 16 tourbières ont été rééchantillonnées en 2017 en utilisant la même méthodologie. Pour cette étude, seule la flore vasculaire a fait l’objet d’analyses. Plus spécifiquement, j’ai comparé la richesse en espèces ainsi que l’abondance et la fréquence des différentes espèces, et ce, en tenant compte de leur tolérance à l’ombre et de leur habitat préférentiel (milieux humides, facultatifs ou terrestres). Finalement, les changements de diversité bêta ont été analysés et une décomposition de cette diversité bêta a permis d’identifier la composante principale du changement (changement de richesse ou remplacement des espèces). Mes résultats montrent une hausse importante de la diversité alpha et de la diversité bêta au cours des 35 années à l’étude, indiquant une différenciation taxonomique et un changement de la composition des communautés végétales. La hausse de la diversité alpha semble être principalement attribuable à l’augmentation en abondance et en fréquence des espèces tolérantes à l’ombre et des espèces facultatives des milieux humides. D’ailleurs, la hausse de la diversité bêta était principalement attribuable au remplacement des espèces dans le temps. Enfin, j’ai observé une augmentation de la couverture de plantes arbustives et arborescentes au cours des 35 dernières années. Bien que les causes exactes des changements observés dans mon étude n’aient pas été étudiées, mes résultats suggèrent un assèchement régional des tourbières qui serait attribuable au des terres agricoles environnantes et potentiellement exacerbé par les changements climatiques. Ceci laisse supposer que les changements observés se poursuivront dans le futur, et pourraient induire une perte future de la biodiversité du fait du remplacement des espèces tourbicoles par des espèces facultatives.
Mots clefs
ii
Abstract
This thesis aims at determining whether ombrotrophic peatlands from the St. Lawrence lowlands, which are isolated in a highly disturbed environmental matrix, have suffered a loss of floristic diversity in the last three decades. In order to achieve this objective, a historic floristic study was conducted, by comparing old and recent inventories. More precisely, 76 plots inside 16 bogs were surveyed in 1982, and resurveyed in 2017 using the same methodology. For this study, only the vascular flora was analyzed. More specifically, I compared species richness as well as species abundance and frequency, while considering their shade tolerance and preferential habitat (wetland, facultative or upland). Finally, beta diversity changes were analyzed, and a beta diversity decomposition was performed in order to identify the principal component of the changes. My results show a significant increase in alpha diversity and beta diversity in the last 35 years, indicating a taxonomic differentiation and a floristic community change. The increase in alpha diversity was associated with a change in abundance and frequency of shade tolerant species and facultative wetland species. Moreover, species replacement was the main factor linked to the beta diversity increase. At last, I observed an increase in shrub and tree species cover over the past 35 years. Although the exact causes of the observed changes were not studied, our results suggest a regional drying of the peatlands likely linked to agricultural drainage in the area, and potentially enhanced by climatic changes. Our results let me suppose that these changes will continue with time, which could lead to future loss of biodiversity in these ecosystems due to the replacement of bog species by facultative species.
Mots clefs
iii
Table des matières
Résumé ... i
Abstract ... ii
Liste des figures et tableaux ... v
Liste des annexes ... vi
Liste des sigles et des abréviations ... vi
Remerciements ... viii
Chapitre 1 : Introduction générale ... 1
1.1. Mise en contexte... 1
1.2. Homogénéisation biotique... 2
1.2.1. Différenciation biotique ... 3
1.2.2. Échelle d’étude ... 4
1.3. Homogénéisation en milieux humides ... 4
1.3.1. Les tourbières ... 5
1.3.2. Influence des perturbations humaines ... 6
1.3.3. Les tourbières des basses-terres du Saint-Laurent ... 7
1.4. Objectifs de l’étude ... 7
Chapitre 2 ... 9
2.1. Introduction ... 10
2.2. Methodology ... 12
2.2.1. Study area ... 12
2.2.2. Sampling and data collection ... 13
2.2.3. Data Analysis ... 14
2.3. Results ... 16
iv
2.3.2. Species frequency and abundance ... 18
2.3.3. Beta diversity ... 20
2.4. Discussion ... 21
2.4.1. Changes in plant environmental preferences ... 21
2.4.2. Beta diversity ... 23
2.4.3. Causes of the observed changes ... 23
2.4.4. Limits of long-term resurveys ... 24
2.4.5. Conclusion ... 25
2.5. Références ... 26
Chapitre 3 ... 36
3.1. Discussion générale ... 36
v
Liste des figures et tableaux
Figure 1. Location of the 16 temperate bogs studied in southern Québec………..……....12 Figure 2. Vascular taxa richness in 1982 and 2017. ……….…….….17 Figure 3. Richness of obligate, facultative-wetland and facultative taxa as well as shade
tolerant, mid-tolerant and intolerant species in 1982 and 2017. ……….18
Figure 4. Vascular plant taxa with significant changes in the frequency of occurrence
between 1982 and 2017.………...19
Figure 5. Vascular plant taxa mean cover in 2017 vs 1982.………....…………19 Figure 6. Effect of time on beta diversity of vascular plant taxa…………...……….20 Figure 7. Triangular plot of the relationship among the 76 plots in 1982 and 2017, and for
all pairs of plots between 1982 vs 2017, illustrating the contributions of three components of beta diversity. ………...…...…21
vi
Liste des annexes
S1 Appendix. Species name, shade-tolerance and wetland indicator status. ……….55 S2 Appendix. Plots with tree cover higher than 30% for at least one year.………....58
Liste des sigles et des abréviations
FAC : espèce facultative.
FACU : espèce facultative des milieux terrestres. FACW : espèce facultative des milieux humides. OBL : espèce obligatoire des milieux humides. UPL : espèce terrestre.
vii “Empty spaces - what are we living for?
Abandoned places - I guess we know the score
On and on! Does anybody know what we are looking for? Another hero - another mindless crime;
Behind the curtain, in the pantomime
Hold the line! Does anybody want to take it anymore? The show must go on! The show must go on! Yeah!
Inside my heart is breaking, my make-up may be flaking, but my smile, still, stays on! Whatever happens, I'll leave it all to chance;
Another heartache - another failed romance
On and on... Does anybody know what we are living for?
I guess I'm learning, I must be warmer now, I'll soon be turning, around the corner now. Outside the dawn is breaking, but inside in the dark I'm aching to be free!
The show must go on! The show must go on! Yeah, yeah!
Ooh! Inside my heart is breaking! My make-up may be flaking... But my smile, still, stays on! My soul is painted like the wings of butterflies;
Fairy tales of yesterday, will grow but never die I can fly, my friends! The show must go on! Yeah! The show must go on! I'll face it with a grin! I'm never giving in! On with the show!
I'll top the bill! I'll overkill! I have to find the will to carry on! On with the show! The show must go on.”
viii
Remerciements
C’est avec beaucoup d’humilité que je tiens à remercier Stéphanie Pellerin et Monique Poulin pour m’avoir permis d’effectuer ce travail de recherche. D’un travail de doctorat, nous avons finalement terminé sur une maitrise et je les remercie de m’avoir soutenu jusqu’au bout, dans la difficulté et avec patience et détermination.
Je tiens à remercier mes collègues de travail qui m’ont soutenu et encouragé et avec qui j’ai eu de belles discussions tout au long de nos parcours communs. Merci donc à Maya Favreau, Antoine Magnoux, Daniel Blouin, Michel Rapinski, Alexis Carteron et aux autres. Je remercie aussi mes aides de terrain Alexandra Moll et Élise Deschenes pour leur sérieux et leur courage dans les tourbières.
Du fond de mon cœur, je tiens à remercier Vanessa Grenier qui a été là dans les pires moments, mais aussi dans les meilleurs et qui a mon affection et ma reconnaissance. Un immense merci à une amie qui m’est chère, Gabrielle Lamontagne-Hallé, ma sœur d’adoption au Québec. J’aimerais adresser une pensée singulière aux camarades de rugby avec qui j’ai côtoyé les pelouses du Québec, des Carabins de l’Université de Montréal en passant par les Irish de Montréal et le Rugby Club de Montréal.
Je souhaite enfin remercier mes parents et mon frère sans qui rien n’aurait été possible, eux qui m’ont toujours poussé vers l’avant et qui ont cette confiance inébranlable en mes capacités envers et contre tout. Une dernière pensée pour ma grand-mère Simone Kieffer, née Fischesser, décédée le 15 novembre 2018, qui m’aura fait découvrir l’Afrique et montré l’amour des plantes à travers son jardin.
1
Chapitre 1 : Introduction générale
1.1. Mise en contexte
Les milieux humides sont menacés par des perturbations anthropiques diverses qui peuvent avoir un impact sur leur composition floristique (Frankl & Schmeidl, 2000; Pellerin & Lavoie, 2003b; Tousignant et al. 2010; Tahvanainen, 2011; Pasquet et al., 2015). Il a été estimé qu’à l’échelle mondiale, entre 64 et 71% des milieux humides ont été perdu au cours du 20ème siècle (Davidson et al., 2014; Gardner et al., 2015). Parmi les milieux
humides, les tourbières sont particulièrement menacées. Ces écosystèmes, qui se caractérisent par une accumulation de matière organique et un bilan hydrique positif (Clymo et al., 1998), couvrent près de 3% des surfaces terrestres de la planète (Joosten & Clark, 2002) et abritent une flore et une faune particulière et spécialisée (Vitt et al., 1995; Warner & Asada, 2006).
Les tourbières des basses-terres du Saint-Laurent au Québec sont isolées dans une matrice de paysage fortement anthropisée où les terres agricoles (50%) et les milieux urbains (10%) couvrent la majorité du territoire (Poulin et al., 2016). Depuis les années 90, environ 19% de leur superficie y aurait été perturbée (Poulin et al., 2016), et différentes études ont rapporté des changements importants au sein de leur flore (Pellerin et al., 2008; Pasquet et al., 2015; Favreau et al., 2019). Par exemple, Tousignant et al. (2010) ont montré que la richesse en espèces tourbicoles était négativement corrélée avec le couvert de perturbations anthropiques présent dans un rayon de 25 m pourtour des stations d’échantillonnage. Le boisement, le drainage agricole et l’augmentation des températures sont autant de menaces pour leur biodiversité (Eppinga et al., 2009).
L’impact des perturbations sur les tourbières ombrotrophes est un sujet relativement bien élaboré dans la littérature (e.g., Holden et al., 2006; Tousignant et al., 2010; Dise, 2009; Eppinga et al., 2009; Turetsky et al., 2015). Bien que ces écosystèmes soient généralement perçus comme possédant des communautés floristique relativement stables dans le temps (Benscotter & Vitt, 2008; Pedrotti et al., 2014), les perturbations anthropique telles que le drainage peuvent avoir des conséquences importantes comme l’augmentation de l’abondance et de la fréquence des espèces facultatives des tourbières et des espèces tolérantes à la sécheresse (Laine et al., 1995; Gunnarsson et al., 2002; Lachance et al., 2005; Pellerin et al., 2009; Tousignant et al., 2010; Kapfer et al., 2011; Pasquet et al.,
2
2015). De plus, l’assèchement de la tourbe peut favoriser l’envahissement par des espèces ligneuses (Berg et al., 2009; Eppinga et al., 2009), et provoquer une différenciation de la flore vasculaire de ces écosystèmes (Favreau et al., 2019). Plusieurs auteurs ont émis l’hypothèse que ce phénomène pourrait menacer la biodiversité régionale en rendant plus homogène la flore des tourbières à celle des milieux forestiers environnants (Laine et al., 1995; Lachance et al., 2005; Favreau et al., 2019).
Dans ce contexte, ce mémoire vise à mesurer les changements de diversité dans les tourbières ombrotrophes au cours des 35 dernières années. Plus spécifiquement, le présent travail vise à comprendre l’évolution de la diversité bêta et tester l’hypothèse d’une différenciation de la flore vasculaire de ces milieux. La suite de cette introduction présente une revue de la littérature sur le phénomène d’homogénéisation biotique et les perturbations en tourbières afin de mettre en contexte mon projet de maitrise.
1.2. Homogénéisation biotique
Les changements globaux dans le climat ainsi que dans l’utilisation des terres s’opèrent actuellement à un rythme sans précédent (Clavel et al., 2011; Song et al., 2018), modifiant les communautés végétales de façon importante (Eppinga et al., 2009; Tahvanainen, 2011). L’influence humaine prend le pas sur les facteurs naturels et modifie l’abondance des espèces (McGill et al., 2015; Pasquet et al., 2015), leur répartition (La Sorte & McKinney, 2006) et augmente les risques d’extinction (Sax & Gaines, 2008; Winter et al., 2009). À l’échelle mondiale, on assiste à une diminution de la biodiversité totale (diversité gamma) du fait de l’extinction des espèces (Sax & Gaines, 2003), associée à une perte de biodiversité par la simplification des communautés (diminution de la diversité bêta), un processus nommé homogénéisation biotique (Olden & LeRoy Poff, 2003; Olden & LeRoy Poff, 2006). Ce phénomène a été observé dans la majorité des groupes taxonomiques, dont les plantes vasculaires, les insectes et les oiseaux (Baiser et al., 2012). Ce phénomène pourrait avoir de graves conséquences pour le fonctionnement des écosystèmes (McKinney & Lockwood, 1999; Olden & LeRoy Poff, 2003; Olden & Rooney, 2006), leur résilience et leur adaptabilité aux changements climatiques (Olden & LeRoy Poff, 2004; Jump et al., 2005; Turetsky et al., 2012).
L’homogénéisation biotique correspond à l’augmentation de la similarité des espèces entre des communautés au cours du temps et est menée par deux processus : l’extinction d’espèces résidentes ainsi que l’introduction d’espèces (Rahel, 2002; Olden & LeRoy Poff,
3
2003; Olden, 2006). Ces deux processus sont facilités par les activités humaines et notamment : l’atténuation des barrières biogéographiques (océans, montagnes…) qui permet le déplacement des espèces végétales et animales au-delà de leurs aires de répartition naturelles, mais aussi la modification des habitats naturels qui provoque l’extinction locale des espèces et la perte de richesse spécifique (Newbold et al., 2015). À l’origine des travaux sur l’homogénéisation biotique, il était mis de l’avant que seules les espèces exotiques homogénéisaient les communautés (McKinney & Lockwood, 1999). Par exemple, il a été montré que l’introduction d’espèces exotiques de poissons de manière accidentelle et intentionnelle dans les milieux aquatiques d’Australie avait provoqué l’homogénéisation des assemblages piscicoles du continent (Olden et al. 2007). Toutefois, dans les communautés végétales, il a été montré que les espèces indigènes, souvent généralistes et tolérantes aux perturbations (i.e., espèces rudérales), peuvent aussi contribuer à l’homogénéisation (McKinney, 2004; McCune & Vellend, 2013; Brice et al., 2014). Par exemple, en étudiant plus de 100 parcelles dans une forêt d’un parc suburbain du sud du Québec, Beauvais et al. (2016) ont observé sur une période de 35 ans, un déclin significatif de la diversité bêta (30%) alors que la richesse spécifique en espèces indigènes avait triplé au cours de la même période. En étudiant des communautés végétales de différentes localités aux États-Unis, McKinney (2004) a montré que les espèces exotiques avaient tendance à créer une différenciation des communautés plutôt qu’une homogénéisation mais que ce patron était influencé par la richesse des espèces exotiques.
1.2.1. Différenciation biotique
De manière générale, un processus d’homogénéisation des communautés de plusieurs groupes taxonomiques (poissons, oiseaux, mammifères etc.) se produit présentement à travers le globe. Toutefois, les patrons d’introduction et d’extirpation des espèces peuvent aussi mener à la différenciation biotique, phénomène où la diversité bêta augmente dans le temps ou dans l’espace (Olden & LeRoy Poff, 2003; Cassey et al., 2007). La différenciation biotique a été observée le plus souvent à l’échelle locale lorsque l’introduction de plusieurs espèces exotiques surpasse la perte d’espèces indigènes ou lorsque les perturbations augmentent l’hétérogénéité des habitats au sein des écosystèmes (Olden & LeRoy Poff, 2003; Qian et al., 2008; Gong et al., 2013; Petsch, 2016). Ce phénomène a été documenté dans plusieurs écosystèmes aquatiques à une échelle régionale après l’introduction idiosyncrasique d’espèces exotiques (Taylor, 2004; Rahel, 2010), mais
4
aussi dans la couche herbacée d’une forêt tempérée le long d’un gradient environnemental d’humidité du sol, d’acidité et de fertilité (Durak & Holeska, 2015; Durak & Durak, 2016). Ce phénomène de différenciation biotique a aussi été observé dans les tourbières, où une augmentation du nombre d’espèces facultatives de ces milieux, accompagnée par une augmentation de la couverture d’espèces ligneuses, a rendu les communautés des sites nouvellement boisés plus différentes les unes des autres (Favreau et al., 2019).
1.2.2. Échelle d’étude
Les processus d’homogénéisation et de différenciation biotique dépendent fortement de l’échelle spatiale des études (Olden & LeRoy Poff, 2003; Sax & Gaines, 2003 ; McGill et al. 2015). En effet, le nombre d’espèces introduites ou extirpées que l’on observe au cours du temps dépend de l’étendue de territoire considéré. À l’échelle mondiale ou continentale, on observe généralement une homogénéisation biotique des communautés pour de nombreux taxa (Aronson et al., 2014; La Sorte et al., 2014). Ainsi, l’homogénéisation des communautés est la conséquence de la disparition des espèces indigènes spécialistes et rares, remplacées par des espèces généralistes avec de larges aires de répartitions (McKinney & Lockwood, 1999). En diminuant l’échelle d’étude, il devient plus probable d’observer un processus de différenciation puisque les chances d’observer des espèces rares et exotiques augmente. C’est ce qui a été observé par exemple en Californie, où l’introduction d’espèces de poissons exotiques depuis les deux cents dernières années a produit des patrons de différenciation entre les communautés locales mais de l’homogénéisation à l’échelle régionale (Marchetti et al., 2001). En ce qui concerne la flore, des patrons similaires en fonctions de l’échelle ont été montré, c’est-à-dire une homogénéisation biotique à l’échelle régionale (McCune & Vellend, 2013), tandis qu’à l’échelle locale on observe de la différenciation biotique (Sax & Gaines, 2003; Kühn & Klotz, 2006; Marchetti et al., 2006).
1.3. Homogénéisation en milieux humides
La flore des milieux humides est généralement plus homogène que celle des milieux terrestres, et ce, tant à l’échelle locale que continentale (Qian & Guo, 2010). Cette similarité floristique entre les différents milieux humides est principalement attribuable aux conditions environnementales très stressantes présentes dans ce type d’écosystème, et que seule une gamme relativement restreinte de plantes peuvent tolérer (Barret et al., 1993; Santamaría, 2002; Price et al., 2018). Ces espèces sont généralement caractérisées par une
5
capacité de dispersion élevée, une multiplication clonale et une tolérance au stress qui leur permettent de se propager sur de longues distances tout en résistant aux conditions environnementales et de survivre de manière clonale en cas d’isolement (Santamaría, 2002; Sosnová et al., 2010). En raison du nombre limité d’espèces vasculaires retrouvées en milieux humides, ces milieux pourraient être particulièrement susceptibles au processus de différenciation biotique par l’introduction aléatoire d’espèces exotiques ou par l’augmentation de l’aire de répartition d’espèces cosmopolites (Olden & LeRoy Poff, 2003). Au contraire, des perturbations créant une homogénéisation des conditions abiotiques de ces milieux à l’échelle régionale, comme par la création de barrages, favoriserait l’homogénéisation biotique (Rahel, 2007; Price et al., 2018). Toutefois, bien que les milieux humides soient parmi les écosystèmes les plus perturbés et menacés mondialement (Millenium Ecosystem Assesment, 2005), peu d’études ont évalué l’influence de perturbations directes ou indirectes sur le processus d’homogénéisation biotique de leurs communautés végétales (e.g., Lougheed et al., 2008). Parmi ces études, Price et al. (2018) ont observé une homogénéisation biotique au cours du temps dans les communautés d’herbes émergentes de milieux humides palustres de l’Illinois (USA). Ce processus était associé à la présence et à l’abondance de Phalaris arundinacea, une espèce exotique, et au déclin de nombreuses autres espèces indigènes et même exotiques. D’un autre côté, Brice et al. (2017) ont observé une différenciation biotique dans la communauté herbacée de marécages urbains riverains du fait, entre autres, de l’augmentation de l’hétérogénéité de l’habitat. De manière similaire, un processus de différenciation biotique dans les communautés de macrophytes des plaines inondables exposées à l’influence humaine a été observé en Chine (Zhang et al., 2018).
1.3.1. Les tourbières
Les tourbières sont des milieux humides formés par l’accumulation de matière organique (production primaire nette supérieure à la décomposition) et une capacité de drainage faible (Glaser & Janssens, 1986; Payette & Rochefort, 2001). Elles couvrent approximativement 3% de la surface terrestre de la Terre (Joosten & Clarke, 2002), mais représentent un des plus importants puits de carbone existant avec un tiers de la réserve globale, soit entre 455 et 547 gigatonnes de carbone selon les estimations (Gorham, 1991; Yu et al., 2010). Elles sont présentes sur tous les continents et particulièrement dans la zone boréale où elles occupent des milieux auparavant couverts par la glace il y a 10,000 à 25,000 ans (Wieder & Vitt, 2006). Les tourbières ombrotrophes (aussi appelées « bog »)
6
sont des milieux humides approvisionnés en eau et minéraux uniquement par les précipitations (Vitt et al., 1994). Ce sont des milieux acides, pauvres en éléments minéraux (Vitt et al., 1990; Gorham & Janssens, 1992), contenant une végétation dominée par les espèces du genre Sphagnum.
1.3.2. Influence des perturbations humaines
Récemment, de nombreuses études ont rapporté des changements rapides de la végétation des tourbières ombrotrophes des suites de perturbations diverses telles que le drainage (Bellamy et al., 2012; Talbot et al., 2014), la fragmentation des habitats (Chapman & Rose, 1991; Pasquet et al., 2015), l’augmentation des dépositions atmosphériques azotées (Hedwall et al., 2017) ou la combinaison de plusieurs de ces facteurs (Pellerin & Lavoie, 2003b; Pellerin et al., 2008; Pasquet et al., 2015). Par exemple, le drainage favorise une augmentation de l’abondance des arbres, mais aussi des espèces tolérantes à l’ombre tout en diminuant le couvert des sphaignes (Laine et al., 1995; Frankl & Schmeidl, 2000; Pellerin et al., 2008).
L’augmentation de la fréquence, de l’abondance et de la biomasse des espèces ligneuses est un phénomène nommé boisement (ou « woody encroachment » en anglais; Frankl & Schmeidl, 2000; Freléchoux et al., 2000; Favreau et al., 2019). Ce phénomène s’accompagne d’une augmentation de la fréquence et de l’abondance d’espèces vasculaires facultatives des milieux humides (Gunnarsson et al., 2000; Pellerin et al., 2009; Kapfer et al., 2011; Pasquet et al., 2015) et d’espèces avec une tolérance plus élevée à la sècheresse et à l’ombrage (Laine et al., 1995; Gunnarsson et al., 2002; Lachance et al., 2005; Tousignant et al., 2010; Favreau et al., 2019). L’impact négatif du boisement sur la croissance des sphaignes en tourbière est bien connu (Laine et al., 1995; Limpens et al., 2003; Eppinga et al., 2009; Holmgren et al., 2015). Par exemple, dans des tourbières boisées par le pin sylvestre (Pinus sylvatica) ce dernier exclut les sphaignes après avoir atteint une taille suffisante, soit un diamètre supérieur à 10 cm, en modifiant localement les conditions du substrat (Ohlson et al., 2001). D’autre part, le boisement modifie différents facteurs abiotiques tels que l’évapotranspiration (Limpens et al., 2014) et les caractéristiques chimiques du sol par l’augmentation de l’apport en litière qui provoque une augmentation du pH, du carbone organique et de la conductivité électrique (Laiho et al., 2003; Wertebach et al., 2014; Ratcliffe et al., 2017). L’augmentation de l’abondance des arbres augmente aussi l’interception des précipitations qui, en plus de l’augmentation
7
de l’évapotranspiration, assèche progressivement la tourbe (Frankl & Schmeidl, 2000; Fay & Lavoie, 2009). Le boisement provoque une altération de la quantité de lumière reçu par les strates de végétation sous la canopée, une modification de la température et une altération de la disponibilité des nutriments et de l’eau (Limpens et al., 2014; Holmgren et al., 2015). Enfin, il modifie la diversité faunique et microbienne et peut aussi altérer les fonctions de ces écosystèmes (Lachance et al., 2005; Warren et al., 2007; Pasquet et al., 2015; Payne et al., 2016) dont la capture et mise en réserve du carbone (Heijmans et al., 2013; Limpens et al., 2014).
1.3.3. Les tourbières des basses-terres du Saint-Laurent
Les basses-terres du Saint-Laurent constituent la région la plus densément peuplée du Québec, avec une population avoisinant les 5 millions d’habitants (Statistiques Canada, 2017). Du fait d’un climat propice et de sols riches, cette région est fortement agricole (Jobin et al., 2004). En effet, près de la moitié de la surface est consacrée à l’agriculture, tandis qu’un tiers se compose de zones boisées. Les zones urbanisées représentent dix pourcents et les dix pourcents restants sont des milieux humides, dont 35% sont des tourbières ombrotrophes (Poulin et al., 2016). Cependant, les activités humaines telles que le drainage et l’agriculture, ont perturbés 19% de la superficie des milieux humides du secteur depuis les années 1990 (Poulin et al., 2016). Ces perturbations s’ajoutent aux pertes historiques depuis la colonisation du territoire par les européens, qui sont souvent évaluées à près de 80% (Joly et al., 2008; Gratton, 2010). Les tourbières non exploitées et exemptes de perturbations majeures subissent tout de même l’impact des activités anthropiques avoisinantes, qui se traduit notamment par un récent phénomène de boisement (Pellerin & Lavoie, 2003a, b; Favreau et al., 2019).
1.4. Objectifs de l’étude
Dans ce contexte, mon projet de recherche visait à étudier les changements de la flore vasculaire des tourbières ombrotrophes des basses-terres du Saint-Laurent au cours des dernières décennies à l’aide d’un rééchantillonnage d’inventaires floristiques historiques. Mon étude a porté sur des tourbières, ou secteurs de tourbières, exempts de perturbations directes visibles (extraction de tourbe, coupe forestières, etc.), mais pouvant tout de même être influencées par des perturbations ou stress indirects (drainage et modification d’usage des terres environnantes, réchauffement climatique, etc.). Ainsi, les questions explorées sont :
8
- Est-ce que la richesse, l’abondance et la fréquence des espèces vasculaires varient au cours du temps ?
- Est-ce qu’il y a eu un changement de composition ?
- Est-ce que la flore vasculaire s’y diversifie ou au contraire s’homogénéise ?
Mon hypothèse principale est que les bogs ont subi une différenciation biotique malgré l’absence de perturbations directes, ce qui qui révèle des changements dans les conditions environnementales. Plus spécifiquement, mes prédictions quant aux changements associés à la différenciation sont :
1) Une augmentation de la richesse des espèces vasculaires ;
2) Une augmentation de la richesse des espèces tolérantes à l’ombre et des espèces facultatives des milieux humides ;
9
Chapitre 2
to be submitted to Plos One
Vegetation changes in temperate ombrotrophic
peatlands, a 35-year study.
10
2.1. Introduction
Global changes in climate and land use are occurring at an unprecedented rate (Lindner et al., 2010; Song et al., 2018), often triggering drastic shifts in plant communities (Eppinga et al., 2009; Walker et al., 2006). The overriding influence of human activities on plant communities has been shown to induce modification in species abundance (McGill et al., 2015; Pasquet et al., 2015) and distribution (Sax et al., 2002; Smart et al., 2006), and to increase the risk of population extinction (Sax & Gaines, 2008; Winter et al., 2009). At a global scale, such changes have most often been associated with biodiversity loss through the simplification of communities (decrease of beta diversity), a process called biotic homogenization (McKinney & Lockwood, 1999; Olden & LeRoy Poff, 2003; Olden & Rooney, 2006). Biotic homogenization usually occurs when exotic or ruderal species replace specialist native species (McKinney & Lockwood, 1999; McCune & Vellend, 2013; Zeeman et al., 2017). Nevertheless, local species invasions and extinctions are not necessarily causally related and can follow complex pathways that can also lead to biotic differentiation (increase in beta diversity) or even induce no change of beta diversity. Biotic differentiation has mostly been observed at local scales when the introduction of numerous exotic species outweighs the loss of natives or when disturbances increase habitat heterogeneity thus promoting the introduction of various different species (Olden & LeRoy Poff, 2003; Qian et al., 2008; Gong et al.,2013; Petsch, 2016).
Wetland flora are usually more homogeneous than terrestrial flora at local and continental scales (Santamaría, 2002; Qian & Guo, 2010). This natural low level of beta diversity within and among sites is likely related, among others, to the uniformity of stressful environmental conditions found in wetlands that can be tolerated by only a small set of specialized species (Barret et al., 1993; Santamaría, 2002; Colmer & Voesenek, 2009). Despite wetlands being among the most disturbed ecosystems in the world (Millennium Ecosystem Assessment, 2005), few studies have evaluated whether direct and indirect human disturbances induce or not further biotic homogenization in their plant communities (e.g., Lougheed et al., 2008). Among them, Price et al. (2018) found a subtle process of biotic homogenization over time in the herbaceous emergent communities of palustrine wetlands of Illinois (USA). This process was associated with an increase of the presence and abundance of the exotic Phalaris arundinacea from the Poaceae family, and the decline of numerous other native and exotic species. On the other hand, Brice et al. (2017) observed biotic differentiation in the herbaceous communities of urban riparian swamps
11
due, in part, to the increase of habitat heterogeneity induced by urbanization. Similarly, Zhang et al. (2018) showed taxonomic differentiation of river floodplain macrophytes exposed to human impacts. In fact, because many types of wetlands are naturally species-poor, they are potentially more susceptible to biotic differentiation than to homogenization following disturbances (Olden & LeRoy Poff, 2003).
Bogs are peat-forming naturally species-poor wetlands (Vitt et al., 1995; Warner & Asada, 2006) that are mostly viewed as resilient ecosystems with compositional changes usually occurring over long-time scales (Moore, 1977; Rydin & Barber, 2001). Still, several studies have shown recent drastic compositional changes in response to human disturbances, including atmospheric pollution (Hedwall et al., 2017), drainage (Bellamy et al., 2012; Talbot et al., 2014), and transformation of the surrounding landscape (Chapman & Rose, 1991; Pasquet et al., 2015). For instance, drainage and climate warming have been shown to enhance shrub and tree encroachment, hamper Sphagnum growth and facilitate the establishment of generalist and exotic species (Gunnarsson et al., 2002; Pellerin et al., 2009; Kapfer et al., 2011; Pasquet et al., 2015). This shift from open bog toward forested communities is also associated with a decrease in the cover and richness of other bog specialist plant species (often heliophilic species) and a concomitant increase of shade or drought-tolerant species (Laine et al., 1995; Gunnarsson et al., 2002; Lachance et al., 2005; Pellerin et al., 2009; Tousignant et al., 2010; Kapfer et al., 2011; Pasquet et al., 2015). More recently, a study investigating the effects of woody encroachment in bog flora using a space for time substitution found within sites biotic differentiation associated with the introduction of terrestrial shade-tolerant species (Favreau et al., 2019). Although vegetation changes in bogs have been the subject of numerous studies (e.g., Gunnarsson et al., 2002; Pellerin et al., 2008; Hájková et al., 2011; Pasquet et al., 2015), temporal changes in beta diversity at a regional scale, and how these changes affect beta diversity remain to be explored.
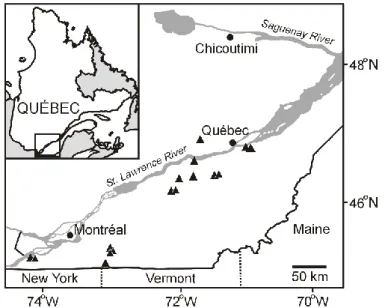
In this study, we investigated the floristic changes that occurred over 35 years in the vascular plant communities of temperate bogs of southern Québec (Canada). We revisited 76 plots originally surveyed in 1982 and located in 16 different bogs spread over the St. Lawrence Lowlands region. These bogs have been isolated in an agricultural landscape for more than 50 years which have induced a drying of the peat surface in many sites (e.g., Pasquet et al., 2015; Pellerin et al., 2016). We specifically aimed to 1) determine changes
12
in taxa richness, composition and beta diversity and 2) assess whether biotic homogenization or differentiation (beta diversity) occurred through time. We hypothesized biotic differentiation in response to species enrichment by terrestrial plants.
2.2. Methodology
2.2.1. Study area
The study area is in the St. Lawrence Lowlands, southern Québec (Canada), and extends from 45˚N to 47˚N latitude and from 71˚W to 74˚W longitude (Figure 1). The area is enclosed by the Canadian Shield to the north and the Appalachian Mountains to the south. The Lowlands have a flat topography and are characterized by deep arable soils derived from glacial and marine deposits. The landscape is composed of about 50% agricultural fields, 30% woodlands, 10% urbanized areas and 10% wetlands (Statistics Canada, 2010), of which 35% are bogs (Poulin et al., 2016). The mean annual temperature of the study area fluctuates from 4.1˚C in the northeast to 6.7˚C in the southwest (Environment Canada, 2011). Average precipitation ranges from a high 1120 mm in the northeast to a low 965 mm in the southwest, of which 23% and 17% fall as snow, respectively (Environment Canada, 2011).
Figure 1. Location of the 16 temperate bogs studied in southern Québec (Canada).
Bogs are scattered over the study area and are mostly dominated by ericaceous shrubs,
Sphagnum mosses, and Picea mariana thickets. Over the last few decades, 19% of the
wetland areas have been lost or disturbed by human activities, mainly agriculture and forestry activities, but also by urbanization and peat mining (Poulin et al., 2016). Tree
13
encroachment by Picea mariana, Pinus banksiana, Larix laricina, Betula populifolia, and
Acer rubrum has been reported in many of the remaining bogs (Pellerin & Lavoie, 2003a,
b; Pasquet et al., 2015; Pellerin et al., 2016; Favreau et al., 2019).
2.2.2. Sampling and data collection
Original sampling
During the 1980s, a large inventory campaign was conducted by the Ministry of Energy and Natural Resources of Québec to evaluate the peat resource across peatlands of southern Québec that were generally greater than 40 ha and with a peat deposit thicker than 30 cm (Buteau, 1989). During this large-scale inventory, hundreds of vegetation surveys were conducted. In the study area, all plots were sampled in 1982 in both pristine and disturbed peatlands (cutover, mined, logged or cultivated areas). All plots were in the center of a seemingly homogenous plant community. In each community, plant taxa cover was surveyed within a 20 m × 20 m (400 m2) plot. The percent cover of all vascular taxa as
well as all different strata (tree, shrub, herbaceous, moss and sphagnum stratum) in the plot were visually estimated according to six classes: <1%, 1-5%, 6-25%, 26-50%, 51-75%, >75%. Bryophytes were rarely sampled in original surveys and thus, not investigated in the present study. Other information available in the field sheets includes geographic coordinates of the plot, peat thickness, soil pH, biotopes relative dominance (pool, hummock, hollow, etc.), vegetation structure (woody, shrubby, herbaceous, etc.) and general information on the location of the plot within the bog (margins, expanse, near a drainage ditch, etc.). It must be noted, that vegetation data from this original survey has never been analysed.
Resampling: 2015 and 2017
Historical sampling plots were not permanently marked. However, as mentioned above geographic coordinates were available from the original field sheets. Before field sampling, we discarded all original plots established on minerotrophic habitats or disturbed areas. We also rejected all plots located in areas that had been affected by land conversion or subjected to woodcutting since earlier surveys. We identified these areas using 1980-2015 Google Earth Digital Globe satellite imagery. During the summer of 1980-2015 and 2017 (hereafter referred to 2017 for simplification), 76 plots spread over 16 bogs were relocated using a GPS. In addition to geographic coordinates, we used all environmental information
14
available from original studies to relocate the position of each plot. We surveyed the vegetation following the same methodology used in 1982. Due to the abundance of visual landmarks, we estimated that we were able to relocate all plots within 20-40 m from their original position. Although relocation errors can induce a source of variance in the dataset, systematic biases in one direction of vegetation change are unlikely to occur (Kopecký & Macek, 2015; McCune & Vellend, 2013; Savage & Vellend, 2015).
2.2.3. Data Analysis
Before analyses, taxonomic nomenclature was standardized according to the Database of Vascular Plants of Canada (VASCAN; Brouillet et al., 2017). We lumped, for both years, all sedge taxa (Carex) at the genus level as very few species were identified in 1982. We also merged Vaccinium myrtilloides and Vaccinium angustifolium under Vaccinum cf.
angustifolium because they were often misidentified. Taxa Richness
Change in taxa richness at the plot level (alpha diversity) between 1982 and 2017 was evaluated using a Wilcoxon signed rank test. We also considered taxa’s habitat preferences by comparing richness of taxa sorted by their wetland indicator status (Reed, 1988; Lichvar et al., 2014). According to this index, taxa that almost always occur in wetlands are classified as “obligate”, those that usually occur in wetlands, but may occur in non-wetland habitats as “facultative wetland”, those that equally occurs in wetlands and non-wetland habitats as “facultative”, those that usually occur in non-wetland habitats, but may occur in wetlands as “facultative upland”. Species that almost always occur in non-wetland habitats (upland species) were not found. Due to the scarcity of “facultative upland” species, we pooled them with the “facultative” ones before statistical analyses (Appendix S1). The wetland indicator status of each taxon was retrieved from the National Wetland Plant List (Lichvar et al., 2014) and Lapointe et al. (2014). Linear mixed-effect models were used to compare the number of taxa between habitat preferences and between years as well as the interaction between both factors. Plots were treated as a random factor, allowing us to control for pairing between plots and dependence between the numbers of taxa of different preferences in the same plot. Because a significant interaction was found between year and habitat preference, we tested the individual effect of each factor with linear mixed-effect models for each level of the other factor and then conducted post hoc Tukey tests to further
15
investigate if the number of taxa of each habitat preference differed between 1982 and 2017. We verified that model residuals followed a normal distribution.
We also compared richness of taxa according to their tolerance to shade (Kobe et al., 1995; Appendix S1). We classified taxa into three broad categories of shade tolerance: “tolerant” for taxa that grow well under limited amount of light, “mid-tolerant” for taxa that can tolerate shade during some phases of their life cycle, and “intolerant” for taxa that only grow with high amount of available light. Shade tolerance information was retrieved from the online databases TRY (Kattge et al., 2011) and Plants (USDA & NRCS, 2015) as well as from Humbert et al. (2007). We used the same linear mixed-effect model procedure described above.
Taxa frequency and abundance
Taxa with the greatest changes in terms of frequency of occurrence were identified by comparing the number of plots occupied by each taxon for each year using Chi-square goodness-of-fit tests (taxa were tested one by one). A Yates continuity correction was applied (Camilli & Hopkins, 1978). Finally, we evaluated whether the abundance of some taxa changed over time using cover as a proxy of abundance. The cover data were transformed into percentages using the midpoint of each class. Only species with ≥ 5% cover for at least one of the sampling periods were used (12 species analyzed). Differences between 1982 and 2017 were tested using a two-tailed paired t-test (species were tested one by one).
Beta diversity
Differences in beta diversity between 1982 and 2017 were analyzed using a distance-based test for homogeneity of multivariate dispersions (PERMDISP; Anderson, 2006). PERMDISP calculates the distance of each site (here plot) to the centroid in an ordination space (principal coordinate analysis) and then tests whether these distances are different between groups (here sampling years) through permutation tests. More precisely, two site-by-species matrices were first computed; one using covers (median of cover classes) and the other using presence-absence data. Then, for each matrix, a site-by-site distance matrix was built using the Hellinger distance (Legendre & De Cáceres, 2013). This distance matrix was used to compute the centroid of each group of sites. The distance of each site to its associated group centroid was calculated, and the dispersion of these distances
(within-16
group variance) was used as an estimate of beta diversity (the greater the within-group variance, the higher the beta diversity). The site distances to centroid were subjected to a paired t-test with 9999 permutations to determine whether dispersions differed between groups. To detect a shift in species composition between year (i.e., turnover), we tested for location differences between centroids using PERMANOVA with pseudo-F ratios (9999 permutations; Anderson, 2001). Because this test is sensitive to differences in multivariate dispersions (Anderson & Walsh, 2013), data visualization was used to support the interpretation of the statistical test. The differences in multivariate dispersion and composition were illustrated in principal coordinates analysis ordinations (PCoA). Finally, we decomposed beta diversity into replacement (turnover) and richness difference (species gain/loss) using Jaccard dissimilarity indices and presence-absence data (Legendre, 2014). We decomposed beta diversity for each year as well as between years.
All statistical analyses were performed using R 3.3.2 (R Core Team, 2016). Wilcoxon signed rank tests were performed using the wilcox.test, chi-square tests using chisq.test and paired t-test using t.test, all from the stats package (R core team, 2016). Linear mixed-effect models were fitted with lme() in nlme. Tukey tests were done with the lsmeans() function in the lsmeans library (Lenth, 2016). Hellinger transformations were done using
decostand(), multivariate dispersion analyses were performed using betadisper(), centroid
locations were tested using adonis2(), all from the vegan package (Oksanen et al., 2007). Permutation t-tests were done using perm.test(), from the broman package (Broman & Broman, 2017). Beta diversity partitioning was conducted using the beta.div.comp function (Legendre, 2014).
2.3. Results
2.3.1. Taxa richness
A total of 37 vascular taxa were recorded in 1982 and 57 in 2017 (total = 67), and only one exotic (Frangula alnus) was found, in 2017 (Appendix S1). Thirty new taxa were detected in 2017, while 10 were lost. Most of the taxa gained were found in <10 plots, except
Aronia melanocarpa (33 plots), Gaylussacia baccata (18 plots), Vaccinium corymbosum
(18 plots), Eriophorum virginicum (17 plots), Platanthera blephariglottis var.
blephariglottis (14 plots) and Coptis trifolia (11 plots). Furthermore, few of the gained taxa
were abundant (mean cover >5%) in the plots they were found: Rubus allegheniensis (39% mean cover; 4 plots), V. corymbosum (24% mean cover in the plots where it is present),
17
Frangula alnus (22%; 3 plots), G. baccata (12% mean cover in the plots where it is
present) and Osmundastrum cinnamomeum (8% mean cover in the plots where it is present; 5 plots). All lost taxa were present in 5 or less plots in 1982, except Alnus incana subsp. rugosa (8 plots).
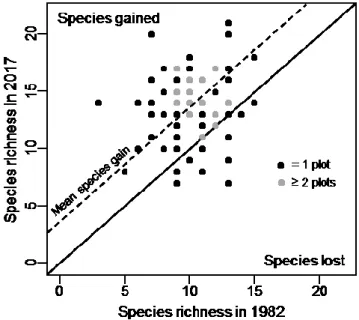
Taxa richness per plot ranged from 3 to 15 in 1982 and from 7 to 21 in 2017 (Figure 2). The number of taxa increased in 61 plots, remained similar in 5 plots and decreased in 10 plots. Overall, mean richness per plot significantly increased over time, from an average of 10 to 14 taxa (V=165; p≤ 0.005).
Figure 2. Vascular taxa richness in temperate bogs of southern Québec (Canada) in 1982
and 2017. Plots sampled in 1982 are compared to same plots sampled in 2017. The plain diagonal line is the 1:1 line (no change in richness between the two years) and the dashed line represents the mean richness increase. Grey dots represent more than one plot. This analysis is based on data from 76 plots, sampled in 16 bogs.
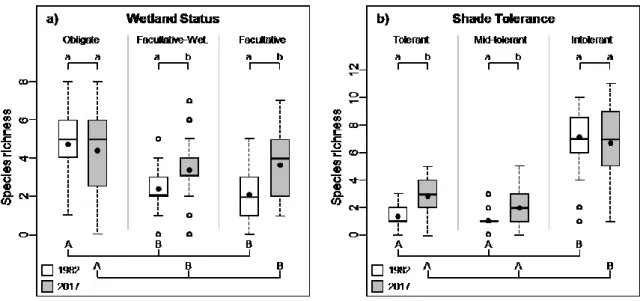
The number of “facultative wetland” and “facultative” taxa per plot significantly increased with time, while the number of “obligate” taxa remained similar (Figure 3a). The number of “obligate” taxa was about two times greater than that of the two other groups of taxa in 1982 and about 1.5 times greater in 2017 (Figure 3a). The amount of shade “tolerant” and “mid-tolerant” taxa per plot significantly increased over time, but never reached more than three species per plot while the richness of shade “intolerant” taxa remained around seven species per plot for both years (Figure 3b). It follows that the number of “shade-intolerant” taxa was greater than that of the two other groups of taxa for both years.
18
Figure 3. Richness of a) obligate, facultative-wetland and facultative taxa and b) shade
tolerant, mid-tolerant and intolerant species in 1982 and 2017 in temperate bogs of southern Québec (Canada). Provided are mean taxa richness (black dot), median (line), 25-75% quartiles (boxes) and ranges (whiskers). Different lower-case letters indicate a significant difference (α = 0.05; linear mixed-effect models) between years, whereas different upper-case letters indicate a significant difference (α = 0.05; Tukey’s test) within year. This analysis is based on data from 76 plots, sampled in 16 bogs.
2.3.2. Species frequency and abundance
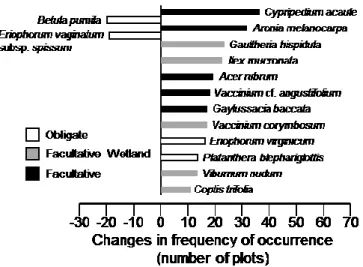
Of the 67 taxa tested, 14 significantly changed their frequency of occurrence over time (Figure 4) and six had significant change in their abundance (Figure 5). More precisely, 11 taxa significantly increased in frequency, among which Acer rubrum and Vaccinium
corymbosum also increased in abundance. The increase in frequency was particularly
marked (≥20 plots) for Cypripedium acaule, Aronia melanocarpa, Gaultheria hispidula,
Ilex mucronata and Acer rubrum. Taxa that became more frequent or abundant over time
were mostly or “facultative-wetland” or “facultative” taxa. Inversely, two taxa significantly decreased in frequency (Figure 4) and four decreased in abundance (Figure 5). Only
Eriophorum vaginatum subsp. spissum decreased both in frequency and abundance.
However, while E. vaginatum was still found in 43 plots in 2017, Betula pumila was found in only one plot in 2017. Decreasing taxa (either in frequency or abundance) were all wetland “obligate” taxa.
19
Figure 4. Vascular plant taxa with significant changes (p ≤ 0.05) in the frequency of
occurrence (number of plots) between 1982 and 2017 in temperate bogs of southern Québec (Canada). Taxa were tested one by one (chi-square goodness-of-fit tests with Yates correction). On the left side are taxa with lower frequency in 2017 than in 1982, and on the right side, taxa with higher frequency in 2017 than in 1982. This analysis is based on data from 76 plots, sampled in 16 bogs.
Figure 5. Vascular plant taxa mean cover in 2017 vs 1982 in temperate bogs of southern
Québec (Canada). Only taxa with significant mean cover change (two-tailed paired t-test; p ≤ 0.05) are presented. The plain line is the 1:1 line. Carex spp. is plotted with a different symbol as all sedge species were lumped together and not associated to a particular wetland status. Taxa were tested one by one. (n=76 plots sampled in 16 bogs).
20
2.3.3. Beta diversity
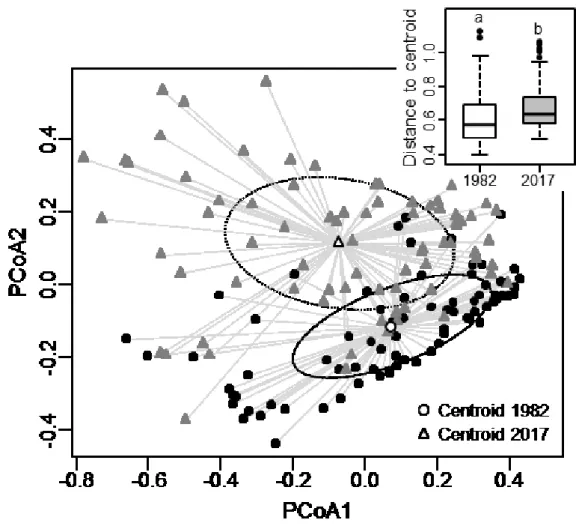
Beta diversity increased between 1982 and 2017 (presence-absence: T= 98.79; p< 0.0001; abundance data: T= 109.28; p< 0.0001), meaning that vascular plant communities of bogs differed more markedly from one site to another in 2017 than in 1982 (Figure 6). This increase in beta diversity was associated with in composition turnover as a significant difference in centroid position between years was found for both presence-absence (F=9.085; p≤ 0.0001) and abundance data (F=9.514; p≤ 0.0001).
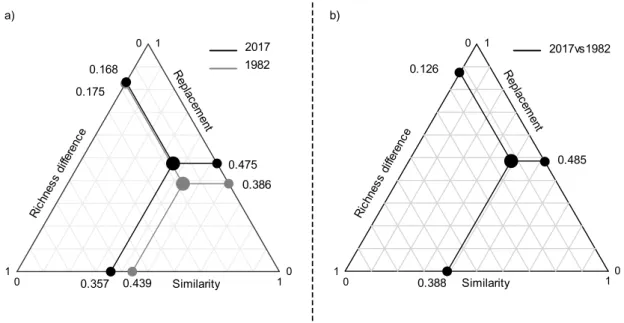
Finally, beta diversity in 1982 and 2017, and changes between 1982 and 2017 resulted mostly from taxa replacement (Figure 7). For instance, when comparing all pairs of plots between 1982 and 2017, replacement accounted for 48.5% of the beta diversity decomposition while richness difference accounted for 12.6%.
Figure 6. Effect of time on beta diversity for vascular plant taxa in bogs of southern
Quebec (Canada), using presence-absence data. Beta diversity was measured as the distance of sites to their group centroid, here represented on the first two axes of PCoA and using boxplot of the sites-to-centroid distance. Provided are median (line), 25-75%
21
quartiles (boxes) and ranges (whiskers) Different letters indicate a significant difference (p<0.05) determined by t-test. Circles are ellipses of standard deviation. (n=76 plots, sampled in 16 bogs).
Figure 7. Triangular plot of the relationship among 1) the 76 plots in 1982 and 2017, and
b) for all pairs of plots between 1982 vs 2017, illustrating the contributions of three components of beta diversity over time: similarity of species composition, richness difference and replacement of species. The large dots inside the triangle represent the centroid and the smaller dots on each side represents the mean values of all three components.
2.4. Discussion
In this study, we hypothesized a temporal biotic differentiation of the vascular flora in temperate bogs in response to species enrichment by terrestrial plants. Our results showed that the richness of the studied bogs increased from 1982 to 2017, mostly due to the establishment of facultative wetland and shade-tolerant plants. As expected, these changes induced a biotic differentiation, since we found higher beta diversity today than 35 years ago. This decrease in similarity with time was mostly the outcome of species turnover. This indicates that newly established taxa are not similar across the study area and that various taxa are being replaced over time.
2.4.1. Changes in plant environmental preferences
The analyses of plant richness according to individual habitat preference indicated an enrichment of taxa associated to drier habitats as we found more facultative wetland and
22
facultative plants in recent surveys than in the older ones. For example, Aralia nudicaulis and Maianthemum canadense which are two plants from the facultative categories, have appeared in 4 and 9 plots respectively over the studied period while they were absent in the past. Acer rubrum, a facultative tree species which was present in only 5 plots in 1982, is now present in 25 plots and has undergone a significant cover increase over time. Acer
rubrum introduction has been also documented in bogs of Indiana after drainage
(Swinehart & Parker, 2000). On the other hand, although the richness of obligate wetland plants did not significantly change over time, some of these plants experienced noteworthy decrease in frequency and abundance. This was the case for Eriophorum vaginatum subsp.
spissum, a deep rooting wetland-obligate typical of open bogs (Wein, 1973). Despite the
strong capacity of E. vaginatum to persist in peatlands, notably due to its typical tussock growth with basal meristematic tissue, surveys in vacuum mined peatlands have revealed its sensitivity to water-table drawdown (Lavoie et al., 2005).
The results in this study also suggest that the studied bogs experienced an increase of shading level over time as suggested by the gain of shade-tolerant and mid-tolerant plants. This increase level of shading is likely the results of shrub and tree encroachment in bogs, as suggested, among others, by the increase in frequency and abundance of Acer rubrum and Vaccinium corymbosum. In fact, a quarter of the plots investigated presented an increase in tree cover (mean increase 4.7%) and three quarter of the plots showed an increase in shrub (mean increase 37.2%) cover (see Appendix S2). While our results suggested that shaded habitats are becoming more widespread in the studied bogs, we also found no significant change in the richness of shade-intolerant species, although the variability of the data was higher in 2017 than in 1982 (Figure 2). The lack of significant change for the shade-intolerant species may be due do the time-lag after disturbance which implies that changes may still occur in the coming decades (Gustavsson et al., 2007; Koyanagi et al., 2012; du Toit et al., 2015). Overall our results suggest that the hydrologic environment and structure of plant strata were more variable in 2017 than in 1982 allowing the co-occurrence of heliophilic bogs specialists and shade and drought-tolerant plants more typical of forest environments. These results concurred with the phenomenon of woody encroachment more and more observed in bogs worldwide (e.g., Pellerin & Lavoie, 2003a, b; Berg et al., 2009, Pellerin et al., 2009; Ratcliffe et al. 2017).
23
2.4.2. Beta diversity
As expected, we found a biotic differentiation (increase in beta diversity) over a period of 35 years in temperate Sphagnum-dominated bogs of the southern Québec. Changes in beta diversity are usually led by two primary components: species turnover and richness differences (Olden & Poff, 2003; Legendre, 2014). Although we found an increase in plant richness over time in nearly all the sampling plots, our results indicated that the observed changes in beta diversity was mainly due to species replacement. For instance, our beta diversity partitioning analyses indicated that the influence of species replacement was 4 times greater than that of richness difference in beta diversity changes between 1982 and 2017. A recent study using a time-for-space substitution conducted in the same study area, but in different bogs, also found an higher beta diversity in sites recently subjected to woody encroachment than in open bog habitats, and this increase was mostly driven by species turnover (Favreau et al., 2019). Important species turnover with time, mainly driven by the replacement of typical bogs species by trees, shrubs and other widespread forest species were also found in Sweden by Gunnarsson et al. (2002) and by Kapfer et al. (2011).
2.4.3. Causes of the observed changes
Peatlands plant communities are usually quite stable in time and the rapid observed change and species turnover likely indicate non-autogenic process such as a change in environmental filtering, change in competition between species or historical events (Legendre, 2014). Model of peatland dynamics suggests that rapid change could be triggered by external events such as modification of environmental conditions (Eppinga et al., 2009). Recent drastic compositional shifts in bogs have been mostly attributed to human induced disturbances such as increasing temperature (Weltzin et al., 2000; Breeuwer et al., 2009; Dieleman et al., 2015), atmospheric nitrogen deposition (Berendse et al., 2001; Gunnarsson et al., 2004; Juutinen et al., 2016) and drainage (Laine et al., 1995; Freléchoux et al., 2000; Carrol et al., 2011). The shift from open bog toward forested communities is likely the most important change that have been demonstrated recently in response to these disturbances and is characterized by an increase of facultative species richness or drought-tolerant species (Laine et al., 1995; Weltzin et al., 2003; Pellerin et al., 2003b; Lachance & Lavoie, 2004; Talbot et al., 2014; Pasquet et al., 2015). Such structural change in peatland plant communities result in retroactive loop favoring the growth and development of vascular plant through increase litter accumulation, shading or drying of
24
the peat surface (Frankl & Schmeidl, 2000; Rietkerk et al., 2004; Eppinga et al., 2009; Kettridge et al., 2013; Waddington et al., 2015) and can cause a biotic differentiation of the flora (Favreau et al., 2019).
Changes in the prevalence of shrubs and trees as well as the increase of facultative species richness or drought-tolerant species observed in the present study are in accordance with other work indicating woody encroachment after drainage (e.g., Laine et al., 1995; Minkkinen et al., 1999; Pellerin et al., 2003b; Talbot et al., 2014). The observed changes of our study could therefore be attributed to the continuous lowering of the water table due to nearby agricultural activities (Heijmans et al., 2008). The region has been subject to much anthropic activities and numerous studies have hypothesized that the current trend in the vegetation reflects the influence of human activities, as well as isolation in an anthropized matrix (Pellerin & Lavoie, 2000, 2003b; Tousignant et al., 2010; Pasquet et al., 2015). Other factors acting in synergy with a regional lowering of the water table and drying of the peat surface could be at play here. For example, average global temperature has increased in the last decades and especially in the northern hemisphere (Vincent et al., 2015). In southern Québec, temperature have shown a positive trend throughout 1967 to 2006 (Nalley et al., 2013), which could also have favoured the establishment and growth of vascular species in the studied bog. It is known that increase temperature and drainage act in a similar way, by positively influencing vascular flora and negatively impacting the growth of Sphagnum species (Gunnarsson et al., 2004; Dieleman et al., 2015). Finally, nitrogen deposition is another potential factor in the observed changes which has been shown to positively impact vascular plants and negatively impact bryophytes species in peatland (Frankl and Schmeidl 2000; Gunnarsson et al. 2002; Malmer et al. 2003).
2.4.4. Limits of long-term resurveys
The use of a resurvey approach can induce pseudo-changes due to errors in relocation with non-permanent plots (Chytrý et al., 2014) or due to observer bias (Kapfer et al., 2017) which could limit the interpretation of the data. Such biases can be reduced by using field notes (topography, general composition of the site, soil type…) and geographic coordinates while localizing the historical plot, as we did in this study. As plot resurvey has been shown to be a robust method to investigate temporal vegetation changes (Kopecký & Macek, 2015; Alfonsi et al., 2017), and because we used multiple plots which showed a general trend, we are confident in the observed pattern in our study. This type of study is
25
essential to portray the evolution of ecosystems because they help understand rapid evolution of the vegetation when paleoecological records cannot (Hédl et al., 2017), and have been used in the past to identify similar trends in peatland vegetation (Gunnarsson et al.,2002; Kapfer et al., 2011). As the vegetation changes rapidly however, it would be appropriate to have permanently marked plots in the future in order to better capture the changes in the plant community. This would help reducing the relocation error that could be increasing in a rapidly changing environment as visual clues, topography and original community are changing and are becoming less relevant to relocate plots on the field.
2.4.5. Conclusion
In conclusion, changes observed in the present study reveal a rather quick compositional shift in the vegetation of isolated ombrotrophic peatland. The increase in beta diversity and the shift in community composition in a few decades within sites seemingly undisturbed by human activities seem to point towards a mechanism of community changes different from natural succession (Backéus, 1972; Zobel, 1988; Gunnarsson et al., 2000; Eppinga et al., 2009). We assume that different factors contributed to the observed changes, but consist mainly in the synergy between climate change, agricultural drainage and atmospheric depositions. All these factors could have contributed in different ways to promote woody encroachment and facultative species introduction. Also, these results concurred with several other studies pointing toward recent compositional change in bogs subjected to indirect human disturbances (Frankl & Schmeidl, 2000; Lachance et al., 2005; Pellerin & Lavoie, 2006; Pasquet et al., 2015; Favreau et al., 2019). We conclude that even in the absence of physical or visible disturbance on site, ombrotrophic peatlands are at risk from human activities, pollution and climate change, as was discussed in other studies (Parish et al., 2008; Heijmans et al., 2008; Breeuwer et al., 2009; Hedwall et al., 2017). However, as we did not include Sphagnum species due to a lack of data from the historical survey, we recognize a need to further the research by including moss species in future studies. This would help our comprehension of the current and future dynamic of these ecosystems. Our results highlight the need for increased efforts of conservation as peatland are facing two challenges: the disappearance of their surface to agriculture and urbanization and the disappearance of their floristic distinctiveness. Indeed, peatlands are usually species poor ecosystems with a highly specialized flora. An increase in beta diversity of their plant community due to the introduction of nearby species could ultimately impoverish the regional species pool and decrease biodiversity overall. Protecting the historic floristic
26
assemblage of these ecosystems will require various actions, such as halting the destruction of these ecosystem, stopping their systematic drainage, and restore the ones that were impacted by human activities (Pellerin and Poulin, 2013).
2.5. Références
Alfonsi, E., Benot, M.-L., Fievet, V., & Alard, D. (2017). Addressing species turnover and community changes in vegetation resurvey studies. Applied Vegetation Science, 20(2), 172–182.
Anderson, M. J. (2001). Permutation tests for univariate or multivariate analysis of variance and regression. Canadian Journal of Fisheries and Aquatic Sciences, 58(3), 626– 639.
Anderson, M. J. (2006). Distance-based tests for homogeneity of multivariate dispersions. Biometrics, 62(1), 245–253.
Anderson, M. J., & Walsh, D. C. I. (2013). PERMANOVA, ANOSIM, and the Mantel test in the face of heterogeneous dispersions: What null hypothesis are you testing? Ecological Monographs, 83(4), 557–574.
Backeus, I. (1972). Bog Vegetation Re-Mapped after Sixty Years, Studies on Skagershultamossen, Central Sweden. Oikos, 23(3), 384.
Barrett, S. C. H., Eckert, C. G., & Husband, B. C. (1993). Evolutionary processes in aquatic plant populations. Aquatic Botany, 44(2–3), 105–145.
Bellamy, P. E., Stephen, L., Maclean, I. S., & Grant, M. C. (2012). Response of blanket bog vegetation to drain-blocking. Applied Vegetation Science, 15(1), 129–135.
Berendse, F., N., Rydin, H., Buttler, A., Heijmans, M., Hoosbeek, M. R., … Wallen, B. (2001). Raised atmospheric CO2 levels and increased N deposition cause shifts in plant species composition and production in Sphagnum bogs. Global Change Biology, 7, 571– 598.
Berg, E. E., Hillman, K. M., Dial, R., & Deruwe, A. (2009). Recent woody invasion of