Vacation Leave, Work Hours and Wages: New Evidence from Linked Employer-Employee Data
35
0
0
Texte intégral
(2) CIRANO Le CIRANO est un organisme sans but lucratif constitué en vertu de la Loi des compagnies du Québec. Le financement de son infrastructure et de ses activités de recherche provient des cotisations de ses organisations-membres, d’une subvention d’infrastructure du Ministère de l'Enseignement supérieur, de la Recherche, de la Science et de la Technologie, de même que des subventions et mandats obtenus par ses équipes de recherche. CIRANO is a private non-profit organization incorporated under the Québec Companies Act. Its infrastructure and research activities are funded through fees paid by member organizations, an infrastructure grant from the Ministère de l'Enseignement supérieur, de la Recherche, de la Science et de la Technologie, and grants and research mandates obtained by its research teams. Les partenaires du CIRANO Partenaire majeur Ministère de l'Enseignement supérieur, de la Recherche, de la Science et de la Technologie Partenaires corporatifs Autorité des marchés financiers Banque de développement du Canada Banque du Canada Banque Laurentienne du Canada Banque Nationale du Canada Bell Canada BMO Groupe financier Caisse de dépôt et placement du Québec Fédération des caisses Desjardins du Québec Financière Sun Life, Québec Gaz Métro Hydro-Québec Industrie Canada Intact Investissements PSP Ministère des Finances et de l’Économie Power Corporation du Canada Rio Tinto Alcan Ville de Montréal Partenaires universitaires École Polytechnique de Montréal École de technologie supérieure (ÉTS) HEC Montréal Institut national de la recherche scientifique (INRS) McGill University Université Concordia Université de Montréal Université de Sherbrooke Université du Québec Université du Québec à Montréal Université Laval Le CIRANO collabore avec de nombreux centres et chaires de recherche universitaires dont on peut consulter la liste sur son site web. Les cahiers de la série scientifique (CS) visent à rendre accessibles des résultats de recherche effectuée au CIRANO afin de susciter échanges et commentaires. Ces cahiers sont écrits dans le style des publications scientifiques. Les idées et les opinions émises sont sous l’unique responsabilité des auteurs et ne représentent pas nécessairement les positions du CIRANO ou de ses partenaires. This paper presents research carried out at CIRANO and aims at encouraging discussion and comment. The observations and viewpoints expressed are the sole responsibility of the authors. They do not necessarily represent positions of CIRANO or its partners.. ISSN 2292-0838 (en ligne). Partenaire financier.
(3) Vacation Leave, Work Hours and Wages: New Evidence from Linked Employer-Employee Data * Ali Fakih †. Résumé/abstract This paper provides new evidence on the determinants of vacation leave and its relationship to hours worked and hourly wages by examining the case of Canada. Previous studies from the US, using individual level data, have revealed that annual work hours fall by around 53 hours for each additional week of vacation used. Exploiting a linked employer-employee dataset that allows to control for detailed observed demographic, job, and firm characteristics, we find instead that annual hours of work fall by only 29 hours for each additional week of vacation used. Our findings support the hypothesis that pressure at work may lead employees to use more vacation days, but also causes them to work for longer hours. Mots clés/keywords: Paid vacation leave, used vacation leave, work hours, wages, linked employer-employee data. Codes JEL : J22, M52. *. The author appreciates helpful comments from Benoit Dostie and seminar participants at the SOLE (Vancouver), SCSE (Québec), and CEA (Québec). The author is also thankful to the Workplace and Employee Survey (WES) team at Statistics Canada and CIQSS for their help. This working paper was published in LABOUR: Review of Labour Economics and Industrial Relation : http://onlinelibrary.wiley.com/doi/10.1111/labr.12043/abstract † Department of Economics, Lebanese American University, P.O. Box: 13-5053 Chouran, Beirut 1102 2801, Lebanon; Phone: +961-1 78 64 56, Fax: + 961-1 86 70 98, E-mail address: afakih@lau.edu.lb. Centre for Interuniversity Research and Analysis on Organizations (CIRANO), Canada, and Institute for the Study of Labor (IZA), Germany..
(4) 1. Introduction Paid vacation leave have been introduced in workplaces either by government decree or by private employers’ initiatives since the 1940s in a number of advanced economies to improve working conditions. However, the implications of this measure on workers have not been analyzed in the context of the employee-employer relationship. This paper builds on the relatively few existing studies on vacation leave and its relationship to hours worked and wages using instead linked employee-employer data from Canada. One of the few attempts to study paid vacation leave’s implications on workers was made by Altonji and Usui (2007) who provided sets of facts about vacation leave using individual level data from the US. Three key questions are asked in this paper: What are the determinants of paid vacation offered and vacation used?1 How are work hours related to vacation leave? What is the relationship between wages and vacation leave? These questions gain importance because vacation leave involves wider decisions in the labor market, i.e. a firm’s decision regarding fringe benefits offering and a worker’s decision whether to choose a job with a particular combination of wage-hours-vacations (Rebitzer and Taylor, 1995; Senesky, 2004). Moreover, analyzing the wage-hours-vacations profile is important because a decision to work or to take paid leave may contribute to the ongoing debate in explaining the differences in labor supply preferences across economies (e.g. Prescott, 2004; Alesina et al., 2005). Regarding the first question, it is interesting to examine the determinants of vacation leave in the light of Canadian data, because on the one hand Canadian labor legislation regarding paid vacation is distinctive: it is less generous than in Europe (a minimum of 4 weeks per year) but more advantageous than the American legislation (the US is the only advanced economy where the employer is under no obligation to grant vacation leaves to his employees). In Canada, provincial labor legislation requires a minimum of 2 weeks of paid vacation per year.2 On the other hand, there is a similarity in the use of paid vacation between Canada, US, and Europe (see Table 1). Examining the factors that determine the amount of paid vacation offered and vacation used would provide information and directions to policy-makers to develop relevant strategies aiming to improve 1. By “paid vacation” we mean the vacation leave to which the employee is entitled in a year, and by “vacation used” we mean the vacation leave that is actually used. 2 Two provinces, Quebec and New Brunswick, afford prorated vacation time to employees who have completed less than one year of service with their employer. For example, in Quebec, those employees are entitled to one day of vacation per month of uninterrupted service during the reference year (up to 10 days) (Source: Annual Vacations with Pay, 2006, Human Resources and Skills Development Canada).. 1.
(5) working environments. This is because longer paid vacation leave may be reflected in a reduction in a firm’s production and competition levels (Green, 1997). Table 1: Stylized facts on paid vacation leave in North America and Europe Country Unused paid vacation Minimum annual leave Canada 2 days 2 weeks United States 3 0 United Kingdom 3 4 Germany 2 4 Sources: Statistics on the number of unused vacation leave are taken from the Workplace and Employee Survey (WES) (2005) for Canada, Ray et al.’s (2013) report for the US, Saborowski et al.’s (2005) paper for United Kingdom and Germany. Numbers of minimum annual leave are taken from Ray et al. (2013).. The relationship between vacation leave and hours worked reflects the way the latter are determined in the labor market. Altonji and Oldham (2003) argue that paid vacation is an important factor in explaining variations in the Gross Domestic Product (GDP) per capita due to their impact on the number of annual working hours. They find that an additional week of legal minimum entitlements reduces the number of annual working hours by approximately 26.8 hours over the period 1979-1999. Controlling for the year and for the country, they find a stronger effect, i.e. an annual reduction of approximately 51.9 hours worked for each additional week of paid vacation. They argue that the difference between the US and Europe in annual hours per worker is explained by the transatlantic difference in the paid vacation laws. These results reflect the role of vacation laws, among other factors, in explaining the overall difference in annual hours between countries. In this context, a negative relationship between working hours and paid vacation is expected because vacation regulations can be a constraint for employees in their choice of working hours. By the same token, it is also expected that working hours are negatively related to vacation used. Bell and Freeman (2001) note that workers may choose to work longer hours to improve their promotion and employment position in the future leading to increase work-related pressure. They argue that workers who choose to work longer hours are not necessary looking to have less leisure time but indeed they are comparing the benefits of increasing hours worked with the cost of this change. This may lead workers to desire to use more their paid vacation (Wooden and Warren, 2008). These authors note that, on the one hand, long working hours should increase the need and desire to use all one’s vacation time, and on the other hand, long working hours are an obstacle to workers taking their leave entitlements. The association between paid vacation and hours worked may shed new light on the underlying determinants of the length of working time in Canada. 2.
(6) Finally, vacation leave is considered an important component of fringe benefits packages and is normally specified in the employment contract. The literature on the link between the provision of “family-friendly” fringe benefits and wages presumes that obtaining more benefits could be an indicator of a higher wage (e.g. Gariety and Shaffer, 2001; Johnson and Provan, 1995). This would lead us to presume that getting more paid vacation is an indicator of a higher salary. The expected positive vacations-wages link is consistent with job search models (e.g. Hwang et al., 1998; Lang and Majumdar, 2004). According to those models, firms’ heterogeneity in matching value implies that some firms will propose a combination of high wage and paid vacation that best balances the firms and workers preferences. The relationship between paid vacation and wages may guide firms in their decision to attract employees with an adequate fringe benefits policy. In this paper, we revisit the determinants of vacation leave and its relationship to hours worked and wages by investigating the case of Canada. Given that causality is difficult to establish on the relationship between paid vacation leave, hours worked, and wages, we focus on testing the hypotheses derived on the correlation between vacation leave and hours worked, vacations and wages, and on the determinants of vacation leave.3 Our paper is conceptually similar to Altonji and Usui’s (2007) examination, but we investigate and underline the differences when examining the Canadian case. Thus, our estimation strategy will be unchanged to provide a comparison between our results and those found in Altonji and Usui’s (2007) paper. However, our study uses a richer linked longitudinal employee-employer dataset, the Workplace and Employee Survey (WES) 1999-2005 provided by Statistics Canada. WES is a nationally representative sample containing detailed information on employees and workplaces in private sector. The use of the WES data is relevant because it allows controlling for more worker characteristics and, more importantly, it provides better information regarding job and firm characteristics versus individual level panel data as in Altonji and Usui (2007). In addition, it provides a more precise measure of days of vacation leave where each worker was asked to provide the number of days of paid vacation leave offered and used in his/her current job. Indeed, previous studies on vacation leave are based, in general, on surveys collecting information on households that may include jobless respondents. This may increase errors in measuring the number of vacation days, as opposed to employee surveys, in which all respondents have a job. It is more likely that an employee will report the real number of vacation days.. 3. Indeed, paid vacation, vacation used, hours worked and wages may be viewed to be all jointly determined by the employer, employee or both (also in equilibrium).. 3.
(7) Our main results can be summarized as follows. First, job- and firm-related factors seem to play more important roles than socio-demographic characteristics in determining the amount of paid vacation and vacation used. Second, using Altonji and Usui’s (2007) specification, we find that the use of vacation leave is associated with a decrease in annual hours worked by more than a week of work in line with the US evidence reported by these authors. Interestingly, when we extend the Altonji and Usui’s (2007) model by adding a rich array of observable job and firm characteristics, this number drops to only 29 hours. That is, reporting an extra week of vacation used translates into less than one to one reduction in weeks worked. Third, our findings lend credence to Altonji and Usui’s (2007) results that hourly wage is positively correlated to paid vacation and vacation used. The remainder of the paper is organized as follows. Section 2 overviews the related literature and derives the hypotheses. Section 3 presents the data used along with the descriptive statistics. The estimated results are discussed in section 4. Finally, we conclude briefly in section 5.. 2. Related literature and research background This section discusses the relevant literature on variables that are included as determinants of paid vacation and vacation used. 2.1 Demographic characteristics In one of the early studies on vacation leave, Buckley (1989) analyzes the determinants of paid vacation in various areas of the United States. He uses data from the Area Wage Survey (AWS) of the US Bureau of Labor Statistics from 1983 to 1986. He finds that workers who benefit from more paid vacation time than the country’s average live in areas with higher-than-average salaries. For blue collar workers, there is more paid vacation time in regions with large firms and in regions with highly unionized workers and substantial manufacturing activity. For example, in Detroit, workers benefit from approximately 20% more paid vacation time. By contrast, in San Antonio, an area with a lower rate of unionization, less manufacturing activity and smaller firms, paid vacation time is less than the average. Maume (2006) studies the determinants of vacation leave for men and women in the United States. The data are taken from the National Study of the Changing Workforce (NSCW) for the year 1992. Controlling for family and employment characteristics, he finds that women are more likely to use their vacation days than men. A possible explanation is that women attach more importance to family life (e.g. women are often responsible for child-rearing and childcare), whereas men are 4.
(8) mainly interested in their work environment. Thus, the fact that women use more vacation time than men may affect their career progression. We expect that women are more likely to use paid vacation. Even though men and women participate more equally in the domestic activities (Sayer, 2005; Marshall, 2006), there is evidence that working women continue to support the majority of domestic chores in addition to their work responsibilities (see for example the US case in Bianchi et al., 2000; or the case of Canada in Marshall, 2006) and they are more likely to perceive greater work-family conflict. Thus, they have higher demand for family-friendly work practices such as leave policies (Heywood et al., 2007). In a more detailed study, Altonji and Usui (2007) examine the relationship between vacation leave and certain demographic and workplace characteristics in the United States. They use the Panel Study of Income Dynamics (PSID) from 1975 to 1991. They find that paid vacation and vacation used are longer for women, married people, civil servants and unionized employees but shorter for black workers. Indeed, demographic characteristics, such as marital status, single-parent families, and the presence of children under 18 years are among significant factors that are expected to exhibit greater work-family conflict (Bardoel et al., 1999; Budd and Mumford, 2006, Banerjee and Perrucci, 2012) and may be strongly correlated with the use of paid vacation. For example, having school-age children puts more pressure on working parents who have to invest both time and money in their children’s education and health care (Becker and Tomes, 1986). As parents’ time is scarce, this may affect the distribution of working time and we might expect that the presence of children may increase the use of vacation leave. However, this assumption was not supported by Maume (2006) who finds that overall vacation leave used is not mainly derived from familial characteristics but rather from work-related characteristics. There are some signs that racial and ethnic inequality in non-wage benefits and earnings exits in the labor market. For example, Solberg and Laughlin (1995) find evidence that white men are more likely to receive fringe benefits than black men. Chowhan et al. (2012) use Statistics Canada’s 2005 WES dataset and find that immigrant employees arrived to Canada between 1996 and 2005 are more likely to receive lower pay and benefits satisfaction than Canadian-born employees. By the same token, Fang and Heywood (2010) use the WES dataset and find that ethnic minorities have lower earnings than non-minorities in the time rate sector; however, these two groups receive similar earnings in the output pay sector. Taken together, we expect that immigrants and visible minority workers may receive less paid vacation. It is also expected that these groups may use less of their vacation time (Maume, 2006) as a visible sign of efforts and loyalty towards their employer 5.
(9) especially when these workers face problems related to skills recognition and job experience (Fang et al., 2009). Another factor that has been shown to influence the use of vacation leave in previous studies is the level of human capital accumulation, which is measured as in the literature by seniority, labor market experience and education. Seniority demonstrates the employee’s stability with the employer, and vacation days, which are considered a work benefit, are expected to increase with seniority (Maume, 2006; Altonji and Usui, 2007). Additionally, educational attainment has a positive influence on paid vacation offered and used (Maume, 2006; Altonji and Usui, 2007). In other words, workers who have accumulated more years of education enjoy more paid vacation time. The theory of human capital predicts that the level of education is inversely proportional to the time allotted to household tasks (Becker, 1985). Ohtake (2003), who compares the impact of the costs of job loss on the amount of vacation used in the presence and absence of unions, argues that when higher educated workers have steeper wage-tenure profiles, such workers are more likely to be confronted with a reduction in the vacation time used. Hence the costs of job loss due to a steep wage-tenure profile will be greater in this case. 2.2 Job and firm characteristics Job and firm characteristics also seem to play a role in examining variations in paid vacation leave offered and used. Maume (2006) argues that successful people, for example those who have higher pay and are supervisors, earn more vacation time. He shows that variables with the greatest effects on paid vacation are hourly wage, if the respondent is a supervisor, firm size, government employment, and union membership. Previous studies find a positive and significant relationship between unionization and paid vacation in the US (Green and Potepan, 1988; Maume, 2006). This accords with Green (1997) who uses data from United Kingdom and finds that the presence of unions are positively correlated with paid vacation. He finds that union members enjoy an extra of 5.5 days than non-union members. This evidence suggests that unions were more successful in securing more paid vacation leave for their workers where unions can support workers in legal proceedings (Ohtake, 2003). Reitz and Verma (2004) note that although Canadian unions are still not secure as in some countries in Europe, the presence of unions was considerably better than in the US, France, and many other countries over the past 25 years. Thus, we anticipate that, all else equal, the presence of a union in a firm increases the probability of having more paid vacation leave, where workers tend to negotiate more formalized collective bargaining agreement benefits (Verma, 2007). 6.
(10) Parts of the literature on the provision of family-friendly fringe benefits, such as leave policies, suggest that managers and supervisors are more likely to receive such policies (e.g. Gray and Tudball, 2003). This may suggest that any positive association between being a supervisor and paid vacation leave would be evidence that workers with more authority and responsibilities enjoy additional fringe benefits (Lowen and Sicilian, 2008). At the same time, we assume that if an employee has a supervisory function, he/she would have less used vacation leave. The supervisor is often overburdened by responsibilities; this may lead him/her to spend more time at work as means for more work commitment (Maume, 2006). By the same token, being promoted involves new work responsibilities and is often associated with substantial wage increases (Pergamit and Veum, 1999; Kosteas, 2009). Lazear and Rosen (1981) consider job promotion as a tournament and the winner will receive higher salary and more fringe benefits associated with higher position in the firm. Pergamit and Veum (1999) find that job promotion is positively correlated with a number of nonwage benefits. Kosteas (2011) argues that firms can use promotion to reward its highly productive workers in addition to more fringe benefits. If so, we might expect that job promotion to be positively related to paid vacation. When considering the determinants of paid vacation offered and used, many of the predictors found in the non-standard work and “flexible” work arrangements literature (such as part-time, work done at home, compressed work week, etc.) may be relevant. To the best of our knowledge, none of these variables have been examined in the existing literature on vacation leave. For instance, there is evidence that employees who work according to flextime arrangement are less stressed by time constraints (Marshall, 2006). Flextime arrangements are increasingly popular because they allow employees to adjust their working time according to their family obligations (Evans, 2002). The Canadian WES dataset provides the opportunity to examine the role of such arrangements. Thus, in addition to the standard demographic and work characteristics used in the literature on vacation leave, we take advantage of this national dataset and include work schedules predictors. Golden (2001) finds evidence that worker may trade-off flexibility with longer working hours suggesting that workers may sacrifice leisure time in order to get flexibility in their time spent at work. He notes that employers implement flexibility to achieve greater organizational commitment that may lead worker to accept long working hours. He concludes that the higher the preferences for flexible work time, the higher the probability to forgo leisure time. Eldridge and Pabilonia (2007) examine whether the number of hours worked in the US are underestimated and increasing over time due to work at home arrangement. They find that workers who report having done work at home 7.
(11) have longer working time than their colleagues who work only in the firm. Golden (2005) studies the relationship between the duration of hours worked and scheduling using the Current Population Survey (CPS). He finds that working 50 or more hours increases the probability of having flexible work arrangement compared with those who work less hours. He argues that workers, who are attracted by more flexibility in the workplace, might lead them to work longer hours. Zeytinoglu and Cooke (2005) use the WES dataset to study the relationships between non-standard arrangement and non-wage benefits in Canada. They find that regular part-time workers are less covered by fringe benefits suggesting that some workers are trapped in non-standard jobs that lack of a full range of good working conditions. More recently, Zeytinoglu et al. (2009) use also the WES dataset to examine whether flexibility in Canada was introduced by employers for business reasons or to support workers in the work-life reconciliation. They find that job and firm variables are more significant determinants than worker characteristics to affect flexible work schedules suggesting that firms create such work arrangements for business reasons and not for worker interest. Taken together, we predict that workers with flexible work arrangements may use less their paid vacation days perhaps because of more difficulty in organizing their leisure time.. 3. Data We use data from the Workplace and Employee Survey (WES) conducted annually by Statistics Canada from 1999 to 2005.4 WES is both longitudinal and linked in that it documents the characteristics of workers and workplaces over time. The survey covers approximately 6,500 workplaces in sectors of activity, and links changes affecting employees (salaries, work stability, training, etc.) with changes in the firm (human resources management practices, innovation, use of technology, etc.). It should be noted that this survey does not cover firms located in the Yukon, the Northwest Territories or Nunavut, livestock production, fisheries, hunting or trapping. Additionally, our paper makes inference on the private sector only because the WES dataset does not provide information on public sector. The target population for the workplace component of the survey is defined as the collection of all Canadian establishments who paid employees in March of the year of the survey. Those establishments are followed over time with the periodic addition of samples of new locations to maintain a representative sample. For the employee component, the target population is the collection 4. This is a micro-database with restricted on-site access.. 8.
(12) of employees working or on paid leave in the workplace target population. It covers approximately 24,000 employees sampled from lists provided by the selected workplaces. For every workplace, a maximum number of 24 employees is selected and for establishments with less than 4 employees, all employees are sampled. The WES selects new employees and workplaces in odd years. The WES is therefore representative of employees only for the resampling years (1999, 2001, 2003, and 2005). The survey consists of a follow-up of the initial sample chosen in 1999, to which Statistics Canada adds a sample of new firms every two years. The initial sample comprises 23,540 employees in 1999; 20,167 (85.6%) of whom are also present in 2000. In 2001, 20,352 employees were resampled and 16,813 (82.6%) of them were contacted again in 2002. In 2003, 20,834 employees were resampled and 16,804 (80.6%) of them were contacted again in 2004. Finally, 24,197 employees were resampled in the last year of survey. Our final sample comprises 131,883 observations after excluding observations with missing values for some covariates. The WES dataset contains a rich set of variables describing both worker and firm characteristics. Our measure of paid vacation leave is captured through the number of weeks of vacation entitled and the number of weeks of vacation used as in Altonji and Usui (2007). We use detailed explanatory variables on standard demographic and work-related factors included in Altonji and Usui (2007) and Maume (2006). Regarding worker characteristics, the following variables are constructed as dummies: gender (female = 1), marital status (married = 1), presence of children under 18 (yes = 1), if the worker is from the Black, Filipino, Chinese, South/East/ West Asia, North Africa categories with category “White” as the reference group, immigrant (if the worker is immigrant = 1). Age is defined in years. Seniority (length of a worker’s employment within a firm) is measured in years. Experience (number of years of full time work) is also measured in years. The WES only lists degrees held by each worker. Accordingly, we use this information to assess the role of education. We construct four dummies for education each coded as yes = 1. We include the following dummies: vocational diploma or some college, completed college or some university, bachelor or higher education completed, and industrial training or other. Working less than 30 hours per week is considered part-time work. Work arrangements dummies are defined as follows: flextime (varying arrival and departure time), reduced work week (following a special agreement with the employer), compressed week (working more hours in a day to reduce the number of working days per week), and work at home. Job promotion is a dummy variable equal to one if the worker obtained a promotion since he/she started working for this employer. Supervisor is also a dummy variable equal 9.
(13) to one if the worker supervises the work of other workers. Unionization is equal to one if the worker is a member of a union or covered by a collective bargaining agreement. Firm size is constructed from four dummies: small (less than 20 employees); medium (20 to 99); large (100 to 499); and very large (500 employees or more). Sample Characteristics Figure 1 presents the distribution of paid and used vacation weeks for men in 2005. We find that 12.2% of men report no week of paid vacation5, only 2.6% report one week, 21.5% report two weeks, 43% report three weeks, 11.5% report four weeks, 7.5% report five weeks and 1.5% report six weeks or more. The distribution of used vacation weeks is similar to that of paid vacation weeks. Although a large percentage of employees had three weeks of paid vacation, the majority reported using less than three weeks per year. Figure 2 reveals that the distribution of women’s paid and used vacations are similar to men’s distribution. These figures correspond to Figures 1 and 2 in Altonji and Usui (2007). Interestingly, we find that the results presented in Figures 1 and 2 differ between Canada and the US. Altonji and Usui (2007) find that 10.7% of men reported no paid vacation and 11.9% reported 1 week of paid vacation. Taken together, these observations show that 22.6% of American workers report having no paid vacation or 1 week of paid vacation, while the corresponding number for their Canadian counterparts is only 14.8%. By the same token, their results show that 23.7% of American workers have an amount of paid vacation that falls in the categories of 4 weeks (14.1%), 5 weeks (6.4%), and 6 or more weeks of paid vacation (3.2%), while the corresponding number of Canadian workers is 20.5%. These differences in the distribution of vacation weeks could be explained by the fact that the US is the only advanced country that does not legally require employers to provide annual paid leave, while a minimum of 2 weeks paid vacation is mandated in Canada. Accordingly, the amount of paid vacation offered is left to each employer’s discretion who may offer fewer paid vacation days to a large number of workers.6 As a matter of fact, laws mandating a minimum number of paid vacations may have more benefits to employees and they had an important role in the spread of vacation time (Altonji and Oldham, 2003). Figure 3 shows the distribution of used vacation weeks less paid vacation weeks according to gender. The difference is zero for 56.8% of men and 58.2% of women. Comparing this figure to the corresponding figure in Altonji and Usui (2007) shows that in both Canada and the US, almost half 5. This high percentage is due to the category of employees with less than a year of service with the employer. Recent evidence shows that the percent of American workers in private sector receiving paid vacation has declined from 82% in 1992 to 77% in 2012 (Van Giezen, 2013). 6. 10.
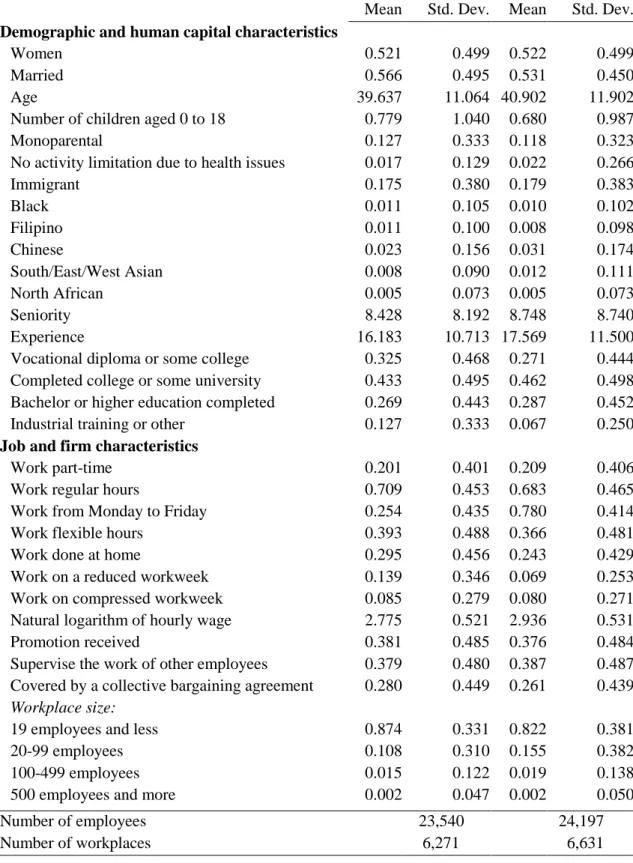
(14) of the people report a zero difference between used vacation and paid vacation. Specifically, the difference was zero for 51.7% of men and 46.2% of women in the US. However, there is one noticeable difference between the two countries. We observe that the Canadian distribution is negatively skewed, i.e. the amount of paid vacation exceeds the amount of used vacation, while in the US, those who report that the difference between used vacation and paid vacation is not equal to zero are evenly divided between those who report positive and negative differences.7 This difference between Canada and the US may suggest that failing to mandate a minimum of paid vacation may result in an equilibrium in which work hours are too long and vacation time too short leading some workers to take less vacation than they were entitled as in the case of the US (Altonji and Oldham, 2003). However, if the opportunity costs of taking vacations are reduced some other workers may want to take more time off (Li, 2009). Table 2 presents the descriptive statistics of the variables used in the analysis. We observe that 52.1% of employees are females and that 56.6% are married in 1999. Large visible minority employees, e.g. Black, Filipino and Chinese represent 1.1%, 1.1% and 2.3% of our sample, respectively, while immigrants represent 17.5% of our sample. The average seniority is approximately 8 years, and the average work experience is close to 16 years. The average age of employees in the sample is 40 years. Approximately 39% of workers have flextime, 29.5% have done some work at home, 14% have reduced workweek, and 9% a compressed workweek. We also observe that around 38% of workers have supervisor’s duties and 28% of workers are members of unions. Small firms represent 87.4% of the sample, whereas the percentage of medium firms is approximately 10.8%; the categories large firms and very large firms represent 1.5% and 0.2% of the sample, respectively. It should be noted it is impossible to disclose the minimum and the maximum values because of Statistics Canada’s confidentiality policy.. 4. Results and discussion Our regression analysis first examines the determinants of paid vacation offered and vacation used. Then, we continue with the relationship between vacation leave and hours worked and wages.. 7. On the one hand, workers who took more vacation than they were paid for had most probably carried them forward in previous years and were finally using them or they may buy additional vacation days in workplaces permitting this practice (Altonji and Usui, 2007). On the other hand, workers who use less vacation time than their paid vacation may prefer to carry forward a portion of their vacation days to the following year or relinquish their right to use their vacation in firms that permitted this practice.. 11.
(15) 4.1 Determinants of vacation leave We examine the determinants of vacation leave controlling for observable characteristics of worker, job, and workplace to which the worker is linked. Following Altonji and Usui (2007), we fit the model using OLS estimation for the number of weeks of paid vacation and the number of weeks of vacation used as the dependent variables that are reported for the whole year.8 In Table 3, column 1 presents the results for paid vacation offered while column 2 presents the results for vacation used. We control for occupation, industry, year, and region in all specifications. Demographic and human capital characteristics The results reveal that there is no difference between men and women in paid vacation offered. This result is in line with Maume’s (2006) findings but different than the results of Altonji and Usui (2007) who show that women earn more paid vacation than men. Evidence from familyfriendly work practices provides similar results (Budd and Mumford, 2006). These authors find no evidence on any gender gap in the probability of receiving paid vacation in Britain. Indeed, in Canada, the share of women in managerial positions have increased from 30% in 1987 to 36% in 2006 (Statistics Canada, 2007)9 reflecting more representation of women in positions that offer more fringe benefits. Gayle et al. (2012) find that women who become managers earn more and are promoted faster than men. Drolet (2011) concludes that changes in labor force composition (women are relatively more educated than men, lower tenure gap with men, and higher proportion of women in unions than men) and how labor market compensates workers play a role in explaining the reduction in gender pay gap in Canada. Taken together, this evidence suggests that labor market conditions may also play a role in narrowing the gender gap in paid vacation. We also find that women use more their paid vacation. This result is consistent with previous studies from the US (Maume, 2006; Altonji and Usui, 2007) and confirms our expectation. Women in Canada still spend more hours on family responsibilities (Marshall, 2006) suggesting that women tend to use more their paid vacation perhaps to improve family ties in which family-related commitments explain part of this gender gap in vacation used (Maume, 2006). We also find that married employees are more likely to have both paid vacation and vacation used. Altonji and Usui (2007) report similar findings but only for vacation used. There is evidence 8. The use of a linear model could be justified by Chernozhukov et al.’s (2009) model in which they show that the Average Partial Effects (APE) of explanatory variables on the conditional means are not generally identified in nonlinear panel models and the bounds tend to be tight with the number of time periods. 9 Source: Women in Canada: Work Chapter Updates, Statistics Canada (2007).. 12.
(16) from work-family conflict literature that married workers report more conflict in balancing family and work responsibilities (e.g. Frone et al., 1992). This may suggest that increased family responsibilities may increase the probability of using more vacation time. Golden (2001) argues that married workers are more likely to be parents and are maybe offered informally greater benefits in the workplaces explaining the higher amount of paid vacation. Employee age is found, on the one hand, to be positively correlated with paid vacation in line with the well-established literature that workers’ compensation preferences change as they age (Amuedo-Dorantes and Mach, 2003). These authors find that the provisions of non-wages benefits rises with age. On the other hand, we find that younger workers are less likely to have vacation used than older workers. Young workers are in general susceptible to poor working conditions (Cooke, 2007) and focusing more in building career. This may lead them to have higher organizational commitment and to avoid using all of their paid vacation. Maume (2006) finds similar results and argues that young people tend to work harder and spend more time in workplaces when career lives are given more weights than personal lives. Saborowski et al. (2005) note that younger and successful workers, who have less vacation used, are more likely to work overtime. As to the presence of children under 18 years, contrary to our expectations, a negative and significant association is observed with paid vacation offered. However, the result for vacation used is negative but not statistically significant. Maume (2006) also finds negative but not significant results. Similar to the discussions in the literature that fringe benefits are driven from the employers interests (see for example the Canadian case in Zeytinoglu et al., 2009 and the US case in Golden, 2005), our findings could be explained by such evidence that the choice of providing paid vacation could be weighted more by workplace characteristics or interests. With regard to the health variable, we find that being healthy is positively correlated with vacation used. However, this variable is not significant in the case of paid vacation. Altonji and Usui (2007) find that workers with health problems use less their paid vacation. However, Maume (2006) does not report any significant results. One might argue that employees with poor health conditions may take time-off for health reasons (disability) and do not use their vacation time. Also, there may exist some labor regulations that might not allow workers to use their vacation time for sickness leave. In this case, sick leave may reduce vacation used to recover from illness (Altonji and Usui, 2007). The estimated coefficient on immigrant workers is negative and statistically significant only for vacation used indicating that immigrants use less their paid vacation perhaps because they are 13.
(17) attracted to jobs with poor working conditions and are less likely to have family-friendly jobs (Golden, 2001; Fang et al., 2009). Contrary to our expectations, workers from large visible minority groups (i.e. Black, Filipino, Chinese, South/East/West Asian, and North African workers) receive the same amount of paid vacation. These results are in line with those reported in Maume (2006) who finds that the estimated coefficient on white workers is not significant. Also, Budd and Mumford (2006) find that the estimated coefficient on the proportion of workforce of ethnic origin is negative but not statistically significant in the probability of paid leave being available. In contrast, Altonji and Usui (2007) find that black workers have less paid vacation and vacation used than white workers. Overall, our results could be explained by the fact that workers of visible minority groups may be subject to the same conditions as white workers in Canada. These results can be related to those in Yap et al. (2014) which indicate that many employee and employer predictors are positively correlated with job satisfaction for both immigrants and native-born. Also, Chowhan et al. (2012) note that it is hard to derive conclusions about the relationships between non-wage benefits and the pay system for Canadian-born and ethnic groups workers because of the lack of consistency in the factors contributing to pay and benefits satisfaction across these two groups of workers. Similar to the findings for American workers reported by Maume (2006) and Altonji and Usui (2007), human capital variables reveal that paid and used vacations increase with seniority. A possible explanation is that one needs to accumulate enough firm-level skills (long job tenure) before receiving additional fringe benefits (Lipsett and Reesor, 1998). Also, it is reasonable to expect this outcome if greater seniority is linked with greater job security in which workers are encouraged to use more vacation time (Maume, 2006). Our results also demonstrate that labor market experience is related to higher paid and used vacations. This result is different from Altonji and Usui’s (2007) findings, which point to a weak effect. A possible explanation of paid vacation rising with experience can be based on some evidence arguing that wages and non-wages benefits are higher for experienced workers than unexperienced ones (e.g. Haegeland and Klette, 1999) where wages may exceed productivity for workers with longer experience (Salop and Salop, 1976). With regard to the level of education, we find that categories such as “Completed college or some university” and “Bachelor or higher education completed” generate a positive and significant result. Indeed, it is logical to believe that positions requiring a higher level of education are likely to include more paid vacation time. These results are in line with the existing evidence on paid vacation leave (Maume, 2006; Altonji and Usui, 2007) indicating that the higher the level of education is, the more employees use and enjoy paid vacation. 14.
(18) Job and firm characteristics We first start by looking into the variables related to non-standard work and “flexible” work arrangements. As expected, the results show that part-time workers have less paid vacation offered and vacation used. Conversely, the results show that workers with regular work schedules have more paid vacation and vacations used. These findings are in line with some other studies (e.g. Zeytinoglu and Cooke, 2005; Zeytinoglu et al., 2010) showing that a sizeable proportion of Canadian workers on part-time jobs receive fewer benefits than regular full-time workers. A possible explanation of the negative relationship between part-time status and vacation used is that part-time workers report having less stress than full-time workers (Marshall, 2001) suggesting more free time for part-time workers and perhaps less incentive to use more vacation time. Results also show that flexible work arrangement is negatively correlated with vacation used. It appears that flextime employees are less restricted by a lack of time and enjoy more free time and perhaps they do not need to use more vacation leave. This result is supported by Golden’s (2001) argument that having flexibility in working time may lead workers to forgo leisure time. The same pattern appears to work at home arrangement as well, i.e. working at home has a negative and significant association with vacation used. Evans (2002) argues that the provision of family-friendly arrangements such as working at home may lead to a greater mutual commitment between employers and employees. Eldridge and Pabilonia (2007) show that workers who bring work home have longer hours suggesting that these employees spend more time in their work tasks which may reduce the use of vacation time. Nonetheless, it is unsurprising that reduced workweek is negatively correlated with paid vacation, but positively related to vacation used. Golden (2011) reviewing a wide range of evidence on working time and productivity suggests that reduced “workload” arrangements involves also a commensurate pay reduction. This may lead workers with reduced working time to receive fewer benefits. He also notes that policies inducing a reduction of working time may take the form of shortened standard workweeks and the ability to increase the use of various forms of annual leave times. Our results underscore that being promoted and holding supervisory position are positively correlated with the amount of paid vacation, in accordance with some existing evidence (Maume, 2006). It seems that receiving higher paid vacation is positively linked to tasks requiring more responsibilities. This result confirm our expectations in which workers promoted and supervisor workers are often overburdened by additional responsibilities leading firms to offer them more fringe 15.
(19) benefits (Lowen and Sicilian, 2008; Kosteas, 2011). Turning to the amount of vacation used, we find that supervisors use less their vacation times as means for more work commitment (Maume, 2006). Interestingly, being promoted is positively correlated with vacation. This result may suggest that workers who realize they are going to win a promotion may increase work effort (Kosteas, 2011), which may possibly lead them to maximize the need for leisure time by using more their paid vacation. Collective agreement coverage and paid vacation were found to be positively correlated. This is consistent with previous findings in the literature form the US and Europe (UK) that the unionization increases the probability of receiving benefits (Green and Potepan, 1988; Green, 1997; Altonji and Usui, 2007). By the same token, firm size is found to be an important determinant of vacation leave. The results show that categories (20 to 99 employees, 100 to 499 employees and 500 employees or more) are positive and significant compared to smaller firms (less than 20 employees). On the one hand, large firms are more likely to have formal human resource management and fringe benefits than smaller ones (Evans, 2002; Zeytinoglu and Cooke, 2005). Thus, one can assume that larger firms meet vacation entitlement provisions more than smaller firms (Maume, 2006). On the other hand, small firms may have more difficulty in organizing work and filling vacant positions during employee vacations. This may prevent employees using all their vacation leave in small firms compared to large firms. Finally, our model controls for paid vacation among the independent variables when we examine the determinants of vacation used. It is presumed that employees will use more vacation days when their paid vacation entitlement is higher. Economic theory predicts that leisure time increases with extra weeks of paid vacation (Alesina et al., 2005; Aguiar and Hurst, 2007). That is, the amount of vacation used depends on how many vacation times a worker received. The results show that the amount of paid vacation offered is positively related to vacation used. The estimated coefficient on paid vacation is equal to 0.625. A comparison between this result and that of Altonji and Usui (2007) shows a difference in the magnitude of the coefficients. According to Altonji and Usui (2007), an additional paid vacation week implies an increase of approximately one used vacation week. However, our results indicate that an extra paid vacation week implies an increase of less than a week of vacation used. A possible explanation of this difference is that in some Canadian provinces, employees may prefer to waive their vacation for a specified year and receive payment. 16.
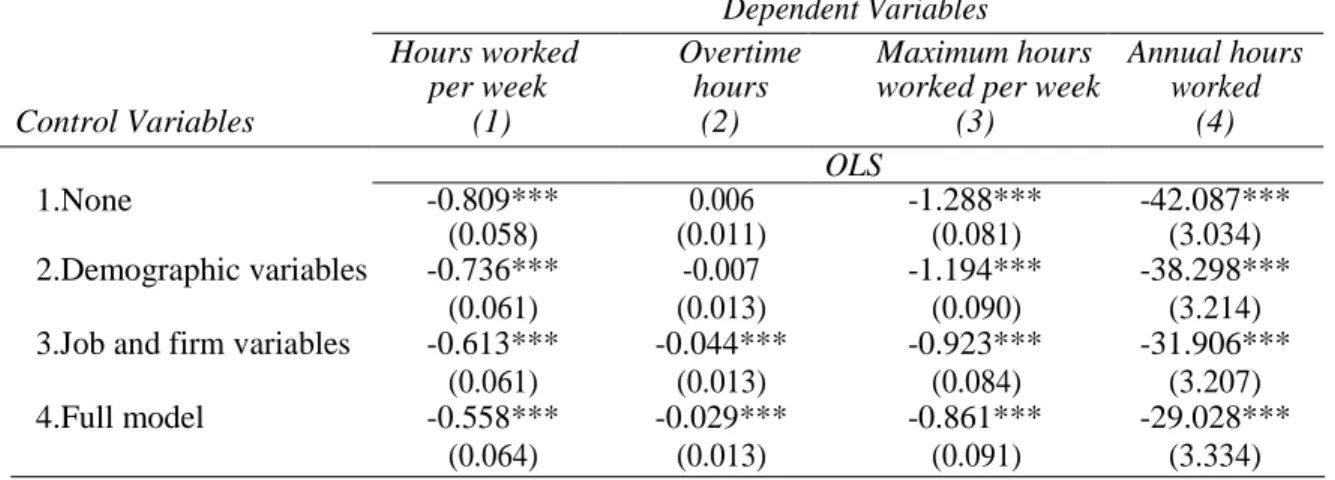
(20) instead of leave.10 This compensation is considered as additional income related to not using all one’s vacation days. 4.2 Vacation leave and relationships with hours worked and wages Table 4 presents the results of the relationship between vacation used and hours worked. We fit the model using OLS following Altonji and Usui (2007). Each column in the table identifies the dependent variable and refers to a separate regression. The row headings identify the controls used in the model. It is important to note that the definition of annual hours worked in the Canadian WES used in this paper is different from the US dataset used in Altonji and Usui (2007). Our dataset asked employees about their annual hours worked at the main job. However, Altonji and Usui (2007) used individual data, which made the distinction between annual hours worked on the main job and other jobs. In this restriction, we only compare hours worked on the main job between Canada and the US. Our results show that an extra week of vacation used leads to a decrease of approximately 42.087 (column 4, row 1) in annual hours worked when all controls are excluded from the model in line with results found in Altonji and Usui (2007), i.e., the average number of annual hours worked is reduced by more than a week of work. However, when we run the full specification that extends the Altonji and Usui’s (2007) model by adding job and firm characteristics, we find that an extra week of vacation used reduces the annual hours worked by only 29.028 hours (column 4, row 4). Thus, the results of the full model indicate that even though vacation used is strongly correlated with hours worked, this relationship is not one-to-one indicating that workers offset vacation used by working longer hours. Looking at the other dependent variables used as measures for work hours, i.e. hours worked per week in column 1, overtime hours in column 2, and maximum hours worked per week in column 3, we find that a similar discrepancy exists throughout the relationship between vacation used and different measures of work hours. Overall, the results confirm the negative relationship between working hours and the amount of vacation used even though the relationship between overtime hours and vacation used is weak. For example, an extra week of vacation used is associated with a reduction by 0.558 hours worked per week in the full model (column 1, row 4). We also observe the same trend when comparing these other measures of work hours with those found in Altonji and Usui (2007): the coefficients are smaller when we run the full model including the additional job and firm characteristics. 10. Source: Canada - working time - 2012 (Conditions of Work and Employment Programme, ILO).. 17.
(21) Taken together, these results point out to the role of job and firm factors in understanding the distribution of time between work and leisure chores. More importantly, our results support the hypothesis that pressure at work may lead employees to use more vacation days, but also causes them to work for longer hours. This is in line with Wooden and Warren’s (2008) argument that working long hours should increase the need and desire to use more the paid vacation. It is argued that workers may tend to work additional and longer hours without being directly rewarded with additional days of paid vacation leave as an investment in their human capital and career or to show a better work commitment. This leads to a higher work-related stress and to use more their paid vacation (Saborowski et al., 2005). Bell and Freeman (2001) note that workers choose to work harder and longer hours to improve their promotion and employment position in the future leading to increase the current effort and work pressure. In Table 5 we present the estimates of the relationship between paid vacation and hours worked. In addition to the OLS regression, we use the two-stage least squares regression (2SLS) that takes seniority as an instrument following Altonji and Usui (2007). The results show that an extra week of paid vacation is associated with a reduction in hours worked in the baseline and full models. The results with OLS model shows that an extra week of paid vacation reduces the annual hours worked by 38.118 hours (column 4, row 4) when we run the full model. In a comparison with Altonji and Usui’s (2007) OLS model, the results on paid vacation are different (they find a reduction of 4.972 hours on the main job). However, when we run the 2SLS model, we find that the relation is more negative, i.e. a reduction by 77.115 hours, and very close to those of Altonji and Usui (2007) (they find a reduction of 81.139 hours). Looking at the other dimensions of work hours, i.e. hours worked per week in column 1, overtime hours in column 2, and maximum hours worked per week in column 3, we find a similar trend in the results. For example, when all controls are excluded (column 1, row 1), we find that an extra week of paid vacation is associated with a reduction by 0.956 and 1.130 hours worked per week in the OLS and 2SLS models, respectively. However, when running the full set of control variables (column 1, row 4), the results show that an extra week of paid vacation is associated with a reduction by 0.733 and 1.482 hours worked per week in the OLS and 2SLS models, respectively. These results are generally more pronounced for Canada than for the US. Indeed, Altonji and Usui (2007) find that there is no offset or even a small reduction when using the other measures of work hours. Overall, these results confirm the role of paid vacation leave in determining and regulating working hours (Altonji and Usui, 2007). Even though labor legislations. 18.
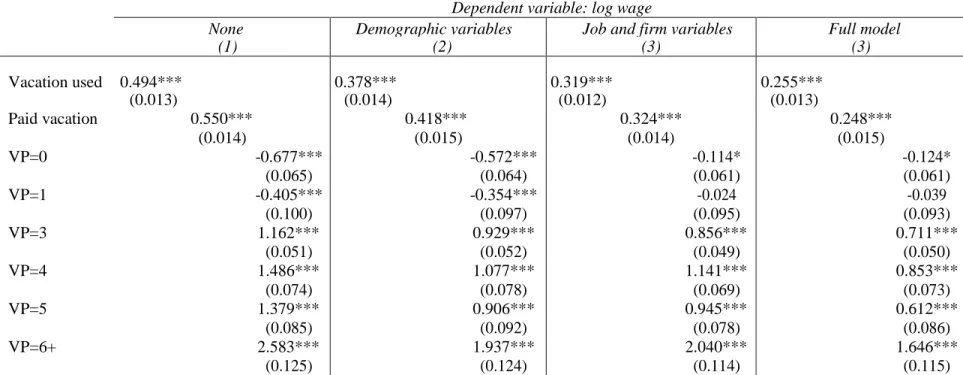
(22) regarding paid vacation are different in Canada and the US, paid vacation days are set either by law or by firms provide similar restrictions on hours worked. Finally, in Table 6, we report separate results for the relationship between vacation leave and hourly wages. Each column in the table identifies the controls used in the regression models. The results of the wage equation show a positive association between paid vacation and hourly wages as well as for vacation used in line with our expectations and consistent with evidence reported by Altonji and Usui (2007). In the case of used vacation weeks, the coefficient estimated goes from 0.494 when we exclude all controls to 0.255 in the full model. Turning to paid vacation weeks, the coefficient is equal to 0.550 in the initial model and 0.248 in the full model. This indicates that receiving more paid vacation time as a fringe benefit implies a higher salary. The results of the model with a set of dichotomous variables, indicating the number of paid vacation weeks, are negative and statistically significant for the category “0 and 1 week of paid vacation”. However, the relationship between paid vacation and hourly wages is positive for the 3-weeks category, and it increases substantially with additional weeks through with the 5- to 6-weeks category. Notice that the 2-week category of paid vacation is the category of reference. It appears that jobs offering less paid vacation time provide lower wages. A possible explanation of these positive relationships is the firms’ heterogeneity in the value of employee-employer matching process: some of the firms offer better wages and non-wages benefits to attract employees on the job market or to reduce turnover rate (Perry-Smith and Blum, 2001; Bloom et al., 2011) that best balance workers and firms preferences for paid vacation (Altonji and Usui, 2007).. 5. Conclusion This paper provides new evidence on the determinants of vacation leave and its relationship to hours worked and wages using Canadian linked employer-employee data that allow to control for detailed demographic, worker, job, and firm characteristics. The results of this paper provide directions to policy-makers since many employees do not use all the vacation leave to which they are entitled annually. This is particularly important since working Canadians wasted around $7.5 billion in unused vacation days in 2009.11. 11. This number is derived from the estimated amount of the total number of unused vacation days for all workers, which is equal to around 34 million of unused vacation days (Varnier Institute, 2012), and the average hourly wage which is equal $21.97 (Portrait of Canada’s Labour Force, Statistics Canada, 2009).. 19.
(23) The results show that human capital factors are important determinants of paid vacation leave. Specifically, we find that seniority is positively correlated with paid vacation and vacation used, i.e. the more stable employment is the more the paid vacation is used, in line with the US evidence. Interestingly, our results show that labor market experience is related to higher paid and used vacations. This result is different indeed from Altonji and Usui’s (2007) findings, which show a weak relationship. A possible explanation of paid vacation rising with experience can be based on some evidence arguing that experienced workers may have higher productivity than less experienced workers leading to higher wages and non-wage benefits. On the work arrangements, the results show that part-time workers have less paid vacation and vacation used in line with some Canadian evidence suggesting that a sizeable proportion of workers on part-time jobs receive fewer benefits. Results also show that flexibility in working time is negatively correlated with vacation used. It is argued that flexibility may lead workers to forgo leisure time resulting in longer working hours. The same pattern appears for work done at home, i.e. working at home has a negative and significant association with vacation used. Indeed, working at home may lead to a greater mutual commitment between employers and employees resulting in spending more time in work-related tasks. In terms of the relations to hours worked, the results emphasize that an extra week of vacation used leads to a decrease in annual hours worked by more than a week of work in line with results found in Altonji and Usui’s (2007) paper. However, when we run the full specification that extends the Altonji and Usui’s (2007) model by adding job and firm characteristics, we find that an extra week of vacation used reduces the annual hours worked by less than a week of work indicating that workers offset vacation used by working longer hours. Our results provide supporting evidence to the hypothesis that pressure at work may lead employees to use more vacation days, but also causes them to work for longer hours perhaps as a way to invest in their human capital and career or to improve their promotion and employment position in the future. Our results also indicate that hourly wage rates vary positively with both paid vacation and vacation used in line with results reported by Altonji and Usui (2007). This leads us to believe that receiving more paid vacation in terms of fringe benefits is an indication of higher wages. A possible explanation is that the heterogeneity of firms implies that some of them adopt a high level of wages and fringe benefits to attract and keep workers or to reduce turnover rate. Finally, it would be of interest for future research to provide additional evidence and trends on the use of vacation leave. For example, one may truncate the distribution of vacation used in 20.
(24) several categories (i.e. 0-7 days of vacation used, 8-14 days, 15-21 days, etc.) in order to see if the determinants of vacation used differ depending on changes in the amount of paid vacation offered. This may show how individuals use vacation days when paid vacation policies change and could be important for decision-makers aiming to improve the design of adequate leaves policies.. 21.
(25) References Aguiar M. and Hurst E. (2007) ‘Measuring Trends in Leisure: the Allocation of Time Over Five Decades’, Quarterly Journal of Economics 122: 969–1006. Alesina A., Glaeser E. and Sacerdote B. (2005) ‘Work and Leisure in the U.S. and Europe: Why so Different?’, NBER Macroeconomic Annual 20: 1–64. Altonji J. G. and Oldham J. (2003) ‘Vacation Laws and Annual Work Hours’, Economic Perspectives, Federal Reserve Bank of Chicago 27: 19–29. Altonji J. G. and Usui E. (2007) ‘Work Hours, Wages and Vacation Leave’, Industrial and Labor Relations Review 60: 408–428. Amuedo-Dorantes C. and Mach T. (2003) ‘Performance Pay and Fringe Benefits’, International Journal of Manpower 24: 673–698. Banerjee D. and Perrucci C. C. (2012) ‘Employee Benefits and Policies: do They Make a Difference for Work/Family Conflict?’, Journal of Sociology and Social Welfare 39:131–147. Bardoel E. A., Moss S. A., Smyrnios K. and Tharenou P. (1999) ‘Employee Characteristics Associated with the Provision of Work-Family Policies and Programs’, International Journal of Manpower 20: 563–576. Becker G. S. (1985) ‘Human Capital, Effort, and the Sexual Division of Labor,’ Journal of Labor Economics 3: S33–S58. Becker G. and Tomes N. (1986) ‘Human Capital and the Rise and Fall of Families’, Journal of Labor Economics 4: S1–S39. Bell L. and Freeman R. (2001) ‘The Incentive for Working Hard: Explaining Hours Worked Differences in the US and Germany’, Labour Economics 8: 181–202. Bianchi S. M., Milkie M. A., Sayer L. C. and Robinson J. P. (2000) ‘Is Anyone Doing the Housework? Trends in the Gender Division of Household Labor’, Social Forces 79: 191–228. Bloom N., Kretschmer T. and Van Reenen J. (2011) ‘Are Family-Friendly Workplace Practices a Valuable Firm Resource?’, Strategic Management Journal 32: 343–367. Buckley J. E. (1989) ‘Variations in Holidays, Vacations, and Area Pay Levels’, Monthly Labor Review 112: 24–30. Budd J. W. and Mumford K. A. (2006) ‘Family-Friendly Work Practices in Britain: Availability and Perceived Accessibility’, Human Resource Management 45: 91–110. Chernozhukov V., Fernández-Val I., Hahn J. and Newey W. K. (2009) ‘Identification and Estimation of Marginal Effects in Nonlinear Panel Models’, Working paper, MIT University, Department of Economics. Chowhan J., Zeytinoglu I. U. and Cooke G. B. (2012) ‘Are Immigrants’ Pay and Benefits Satisfaction Different than Canadian-born?’, Relations industrielles/Industrial Relations 67: 3–24. Cooke G. B. (2007) ‘Alternative Work Schedules and Related Issues among Atlantic Canadians’, The Workplace Review 4: 8–15. Drolet M. (2011) ‘Why has the Gender Wage Gap Narrowed?’, Perspectives on Labour and Income 23: 1–13.. 22.
(26) Eldridge L. and Pabilonia S. (2007) ‘Are Those Who Bring Work Home Really Working Longer Hours?’, BLS Working Paper No. 406. Evans J. M. (2002) ‘Work/Family Reconciliation, Gender Wage Equity and Occupational Segregation: the Role of Firms and Public Policy’, Canadian Public Policy 28: S187–S216. Fang T. and Heywood J. (2010) ‘Immigration, Ethnic Wage Differentials and Output Pay in Canada’, British Journal of Industrial Relations 48: 109–130. Fang T., Zikic J. and Novicevic M. M. (2009) ‘Career Success of Immigrant Professionals: Stock and Flow of their Career Capital’, International Journal of Manpower 30: 472–488. Frone M. R., Russell M. and Cooper M. L. (1992) ‘Antecedents and Outcomes of Work-Family Conflict: Testing a Model of Work-Family Interface’, Journal of Applied Psychology 77: 65–78. Gariety B. and Shaffer S. (2001) ‘Wage Differentials Associated with Flextime’, Monthly Labor Review 124: 69-75. Gayle G.-L., Golan L. and Miller R. A. (2012) ‘Gender Differences in Executive Compensation and Job Mobility’, Journal of Labor Economics 30: 829–871. Golden L. (2001) ‘Flexible Work Schedules: What are we Trading off to Get them?’, Monthly Labor Review 124: 50–67. Golden L. (2005) ‘The Flexibility Gap: Employee Access to Flexibility in Work Schedules’, in Zeytinoglu I. U. (ed.) Flexibility in Workplaces: Effects on Workers, Work Environment and the Unions, IIRA/ILO, Geneva: 1–19. Golden L. (2011) ‘The effects of Working Time on Productivity and Firm Performance: a Research Synthesis Paper’, ILO Conditions of Work and Employment Series No. 33. Gray M. and Tudball J. (2003) ‘Family-Friendly Work Practices: Differences within and between Workplaces’, Journal of Industrial Relations 45: 269–291. Green F. (1997) ‘Union Recognition and Paid Holiday Entitlement’, British Journal of Industrial Relations 35: 243–255. Green F. and Potepan M. J. (1988) ‘Vacation Time and Unionism in the U.S. and Europe’, Industrial Relations 27: 180–194. Haegeland T. and Klette T. (1999) ‘Do Higher Wages Reflect Higher Productivity? Education, Gender and Experience Premiums in a Matched Plant-Worker Data Set’, in Haltiwanger J., Lane J., Spletzer J., Theeuwes J. and Troske K. (ed.), The Creation and Analysis of Employer-Employee Matched Data, North-Holland: Elsevier: 231–259. Heywood J. S., Siebert W. S. and Wei X. (2007) ‘The Implicit Wage Costs of Family-Friendly Work Practices’, Oxford Economic Papers 59: 275–300. Hwang H.-S., Mortensen D. and Reed W. R. (1998) ‘Hedonic Wages and Labor Market Search’, Journal of Labor Economics 16: 815–847. Johnson N. and Provan K. (1995) ‘The Relationship between Work/Family Benefits and Earnings: a Test of Competing Predictions’, Journal of Socio-Economics 24: 571–584. Kosteas V. D. (2009) ‘Job level changes and wage growth’, International Journal of Manpower 30: 269–284.. 23.
(27) Kosteas V. D. (2011) ‘Job Satisfaction and Promotions’, Industrial Relations 50: 174–194. Lang K. and Majumdar S. (2004) ‘The Pricing of Job Characteristics When Markets Do Not Clear: Theory and Policy Implications’, International Economic Review 45: 1111–1128. Lazear E. and Rosen S. (1981) ‘Rank-Order Tournaments as Optimum Labor Contracts’, Journal of Political Economy 89: 841–864. Li G. (2009) ‘Do Constraints on Market Work Hours Change Home Production Efforts?’, Finance and Economics Discussion Series No. 2009-21, Board of Governors of the Federal Reserve System. Lipsett B. and Reesor M. (1998) ‘Alternative Work Arrangements in Canadian Workplaces’ The Changing Nature of Work, Employment and Workplace Relations: Selected Papers from the 34th Annual of the Canadian Industrial Relations Association (CIRA) Conference, 29–44. Lowen A. and Sicilian P. (2008) ‘Family-Friendly Fringe Benefits and the Gender Wage Gap’, Journal of Labor Research 30: 101–119. Maume D. J. (2006) ‘Gender Differences in Taking Vacation Time’, Work and Occupations 33: 161–190. Marshall K. (2001) ‘Part-Time by Choice’, Perspectives on Labour and Income 13: 20–27. Marshall K. (2006) ‘Converging Gender Roles’, Perspectives on Labour and Income 7: 5–19. Ohtake F. (2003) ‘Unions, the Costs of Job Loss, and Vacation’ in Seiritsu O., Toshiaki T. and Wise D. A. (ed.) NBER book Labor Markets and Firm Benefit Policies in Japan and the United States, University of Chicago Press: 371–390. Pergamit M. R. and Veum J. R. (1999) ‘What is a promotion?’, Industrial and Labor Relations Review 52: 581–601. Perry-Smith J. E. and Blum T. C. (2001) ‘Work-Family Human Resource Bundles and Perceived Organizational Performance’, The Academy of Management Journal 43: 1107–1117. Prescott E. C. (2004) ‘Why Do Americans Work So Much More Than Europeans?’, Federal Reserve Bank of Minneapolis Quarterly Review 28: 2–13. Ray R., Sanes M. and Schmitt J. (2013) ‘No-Vacation Nation Revisited’, Center for Economic and Policy Research Discussion Paper. Rebitzer J. B. and Taylor L. J. (1995) ‘Do Labor Markets Provide Enough Short-Hour Jobs? An Analysis of Work Hours and Work Incentives’, Economic Inquiry 33: 257–273. Reitz J. G. and Verma A. (2004) ‘Immigration, Race, and Labor: Unionization and Wages in the Canadian Labor Market’, Industrial Relations 43: 835–854. Saborowski C., Schupp J. and Wagner G. G. (2005) ‘Annual Leave in Germany: Employees Frequently Do Not Take up Their Full Entitlement’, Economic Bulletin 41: 209–214. Salop J. and Salop S. C. (1976) ‘Self-Selection and Turnover in the Labor Market’, Quarterly Journal of Economics 90: 619–627. Sayer L. C. (2005) ‘Gender, Time, and Inequality: Trends in Women’s and Men’s Paid Work, Unpaid Work, and Free Time’, Social Forces 84: 285–303.. 24.
(28) Senesky S. (2004) ‘Testing the Intertemporal Labor Supply Model: Are Jobs Important?’, Labour Economics 12: 749–772. Solberg E. and Laughlin T. (1995) ‘The Gender Pay Gap, Fringe Benefits, and Occupational Crowding’, Industrial and Labor Relations Review 48: 692–708. Van Giezen R. W. (2013) ‘Paid leave in private industry over the past 20 years’, Beyond the Numbers: Pay & Benefits, U.S. Bureau of Labor Statistics 2: 1–6. Verma A. (2007) ‘What do Unions do in the Workplace: Union effects on Management and HRM Policies’, in Bennett J. and Kaufman B. (ed.), What Do Unions Do? A Twenty Year Perspective, New Brunswick: Transactions Press: 275–312 Wooden M. and Warren D. (2008) ‘Paid Annual Leave and Working Hours: Evidence from the HILDA Survey’, Journal of Industrial Relations 50: 664–670. Yap M., Holmes M., Hannan C.-A. and Cukier W. (2014) ‘Correlates of Career Satisfaction in Canada—the Immigrants’ Experience’, Journal of International Migration and Integration 15: 49-71. Zeytinoglu I. U. and Cooke G. (2005) ‘Non-Standard Work and Benefits: has anything Changed since the Wallace Report?’, Relations industrielles/Industrial Relations 60: 29–63. Zeytinoglu I. U., Cooke G. and Mann S. (2009) ‘Flexibility: Whose Choice Is It Anyway?’, Relations industrielles/Industrial Relations 64: 555–574. Zeytinoglu I. U., Cooke G. and Mann S. (2010) ‘Employer Offered Family Support Programs, Gender and Voluntary and Involuntary Part-Time Work’, Relations industrielles/Industrial Relations 65: 177–195.. 25.
(29) Percent. Figure 1: Distribution of VacationWeeks for Men in 2005 50 45 40 35 30 25 20 15 10 5 0. Weeks of Paid Vacation: Mean = 2.67 Weeks of Vacation Used: Mean =2.10. 0. 1. 2. 3. 4. 5. 6+. Vacation Weeks. Percent. Figure 2: Distribution of VacationWeeks for Women in 2005 50 45 40 35 30 25 20 15 10 5 0. Weeks of Paid Vacation: Mean = 2.63 Weeks of Vacation Used: Mean =2.12. 0. 1. 2. 3. 4. 5. 6+. Vacation Weeks. Percent. Figure 3: Distribution of VacationWeeks used minus VacationWeeks Paid in 2005 65 60 55 50 45 40 35 30 25 20 15 10 5 0 -6. -5. -4. -3 -2 -1 0 1 2 3 VacationWeeks Used – VacationWeeks Paid. Sources: Statistics Canada, Workplace Employee Survey (WES).. 26. 4. 5. 6+.
(30) Variable. Table 2: Weighted descriptive statistics 1999 Mean. Demographic and human capital characteristics Women Married Age Number of children aged 0 to 18 Monoparental No activity limitation due to health issues Immigrant Black Filipino Chinese South/East/West Asian North African Seniority Experience Vocational diploma or some college Completed college or some university Bachelor or higher education completed Industrial training or other Job and firm characteristics Work part-time Work regular hours Work from Monday to Friday Work flexible hours Work done at home Work on a reduced workweek Work on compressed workweek Natural logarithm of hourly wage Promotion received Supervise the work of other employees Covered by a collective bargaining agreement Workplace size: 19 employees and less 20-99 employees 100-499 employees 500 employees and more. 0.521 0.566 39.637 0.779 0.127 0.017 0.175 0.011 0.011 0.023 0.008 0.005 8.428 16.183 0.325 0.433 0.269 0.127. Std. Dev.. 2005 Mean. Std. Dev.. 0.499 0.522 0.495 0.531 11.064 40.902 1.040 0.680 0.333 0.118 0.129 0.022 0.380 0.179 0.105 0.010 0.100 0.008 0.156 0.031 0.090 0.012 0.073 0.005 8.192 8.748 10.713 17.569 0.468 0.271 0.495 0.462 0.443 0.287 0.333 0.067. 0.499 0.450 11.902 0.987 0.323 0.266 0.383 0.102 0.098 0.174 0.111 0.073 8.740 11.500 0.444 0.498 0.452 0.250. 0.201 0.709 0.254 0.393 0.295 0.139 0.085 2.775 0.381 0.379 0.280. 0.401 0.453 0.435 0.488 0.456 0.346 0.279 0.521 0.485 0.480 0.449. 0.209 0.683 0.780 0.366 0.243 0.069 0.080 2.936 0.376 0.387 0.261. 0.406 0.465 0.414 0.481 0.429 0.253 0.271 0.531 0.484 0.487 0.439. 0.874 0.108 0.015 0.002. 0.331 0.310 0.122 0.047. 0.822 0.155 0.019 0.002. 0.381 0.382 0.138 0.050. Number of employees Number of workplaces. 23,540 6,271. 27. 24,197 6,631.
Figure


+3

Documents relatifs
Ne croyez pas que le simple fait d'afficher un livre sur Google Recherche de Livres signifie que celui-ci peut etre utilise de quelque facon que ce soit dans le monde entier..
In table 8, I use the same model as before, testing whether a worker's hourly wage is higher after s/he has naturalized; this variable Citizenship is interacted with an indicator
We describe the workforce, made up in large part of women and immigrants, the requirements and constraints of production, workers’ strategies favouring production and those
~ber 5 willkiirlichen Punkten des R.~ gibt es eine Gruppe yon 32 (involutorischen) Transformationen, welche auch in jeder anderen iiber irgend 6 besonderen
As a direct application of our theorem, we are able to find out some new examples (see Example 2.5, 2.6 and Corollary 2.7) which satisfy Benford’s law. In the last section, we
First introduced by Faddeev and Kashaev [7, 9], the quantum dilogarithm G b (x) and its variants S b (x) and g b (x) play a crucial role in the study of positive representations
Existen otras bibliotecas españolas que participan de una forma más o menos activa en proyectos relacionados con la docencia: la Biblioteca de la UNED (integra sus
It is interesting to examine the determinants of vacation leave in the light of Canadian data, because Canadian labor legislation regarding paid vacation is
